
- About Us
- Information
-

The Author ensures that the research has been conducted responsibly and ethically with adherence to all relevant regulations. read more..
- For Authors
- For Reviewer
- Manuscript Guidelines
- Membership
- Publication Ethics
-
- Journals
- Reprints
- e-Books
- Videos
- Policies
- Contact Us
 COVID-19
- Submissions


Full Text
Progress in Petrochemical Science
Experimental Research on Reservoir Property and the Isothermal Adsorption Characteristics of Shale
Xiaobo Liu1,2, Ruizhong Jiang1*, Ting Yu1 and Weian Huang1
1School of Petroleum Engineering, China
2Shengli Oil Field Dongsheng Jing-gong Petroleum Development Group Co Ltd., China
*Corresponding author: Ruizhong Jiang, School of Petroleum Engineering, China
Submission: February 19, 2020;Published: February 25, 2020

ISSN 2637-8035Volume3 Issue2
Abstract
It is necessary to know the reservoir property and the isothermal adsorption characteristics of shale for the exploratory development of shale gas. Aimed at the shale reservoir in lower section of Shahejie 3 Group in Shengli Oilfield, total mineral composition and relative content of clay mineral are analyzed by X-ray diffraction, porosity and specific surface area are tested by nitrogen adsorption method, ultra-low permeability are measured by differential pressure pulse decay and the pore structures are evaluated by using 3H-2000PS1 full automatic aperture analyzer of shale. Results show that the average content of fragile mineral (quartz, feldspar, calcite) is up to 65%, the average content of clay mineral mainly composed of illite is 27%, porosity distribution of this shale is from 0.62% to 2.68%, the average Langmuir specific surface area is 0.94m2/g, the permeability is in range of 0.008mD-0.022mD, the aperture is between 1.7nm and 77nm. The isothermal adsorption experimental results indicate that the adsorption of methane gas on this shale surface accords with Langmuir isothermal adsorption equation, increasing pressure and decreasing temperature are beneficial for shale to adsorb methane gas, and the adsorption of methane gas are in positive correlation with TOC content and specific surface area of shale.
Keywords: Shale reservoir; Isothermal adsorption; Porosity; Permeability; TOC; Specific surface area
Introduction
The exploration and development of shale gas in China is in its initial stage, but the geological conditions in our country are very beneficial to the enrichment of shale gas, and many basins have the geological conditions of shale gas reservoir formation [1]. Compared with conventional gas reservoirs, shale gas reservoirs are self-generated reservoirs [2,3]. Because shale has the characteristics of low pore and low permeability, it is both a source rock of shale gas and a reservoir and caprock [4,5]. According to the genesis of shale gas, it can be divided into thermogenic type, biogenic type and mixed genetic type gas reservoir [6,7]. There are two main ways of shale gas occurrence in the reservoir, one is that shale gas exists in the adsorbed state on the surface of organic matter and clay mineral particles, the other is in the free state in the natural fractures, macro pores, and matrix pores [8]. The storage and seepage space in shale is mainly pore and fracture [9]. Therefore, the description of shale reservoir characteristics and adsorption characteristics is of great significance to the efficient drilling and development of shale gas and shale oil in China.
Characteristics of Shale Gas Reservoir
Characteristics of shale minerals
X-ray diffraction was used to analyze the whole rock minerals and clay minerals of the shale reservoir in the lower Shahejie Section 3 of Shengli Oilfield. It can be seen from Table 1 that the average quartz content in the shale reservoir is 27%, the total average content of potassium feldspar and plagioclase is 16%, the average content of calcite is 22%, and the average content of clay mineral is 27%. The brittle mineral reaches 65%, indicating that the reservoir has strong jointing capacity, especially suitable for increasing production measures such as hydraulic fracturing, and it is easy to produce fracture network [10]. The clay mineral is mainly water-bearing aluminosilicate with large surface area and a large amount of charge, and its content is high, then the reservoir has a strong ability to adsorb shale gas. It can be seen from Table 2 that among the clay minerals of rock samples, the content of kaolinite, chlorite as well as illite montmorillonite mixture is low, and the content of weakly hydrated or difficultly hydrated illite is close to 70%, which is favorable for later reservoir fracturing and jointing [11].
Table 1: Results of mineral composition analysis by X-ray diffraction.

Table 2: Results of the relative contents analysis of clay minerals by X-ray diffraction.

Test results of shale porosity and true density
Based on the Archimedes principle-gas expansion displacement method and the Boer's law of inert gas with small molecular diameter under certain conditions (PV = ZnRT), the porosity of the core sample is obtained through measuring the reduction of the gas capacity of the sample test cavity caused by placing the sample into the test cavity of the sample [12]. The porosity of the core of shale reservoir in the lower section 3 of Shahejie Group of Shengli Oilfield was analyzed by using the 3H-2000TD2 automatic true density tester of Bethesda Corporation. The test results Table 3 showed that the porosity of the shale was between 0.62% and 2.68%, the true density was between 2.44g/cm3 and 2.50g/cm3.
Table 3: Results of true density and porosity measurement of shale core samples.

Figure 1: Differential integral pore volume and pore size distribution curve tested by BJH method.

Test results of shale pore size distribution and surface area
According to the capillary condensation and the principle of volume equivalent exchange, the pore size of rock samples is measured, in which capillary condensation is the phenomenon that the vapor adsorbed by the adsorbent condenses in its micro pores at a certain temperature. The specific surface area and pore size distribution of the core of shale reservoir in the lower section 3 of Shahejie Group of Shengli Oilfield were analyzed by using the automatic surface area and pore size analyzer of type 3H-2000PS1 from Bethesda Corporation. The specific surface area of powdered rock samples was analyzed by methylene blue method. It can be seen from Table 4 and Figure 1 that the Langmuir surface area of this shale reservoir is range from 0.15m2/g to 1.3m2/g and the bet surface area is between 0.093m2/g and 0.615m2/g; the pore diameter is mainly in the range of 2nm-5nm and the pore size range is in the range of 1.7nm-77nm.
Table 4: Results of specific surface area of shale core samples.

Analysis of permeability characteristics of shale
Using the PDP-200 Gas Permeability Meter of the American core company, the Kirschner permeability of the core sample was measured under the condition of simulated formation overburden (maximum pressure 70MPa) by pulse decay subtraction according to the requirements of the American petroleum society standard (API RP-40). The experimental results show that the permeability distribution of the shale is between 0.0001 and 0.2mD. The common method cannot accurately measure the permeability of shale gas reservoir rock samples, it is necessary to use the unsteady state method (pressure pulse decay subtraction) to measure the permeability. This method is suitable for measuring the ultra-low permeability core, and the stability time is short and so testing speed is fast. In this study, a PDP-200 gas permeability measuring instrument was used to measure the Kernel permeability of core samples according to the requirements of the American petroleum society standard (API RP-40) under simulated formation overburden (maximum pressure 70MPa). The formula for calculating Kirschner permeability is as follows:
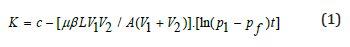
where:K is gas-measured permeability, μm2; p1 is the upper and lower flow pressure of the rock sample, MPa; V1, V2 is the upper and lower flow vessel volume, m3; Pf is the equilibrium pressure value of V1 and V2, MPa; A is the cross section area of the sample, m2; L is the sample length, m; β is the compression ratio of the flow medium, 1/MPa; μ is the viscosity coefficient, Pa.s; c is the integral constant; t is the pressure decay time of V1, s. The test results show that the permeability distribution of the core of the shale reservoir in the lower section 3 of Shahejie Group of Shengli Oilfield is between 0.008mD and 0.022mD. The permeability of the 3528m, 3529m and 3532m cores are 0.014mD, 0.022mD and 0.008mD, respectively.
Analysis of Total Organic Carbon Content in Shale Gas Reservoir
The total organic carbon content of shale samples with different depths in the lower section 3 shale reservoir of the of Shahejie Group of Shengli Oilfield is analyzed using the CS-230 carbon-sulfur analyzer from the America LECO company. From the test results in Table 5, the total organic carbon content minimum of the shale reservoir is 2.61%, the highest is 4.92%, the average is 3.19%. The organic matter content is high, which is beneficial to produce and adsorb more shale gas, and the reservoir has high hydrocarbon potential. The reason is that organic matter in shale reservoirs, on the one hand, is the material basis for producing shale gas and the main controlling factor of shale gas content; on the other hand, the higher the organic carbon content, the larger the pore space of shale, the more natural gas can be adsorbed, and the larger the free gas content of the reservoir [9,10]
Table 5: Results of total organic carbon c and total sulfur content measurement test.

Isothermal adsorption characteristics of shale
The isothermal adsorption curve of shale is the curve to describe the gas storage capacity of shale gas reservoir, and the gas adsorption capacity of shale is a function of pressure at constant temperature. There are two ways of shale gas occurrence in the reservoir, one is free state, the other is adsorption state [13]. The free shale gas is mainly stored in the micro fracture of shale, which can be described by the real gas state equation:

The adsorbed state is an important state of shale gas, which is mainly stored on the inner surface of shale matrix pore. By measuring the adsorption capacity of shale on methane under a series of relative pressures and analyzing the relationship curves between adsorption capacity and pressure under different isothermal conditions of rock samples. It can be found from the results that the adsorption of methane by shale follows the Langmuir isothermal adsorption relationship [14], which can be described by Langmuir isothermal adsorption equation:
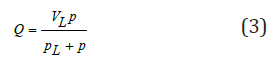
Where: Q is adsorption capacity, m3/kg; p is shale gas reservoir pressure, MPa; vL is Langmuir volume, m3/kg; pLis Langmuir pressure, MPa. vL is the adsorption capacity per gram of adsorbent when the surface is covered with a single molecular layer, representing the maximum adsorption capacity of the shale; pL is the ratio of the desorption rate constant to the adsorption constant, indicating the pressure when the adsorption capacity of the shale is half its maximum adsorption capacity. According to this principle, a shale-methane gas high temperature and high pressure isothermal adsorption tester (Figure 2) is designed, which mainly includes buffer vessel chamber, sample chamber, pressure gauge to measure the pressure of each vessel, six-way valve return valve, high pressure methane gas cylinder, vacuum pump, constant temperature chamber, etc. The core of the shale reservoir in the lower section 3 of Shahejie Group of Shengli Oilfield was selected. The equipment was used to test the curve of their adsorption capacity of methane with pressure under isothermal conditions, and the curve was fitted by Langmuir equation. The effects of pressure, temperature, shale toc content and specific surface area on the adsorption capacity of methane were further tested.
Figure 2: The scheme of shale gas adsorption analytical evaluation device.

Effects of temperature and pressure on methane adsorption
Figure 3 & 4 are the isothermal adsorption curves of 3528m and 3529m shale samples at different temperatures and pressures, respectively. The points in the figure are the experimentally measured data points and the solid lines are the fitted curves calculated by the Langmuir formula (the same below). As can be seen from Figures 3 & 4, the experimental data are very consistent with the data calculated by the Langmuir formula; with the increase of pressure, the adsorption of methane on the shale core increases rapidly with the increase of pressure at low pressure, and the increase of adsorption increases slowly when the pressure increases to a certain value. At different temperatures, the higher the temperature, the adsorption of methane is smaller, and the higher temperature is beneficial to the desorption of methane.
Figure 3: Experimental curves of isothermal adsorption of 3,528m shale samples at different temperatures.

Figure 4: Experimental curves of isothermal adsorption of 3,529m shale samples at different temperatures.

Effect of total organic carbon content on methane adsorption
Figure 5 & 6 are isothermal adsorption curves of 3528m, 3529m, 3532m and 3574m shale samples with similar surface area size and different to total organic carbon (TOC) content at 25 ℃. It can be seen from Figures 5 & 6 that for shale with similar surface area but different TOC content, the adsorption gas content not only increases with the increase of pressure, but also adsorbs more gas with the increase of organic carbon content, showing a significant positive correlation.
Figure 5: Experimental curves of isothermal adsorption of 3528m and 3529m shale samples.

Figure 6: Experimental curves of isothermal adsorption of 3532m and 3574m shale samples.

Effect of surface area on methane adsorption
Figure 7 & 8 are isothermal adsorption curves of 3529m and 3532m shale samples with like toc content and different specific surface area at 25 ℃. As can be seen from Figures 7 & 8, for shale with equal TOC content but different specific surface area, the adsorption gas content not only increases with the increase of pressure, but also the larger the specific surface area of rock sample, the more methane adsorbed [15].
Figure 7: Experimental curves of isothermal adsorption of 3529m shale samples (1# and 2#).

Figure 8: Experimental curves of isothermal adsorption of 3532m shale samples (3# and 4#).

Conclusion
- The brittle mineral of the lower section 3 shale reservoir of the of Shahejie Group of Shengli Oilfield is 65%, the clay mineral is mainly Illite, the porosity is less than 3%, the permeability is generally less than 0.03mD, and the pore diameter is mainly distributed between 2nm and 5nm, indicating the shale gas reservoirs in target blocks was characterized of low porosity and low permeability reservoirs.
- The Langmuir surface area of target shale reservoir is between 0.15m2/g and 1.3m2/g, the total organic carbon content is range of 2.61%-4.92%, showing that the studied formation is a potential source rock shale gas reservoir.
- The isothermal adsorption of methane gas by the core of the lower section 3 of Shahejie Group in Shengli Oilfield conforms to the law of Langmuir adsorption, and the higher the pressure and lower the temperature, the more favorable the adsorption of methane is, and there is a significant positive correlation with the TOC content and specific surface area of shale.
References
- Nie Haikuan, Xuan Tang, Bian RK (2009) Controlling factors for shale gas accumulation and prediction of potential development area in shale gas reservoir of South China. Shiyou Xuebao/Acta Petrolei Sinica 30(4): 484-491.
- Jarvie DM, Hill RJ, Ruble TE, Pollastro RM (2007) Unconventional shale-gas systems: the mississippian barnett shale of north-central Texas as one model for thermogenic shale-gas assessment. AAPG Bulletin 91(4): 475-499.
- Hill RJ, Zhang E, Katz BJ, Tang Y (2007) Modeling of gas generation from the barnett shale, Fort Worth Basin, Texas. AAPG Bulletin 91(4): 501-521.
- Zhang Xuefeng, Lu Xiancai, Zhang Linye, Liu Qing (2010) Occurrence of shale gas and their petroleum geological significance. Advances in Earth Science 25(6): 597-604.
- Ross DJ, Bustin RM (2008) Characterizing the shale gas resource potential of devonian-mississippian strata in the Western Canada sedimentary basin: application of an integrated formation evaluation. AAPG Bulletin 92(1): 87-125.
- Bustin RM (2005) Gas shale tapped for big pay. AAPG Explorer 26(2): 5-7.
- Zou C, Dong D, Wang S, Li Jianzhong, Li Xinjing, et al. (2010) Geological characteristics formation mechanism and resource potential of shale gas in China. Petroleum Exploration and Development 37(6): 641-653.
- Tian H, Zhang SC, Liu SB, Zhang H (2012) Determination of organic-rich shale pore features by mercury injection and gas adsorption methods. Shiyou Xuebao/Acta Petrolei Sinica 33(3): 419-427.
- Javadpour F (2009) Nanopores and apparent permeability of gas flow in mudrocks. Journal of Canadian Petroleum Technology 48(8): 15-20.
- Yuman W, Dazhong D, Jianzhong Li, Shejiao W, Xinjing Li, et al. (2012) Reservoir characteristics of shale gas in longmaxi formation of the lower silurian, southern Sichuan. Acta Petrolei Sinica 33(4): 551-561.
- Haikuan N, Jinchuan Z, Yuxi Li (2011) Accumulation conditions of the lower cambrian shale gas in the sichuan basin and its periphery. Acta Petrolei Sinica 32(6): 959-967.
- Prasad M, Bathija AP, Johnston M, Rydzy M, Batzle M (2009) Rock physics of the unconventional. The Leading Edge 28(1): 34-38.
- Ramos Sharleen (2004) The effect of shale composition on the gas sorption potential of organic-rich mud rocks in the Western Canadian Sedimentary Basin. UBC Theses and Dissertations.
- Chalmers GRL, Bustin RM (2007) The organic matter distribution and methane capacity of the lower cretaceous strata of northeastern British Columbia, Canada. International Journal of Coal Geology 70(1-3): 223-239.
- Ross DJK, Bustin RM (2009) The importance of shale composition and pore structure upon gas storage potential of shale gas reservoirs. Marine and Petroleum Geology 26(6): 916-927.
© 2020 Ruizhong Jiang. This is an open access article distributed under the terms of the Creative Commons Attribution License , which permits unrestricted use, distribution, and build upon your work non-commercially.
Editor In Chief


.jpg)


Signup for Newsletter

Quick Links
 Editorial Board Registrations
 Submit your Article
 Refer a Friend
 Advertise With Us
Our Recent Edition

.jpg)


Top Editors


.jpg)


.bmp)
.jpg)
.png)
.jpg)


.jpg)


.png)

.png)


.png)


Financial Support

Sponsors

Latest e-Books

Latest Video

 a Creative Commons Attribution 4.0 International License. Based on a work at www.crimsonpublishers.com.
Best viewed in
a Creative Commons Attribution 4.0 International License. Based on a work at www.crimsonpublishers.com.
Best viewed in