
- About Us
- Information
-

The Author ensures that the research has been conducted responsibly and ethically with adherence to all relevant regulations. read more..
- For Authors
- For Reviewer
- Manuscript Guidelines
- Membership
- Publication Ethics
-
- Journals
- Reprints
- e-Books
- Videos
- Policies
- Contact Us
 COVID-19
- Submissions


Full Text
Orthopedic Research Online Journal
Spondylolisthesis Grade Prediction Using Stacking Models
Aqsa Anjum1, Manzoor Ahmad2, Rabia Mahboob subhani3, Huma Fatima4 and Umair Arif5*
1Doctor of Physical Therapy at Diam Clinic Pattoki, Pakistan
2School Education Department, Govt of Punjab, Pakistan
3Doctor of Physical Therapy at Allied College of Health Sciences Multan, Pakistan
4Institute of Industrial Biotechnology, GCU Lahore, Pakistan
5School of Mathematics and Statistics, Xian Jiaotong University, Xian Shaanxi, China
*Corresponding author:Umair Arif, School of Mathematics and Statistics, Xi’an Jiaotong University, Xian Shaanxi, China
Submission: September 30, 2024;Published: October 10, 2024

ISSN: 2576-8875 Volume11 Issue3
Abstract
Spinal disorders, particularly spondylolisthesis, significantly impact millions of individuals worldwide. This study investigates the application of machine learning techniques to predict the grade of spondylolisthesis based on key anatomical features. Utilizing a dataset of 310 orthopedic patients, we employed Logistic Regression (LR), Decision Tree (DT), AdaBoost, and a stacking ensemble model, applying the SMOTE technique to address class imbalance. The models were evaluated using accuracy, precision, F1-score, and sensitivity metrics. The stacking model outperformed all other approaches, achieving an accuracy of 85.48%, precision of 85.28%, F1-score of 85.24%, and sensitivity of 85.35%. AdaBoost demonstrated competitive performance with 82.25% accuracy, while the Decision Tree and Logistic Regression models lagged, particularly in sensitivity. The Stacking Ensemble model performs the best with an AUC of 0.97250. These results highlight the effectiveness of machine learning in enhancing diagnostic accuracy for spondylolisthesis, paving the way for improved clinical decision-making and personalized treatment strategies.
Keywords:Spondylolisthesis; Spinal disorders; Machine learning; Stacking ensemble
Introduction
Spinal disorders are among the most common causes of disability worldwide, affecting millions of people each year. These disorders encompass a wide range of conditions that impact the spine’s structure and function, leading to pain, discomfort, and, in severe cases, neurological complications [1,2]. One such condition, spondylolisthesis, is a spinal disorder in which one vertebra slips forward over the vertebra below it. This displacement can cause significant back pain, nerve compression, and in some cases, even loss of mobility [3-5]. Spondylolisthesis can result from several factors, including degenerative changes due to aging, trauma, congenital abnormalities, or repetitive stress on the spine [6]. The severity of the condition is typically classified into grades based on the degree of vertebral slippage, with Grade 1 representing mild slippage and Grade 5 indicating complete vertebral displacement [7,8]. The higher the grade, the more severe the symptoms, which can range from localized back pain to more serious complications like sciatica, tingling in the legs, and muscle weakness [9,10].
Diagnosing and predicting the progression of spondylolisthesis often requires a comprehensive understanding of various anatomical and biomechanical parameters of the spine and pelvis [11]. Factors such as pelvic orientation, lumbar curvature, and the alignment of vertebrae are critical in assessing both the onset and severity of the condition [12]. Traditionally, clinicians have relied on radiographic measurements and subjective assessments to evaluate these features, but this approach can be time-consuming, and the results may vary between different practitioners [13].
Recent advancements in computational methods, particularly in the fields of machine learning and statistical analysis, have opened new avenues for more objective, data-driven approaches to diagnosing spinal disorders [14]. By analyzing large datasets containing detailed biomechanical measurements, these models can potentially uncover complex relationships between anatomical features and the development of conditions like spondylolisthesis. This approach promises to improve diagnostic accuracy and predict the condition’s progression, allowing for more personalized treatment plans [15].
Machine learning techniques offer significant advantages over traditional diagnostic approaches, as they can handle large volumes of data and uncover intricate patterns that may not be evident through manual analysis [15-17]. In this study, we employed machine learning algorithms such as Logistic Regression (LR), Decision Tree (DT), AdaBoost, and stacking model to predict the grade of spondylolisthesis based on key anatomical features. The models were evaluated using metrics like accuracy, precision, and other performance indicators to determine the most reliable method. The objective of this study is to accurately predict the grade of spondylolisthesis and identify the most influential anatomical features, ultimately developing a predictive model that can enhance clinical decision-making and improve patient care.
Methodology
Data description and pre-processing
We take a dataset on orthopedic patients from the UCI repository [18], which consists of 6 independent features and 1 feature used as a target “Class”. The class consists of two outcomes “Normal” and “Abnormal. The total dataset consists of 310 patients of which 210 were in the abnormal category and the remaining 100 were lying in normal cases explained in Figure 1. In the dataset, there were no missing values and no outlier occurred but the data was imbalanced to make the dataset balanced using the smote technique [19,20] to make the dataset balanced. In this study, we employed machine learning models such as Logistics regression (LR), Decision Tree (DT), AdaBoost, and stacking model.
Figure 1:Study framework.

Splitting dataset
In machine learning, choosing a data-splitting strategy is crucial for developing robust models. The 80:20 split is a widely adopted approach, as it strikes a balance between providing sufficient data for model training and reserving an ample portion for performance evaluation [21-23]. This ratio effectively addresses the trade-off between bias and variance, making it an effective choice across a wide range of machine-learning tasks [24,25].
Performance evaluation metrics
In this study classification indicators are accuracy, precision, F1 Score, Sensitivity, and Specificity Mathematically described as follows:
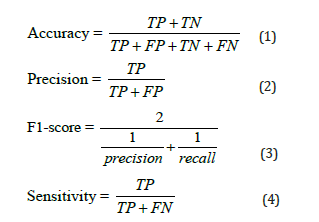
TP is the true positive case point, TN is the true negative case point, FP is the false positive case point and FN is the false negative case point (Figure 2).
Figure 2:Class distribution of target feature.

Results
The stacking outperforms all other models in terms of accuracy (85.48%), precision (85.28%), F1-score (85.24%), and sensitivity (85.35%), demonstrating strong overall performance, effectively balancing between avoiding false positives and identifying true positives (Table 1). AdaBoost performs well, with 82.25% accuracy and 82.57% precision, but falls short compared to DNM. DT model achieves moderate results, with 80.64% accuracy, showing reasonable balance between precision and recall. LR lags, with the lowest performance across all metrics, especially in accuracy (79.03%) and sensitivity (78.85%), making it the least suitable for this task. stacking is the most effective model, providing the best balance and performance for this classification problem (Figure 3).
Table 1:Model evaluations.

Figure 3:Confusion metrics comparison.

Stacking achieved the highest accuracy, precision, and recall, indicating that combining models via stacking effectively handles both positive and negative class predictions, outperforming the individual models in almost every metric. AdaBoost showed competitive performance, likely reducing FPs and FNs, but not as effective as the stacking model in achieving the best overall results. It demonstrates that boosting helped improve generalization. DT and LR models lagged in sensitivity, indicating that they may struggle with false negatives, which can be problematic for diagnosis. LR likely had difficulties handling complex relationships in the data, while DT might have overfit.
This ROC curve compares the performance of four models - Logistic Regression (LR), Decision Tree (DT), AdaBoost, and a Stacking Ensemble - using their AUC (Area Under the Curve) scores. The Stacking Ensemble model performs the best with an AUC of 0.97250, indicating superior ability to distinguish between classes, followed closely by AdaBoost (AUC = 0.96105) and Decision Tree (AUC = 0.95900). Though slightly behind, Logistic Regression still performs well with an AUC of 0.95050. Overall, the Stacking Ensemble offers the highest predictive accuracy, making it the strongest model compared to Figure 4.
Figure 4:Roc curve comparison.

Conclusion
This study explored the use of machine learning techniques to predict the grade of spondylolisthesis based on key anatomical features. By employing advanced computational models, including Logistic Regression (LR), Decision Tree (DT), AdaBoost, and a stacking ensemble model, we aimed to enhance the accuracy and reliability of spondylolisthesis diagnosis. Among the models tested, the stacking ensemble model emerged as the most effective, achieving the highest accuracy (85.48%), precision (85.28%), F1- score (85.24%), and sensitivity (85.35%). This model demonstrated a strong ability to balance between minimizing false positives and accurately identifying true positive cases. In conclusion, the stacking model outperformed the other models, providing the most balanced and robust predictions. This study underscores the potential of machine learning in clinical decision-making, particularly for spinal disorders like spondylolisthesis. By integrating anatomical and biomechanical data into predictive models, clinicians can achieve more accurate diagnoses and personalized treatment plans. Future research should explore further enhancements to the stacking model and investigate its application in other spinal disorders to generalize these findings.
References
- Hodges PW, Bailey JF, Fortin M, Battié MC (2021) Paraspinal muscle imaging measurements for common spinal disorders: review and consensus-based recommendations from the ISSLS degenerative spinal phenotypes group. European Spine Journal 30(12): 3428-3441.
- Noonan AM, Brown SH (2021) Paraspinal muscle pathophysiology associated with low back pain and spine degenerative disorders. JOR spine 4(3): e1171.
- Mac-Thiong JM, Labelle H (2023) Spondylolysis and spondylolisthesis, in textbook of musculoskeletal disorders, Springer, pp. 349-356.
- Mazurek M, Kulesza B, Golebiowska N, Tyzo B, Kura K, et al. (2023) Factors predisposing to the formation of degenerative spondylolisthesis - A narrative review. Medicina 59(8): 1430.
- Ricciardi L, Piazza A, Capobianco M, Della Pepa GM, Miscusi M, et al. (2023) Lumbar interbody fusion using oblique (OLIF) and lateral (LLIF) approaches for degenerative spine disorders: a meta-analysis of the comparative studies. European Journal of Orthopaedic Surgery & Traumatology 33(1): 1-7.
- Takeda K, Okada E, Shinozaki Y, Ozaki M, Kono H, et al. (2022) Risk factors for early-onset radiographical adjacent segment disease in patients with spondylolytic spondylolisthesis after single-level posterior lumbar interbody fusion. The Spine Journal 22(7): 1112-1118.
- Joost T, Engel T, Cassel M (2022) Detection and evaluation of predisposing factors for the presence of spondylolysis and spondylolisthesis in adolescent athletes–a systematic review. Sports Orthopaedics and Traumatology 38(3): 267-275.
- Mesregah MK, Yoshida B, Lashkari N, Abedi A, Meisel HJ, et al. (2022) Demographic, clinical, and operative risk factors associated with postoperative adjacent segment disease in patients undergoing lumbar spine fusions: a systematic review and meta-analysis. Spine Journal 22(6): 1038-1069.
- Hipp JA, Grieco TF, Newman P, Patel VV, Reitman CA, et al. (2022) Factors in measuring lumbar spondylolisthesis with reference data from NHANES II. Med Rxiv.
- Rangwalla K, Filley A, Naga AE, Gendelberg D, Baldwin A, et al., (2024) Degenerative lumbar spondylolisthesis: review of current classifications and proposal of a novel classification system. European Spine Journal 33(5): 1762-1772.
- Mohile NV, Kuczmarski AS, Lee D, Warburton C, Rakoczy K, et al. (2022) Spondylolysis and isthmic spondylolisthesis: a guide to diagnosis and management. The Journal of the American Board of Family Medicine 35(6): 1204-1216.
- Li N, Scofield J, Mangham P, Cooper J, Sherman W, et al. (2022) Spondylolisthesis. Orthopedic Reviews 14(4): 36917.
- Daher M, Rezk A, Baroudi M, Balmaceno-Criss M, Gregorczyk JG, et al. (2024) Lumbar spondylolisthesis grading: Current standards and important factors to consider for management. World Neurosurgery 190: 311-317.
- Yakdan S, Botterbush K, Xu Z, Lu C, Ray WZ, et al. (2023) Machine learning and lumbar spondylolisthesis. Seminars in Spine Surgery 35(3): 101048.
- Dong S, Zhu Y, Yang H, Tang N, Huang G, et al. (2022) Evaluation of the predictors for unfavorable clinical outcomes of degenerative lumbar spondylolisthesis after lumbar Interbody fusion using machine learning. Frontiers in Public Health 10: 835938.
- Aziz RR, Jarjees MS, Aziz MR, Hameed AA (2024) Machine learning techniques for spondylolisthesis diagnosis: A review. NTU Journal of Engineering and Technology 3(2).
- Zhang J, Lin H, Wang H, Xue M, Fang Y, et al. (2023) Deep learning system assisted detection and localization of lumbar spondylolisthesis. Frontiers in Bioengineering and Biotechnology 11: 1194009.
- Santilli, V., et al., The use of machine learning for inferencing the effectiveness of a rehabilitation program for orthopedic and neurological patients. International Journal of Environmental Research and Public Health, 2023. 20(8): p. 5575.
- Hassanzadeh R, Farhadian M, Rafieemehr H (2023) Hospital mortality prediction in traumatic injuries patients: comparing different SMOTE-based machine learning algorithms. BMC Medical Research Methodology 23(1): 101.
- Padash S, Mickley JP, Garcia DVV, Nugen F, Khosravi B, et al. (2023) An overview of machine learning in orthopedic surgery: an educational paper. The Journal of Arthroplasty 38(10): 1938-1942.
- Muraina I (2022) Ideal dataset splitting ratios in machine learning algorithms: general concerns for data scientists and data analysts. 7th international Mardin Artuklu Scientific Research Conference.
- Pham BT, Jaafari A, Avand M, Al-Ansari N, Du TD, et al. (2020) Performance evaluation of machine learning methods for forest fire modeling and prediction. Symmetry 12(6): 1022.
- Elmrabit N, Zhou F, Li F, Zhou H (2020) Evaluation of machine learning algorithms for anomaly detection. 2020 International Conference on Cyber Security And Protection Of Digital Services (Cyber Security). IEEE.
- Varoquaux G, Colliot O (2023) Evaluating machine learning models and their diagnostic value. Machine Learning for Brain Disorders, pp. 601-630.
- Moulaei K, Shanbehzadeh M, Taghiabad ZM, Arpanahi HK (2022) Comparing machine learning algorithms for predicting COVID-19 mortality. BMC Medical Informatics and Decision Making 22(1): 2.
© 2024 Umair Arif. This is an open access article distributed under the terms of the Creative Commons Attribution License , which permits unrestricted use, distribution, and build upon your work non-commercially.
Editor In Chief


.jpg)


Signup for Newsletter

Quick Links
 Editorial Board Registrations
 Submit your Article
 Refer a Friend
 Advertise With Us
Our Recent Edition

.jpg)


Top Editors


.jpg)


.bmp)
.jpg)
.png)
.jpg)


.jpg)


.png)

.png)


.png)


Financial Support

Sponsors

Latest e-Books

Latest Video

 a Creative Commons Attribution 4.0 International License. Based on a work at www.crimsonpublishers.com.
Best viewed in
a Creative Commons Attribution 4.0 International License. Based on a work at www.crimsonpublishers.com.
Best viewed in