- Submissions

Full Text
Open Journal of Cardiology & Heart Diseases
Significance of Left Ventricular Strain in Traditional Cardiac Risk Factor Population
Akhil Mehrotra1*, Mohammad Shaban2, Faiz Illahi siddiqui2, Shubham Kacker2, Mohammad Shadab2 and Naveen Chandra3
1Chief, Pediatric, and Adult Cardiology, Prakash Heart Station, India
2Cardiac Technician, Prakash Heart Station, India
3Senior Interventional Cardiologist, India
*Corresponding author: Akhil Mehrotra, Chief, Non-Invasive Cardiologist, Pediatric and Adult Cardiology, Prakash Heart Station, India
Submission: August 22, 2025;Published: September 15, 2025

ISSN 2578-0204Volume5 Issue 1
Abstract
Background: 4-Dimensional XStrain speckle tracking echocardiography (4DXStrainSTE) is an advanced
cardiac imaging technique that synthesizes Speckle Tracking Echocardiography (STE) data obtained
from the apical Three-Chamber (3CH), Four-Chamber (4CH), and Two-Chamber (2CH) views, thereby
enabling a comprehensive evaluation of Multiple Left Ventricular Strain Parameters (MLVSP) within a
three-dimensional framework.
Methods: This study aimed to evaluate the impact of Cardiovascular Risk Factors (CVRFs) on MLVSP
using 4DXStrainSTE. Nine strain parameters were analyzed: Global Circumferential Strain (GCS), Global
Circumferential Strain Rate (GCSR), Global Radial Strain (GRS), and Global Radial Strain Rate (GRSR) at the
Mitral Valve (mv) and papillary muscle (pap) levels, along with Global Longitudinal Strain (GLS). A total of
500 Indian adults (aged 18-60 years; both sexes) were enrolled. Participants were categorized into four
CVRF Risk Categories (1, 2, 3, and 4) according to the cumulative number of risk factors. The inclusion
criterion was a 4-dimensional left ventricular ejection fraction (4D-LVEF) > 50%.
Result: The effect of CVRF on strain parameters was determined using trend and linearity analyses. Trend
analysis across CVRF categories revealed a significant decline in GLS, GCS at the pap level, and GCSR at
the mv level. Pearson’s correlation demonstrated mild-to-moderate linear associations across MLVSP, and
multivariate regression analysis identified significant associations of GLS and GCSR at the mv level with
GLS across the risk categories.
Conclusion: To the best of our knowledge, this is the first study to provide a comprehensive evaluation of
the impact of CVRFs on MLVSP in individuals with preserved ejection fraction.
Keywords:4DXStrain; Speckle tracking echocardiography; 4D-LVEF%; Cardiovascular risk factors; Trend analysis
Introduction to TTR Amyloidosis
Currently, Global Longitudinal Strain (GLS) assessment via two-dimensional Speckle Tracking Echocardiography (2D STE) remains one of the most extensively investigated techniques worldwide [1]. The American Society of Echocardiography recommends a normal GLS value of > -20±2% [2]. Three-dimensional Speckle Tracking Echocardiography (3D STE) enables single-apical acquisition of the left ventricle, thereby reducing acquisition time and allowing a comprehensive evaluation of strain parameters [3]. However, its clinical application is constrained by suboptimal temporal and spatial resolution, which can impair tracking accuracy. In addition, multi-beat acquisitions may introduce stitching artifacts between subvolumes, further compromising speckle tracking analysis [4,5]. 4DXStrainSTE is an innovative and advanced imaging modality that integrates Tomtec GMBH’s 3D/4D imaging platform with Beutel™ computational technology [6]. It synthesizes STE data from apical 3CH, 4CH, and 2CH views to achieve a comprehensive three-dimensional reconstruction of Left Ventricular (LV) strain parameters. By capitalizing on the superior temporal and spatial resolution of 2D imaging, this technique effectively mitigates the inherent limitations of full-volume 3D STE [7]. While single-plane 3D echocardiography still suffers from lower resolution compared to 2D imaging [8], 4DXStrainSTE overcomes these constraints and offers an accessible, cost-efficient, and userfriendly solution for LV strain analysis.
Previous studies have documented the impact of Cardiovascular Risk Factors (CVRFs) on GLS [9,10], though primarily using 2D STE. A thorough literature search revealed no prior studies that comprehensively evaluated the influence of CVRFs on Multiple LV Strain Parameters (MLVSP) through rigorous statistical techniquesnamely, trend analysis, Pearson’s correlation, and multivariate regression for linearity assessment. This investigation was therefore designed to address this important methodological gap.
Method
Study center
This original research was conducted over a 28-month period (September 2021 to December 2023) at Prakash Heart Station, Lucknow, Uttar Pradesh, India.
Ethical approval
Ethical approval was granted by the Institutional Ethics Committee of Prakash Heart Station (Approval No. IEC/PDC/ PHSD/2021:01,02). All participants provided written informed consent after receiving a detailed explanation of the study’s aims. The research procedures were carried out in alignment with the International Conference on Harmonisation-Good Clinical Practice (ICH-GCP) standards and adhered to the ethical principles set forth in the Declaration of Helsinki.
Study population
This was a single-center, observational, prospective study involving 500 Indian adults aged 18-60 years, of both sexes. Participants were classified into four CVRFs categories: category 1, 2, 3, and 4 (Figure 1).
Figure 1:Classification steps of the study design.
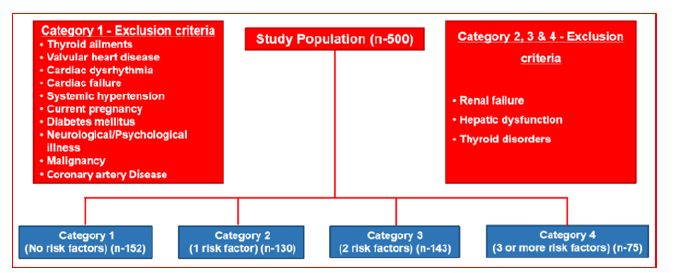
Category 1: This group included 152 healthy individuals (aged 18-60 years; both sexes) without any CVRFs, exhibiting normal resting Electrocardiograms (ECG), 4DXStrainSTE findings with 4D-LVEF>50%, and negative Treadmill Stress Tests (TST).
Category 2, 3 & 4: This cohort comprised 348 adults (aged 18-60 years; both sexes) with one or more CVRFs, all in sinus rhythm and exhibiting a 4D-LVEF > 50%. Inclusion criteria stipulated that all participants maintain a 4D-LVEF≥50%, as quantified by 4DXStrainSTE. Comprehensive clinical and medical assessments were conducted by a cardiac physician, with meticulous documentation of the CVRF profile for each participant. Cardiovascular Risk Factors
A. Cardiovascular disease:
I. CAD: history of myocardial infarction, stable/unstable
angina, acute coronary syndrome, or Percutaneous Coronary
Intervention (PCI)
II. CVA (Cerebrovascular Accident)
III. PAD (Peripheral Arterial Disease)
B. Diabetes mellitus
C. Hypertension
D. Dyslipidemia
E. Obesity
F. Smoking
Definitions of all risk factors adhered to current guidelines [11- 15].
Echocardiography
All participants underwent comprehensive cardiac evaluation using conventional Two-Dimensional (2D) transthoracic echocardiography and 4DXStrainSTE. Examinations were conducted on the MY LAB X7 4D XStrain system (ESAOTE, Italy) equipped with a 1-5MHz transducer. All acquisitions were performed by the experienced study authors, with measurements obtained in accordance with the American Society of Echocardiography guidelines [16].
Conventional echocardiography
Two-dimensional, M-mode, Pulse-Wave Doppler (PWD), Continuous-Wave Doppler (CWD), and tissue Doppler Imaging (TDI) modalities were employed to evaluate standard cardiac parameters, including Left Ventricular (LV) volumes, systolic and diastolic function, LV mass, Left Ventricular Ejection Fraction (LVEF%), Cardiac Output (CO), Cardiac Index (CI), Early Diastolic (E) and Late Diastolic (A) velocities, E/A ratio, early myocardial relaxation velocity (E′), and the E/E′ ratio.
4-Dimensional x-strain echocardiography
Figure 2:Illustration of 4DXStrain speckle tracking echocardiography. GLS, Global Longitudinal Strain; GCS, Global Circumferential Strain; GRS, Global Radial Strain; GCSR, Global Circumferential Strain Rate; GRSR, Global Radial Strain Rate.
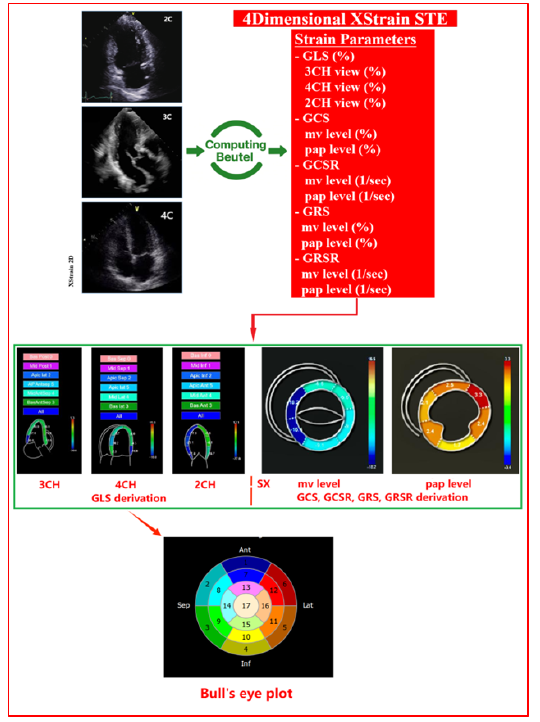
Image acquisition: Apical 4CH, 3CH, 2CH, and Short-Axis (SX) views at the Mitral Valve (mv) and Papillary Muscle (pap) levels were obtained (Figure 2). Each cine loop comprised at least three cardiac cycles, recorded at 40-75 Frames Per Second (FPS) and stored digitally for offline analysis. High-quality image acquisition was prioritized. Optimal ECG tracing was ensured by adjusting electrode placement on the chest and selecting the lead from the PHYSIO menu of the echocardiography system that yielded the smoothest waveform with well-defined R/Q waves and minimal noise. Traces exhibiting prominent P or T waves were avoided to prevent gating interference during 4DXStrainSTE acquisition. Participants were instructed to hold their breath at end-expiration to minimize translational and respiratory artifacts. The LV was positioned to fill the majority of the imaging sector, avoiding foreshortening. Particular care was taken to exclude papillary muscle bulges when tracing the endocardium. High-quality short-axis views at the mv, pap, and LV apex levels were acquired to facilitate accurate computation of circumferential strain, circumferential strain rate, radial strain, and radial strain rate [17]. Clear delineation of cardiac borders was confirmed throughout the cardiac cycle.
Offline analysis of acquired images: Speckle tracking analysis was performed offline using XStrain-4D™ (Esaote) software [18]. The LV endocardial and epicardial borders were automatically delineated from 13 equidistant tracking points, supported by the Aided Heart Segmentation (AHS) tool [18]. The Beutel computational platform, integrated into XStrain™ 4D, synthesizes STE data from apical 2D 3CH, 4CH, and 2CH views to reconstruct a 3D/4D LV model, enabling automated derivation of LV strain parameters [18]. A standardized 17-segment Bull’s-eye plot was generated for visualization.
Strain parameters derived from xstrain 4DSTE
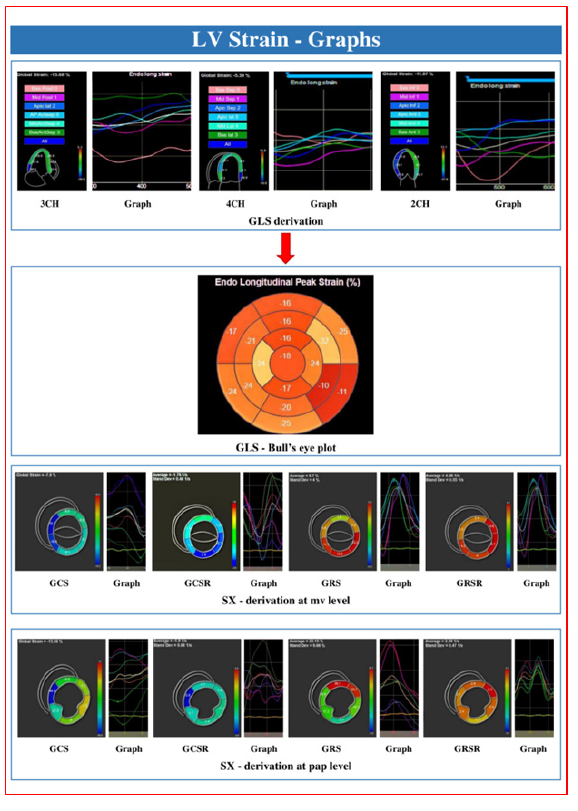
Nine strain parameters (Figure 3) were evaluated as outlined below:
Figure 3:Graphical representation of the nine LV strain parameters.
1. GLS (%)
a. 3CH view (%)
b. 4CH view (%)
c. 2CH view (%)
2. GCS
a. mv level (%)
b. pap level (%)
3. GCSR
a. mv level (1/sec)
b. pap level (1/sec)
4. GRS
a. mv level (%)
b. pap level (%)
5. GRSR
a. mv level (1/sec)
b. pap level (1/sec)
GLS and GCS are expressed as negative values, whereas GRS is represented as positive values. Similarly, strain and strain rate are denoted in % and 1/sec, respectively (Figures 2&3).
Statistical Analysis
Study subjects were categorized as follows:
a) Category 1: Healthy individuals without CVRFs (Healthy
group)
b) Category 2: Individuals with only one CVRF
c) Category 3: Individuals with two CVRFs
d) Category 4: Individuals with three or more CVRFs
NB: The data of categories 2, 3, & 4 were pooled together for statistical analysis in Table 1 (Pooled group).
Statistical analyses were conducted using IBM SPSS
Statistics, Version 26.0 (IBM Corp., Armonk, NY, USA). Graphical
representations for trend analysis were created using Microsoft
Excel 2013 (Version 15.0.558.1000; MSO 15.0.5589; 32-bit),
included in Microsoft Office Professional Plus 2013.
a) The Shapiro-Wilk test was conducted to assess the
normality of distribution for continuous variables.
b) Variables with normal distributions were expressed as
mean ± standard deviation. The Student’s t-test was applied
to normally distributed data to determine the significance
of differences between groups and risk categories (95%
confidence intervals). Multiple independent t-tests comparing
Risk Category 1 with Categories 2, 3, and 4 across various
variables were conducted.
c) For data that were not normally distributed, the Mann-
Whitney U test was employed.
d) Levene’s test was applied to assess the homogeneity of
variances.
e) The Tukey-Kramer post hoc analysis was used to evaluate
differences between parameters across CVRF risk categories.
f) The Kruskal-Wallis test was utilized for data exhibiting
unequal variances between groups.
g) Pearson’s correlation coefficient was calculated to
measure the linear correlation between two data sets.
h) Trend & Multivariate regression analysis was performed
across Risk Categories 1-4.
i) Continuous variables are expressed as mean ± standard
deviation, whereas categorical variables are presented as
frequencies and percentages (Table 1).
Statistical significance was defined as p<0.05, with p<0.01 considered highly significant. Values with p>0.05 were deemed not significant.
Result
Demographic data
In Category 1 (Table 1), 152 healthy individuals were enrolled (103 males, 49 females). The mean age was 29.5±10.24 years for males and 34.16±9.95 years for females, with females being significantly older than males (p<0.01). Males exhibited significantly greater weight, height, BMI, Blood Pressure (BP), and Heart Rate (HR) compared to females (p<0.01). In the pooled data, there were 348 participants (204 males, 144 females). The mean age of males was 49.85 ± 12.73 years, and that of females was 54.92±12.58 years. Males had significantly higher weight, height, BMI, and Diastolic BP (DBP) than females (p<0.01), whereas Systolic BP (SBP) and HR were significantly higher in females (p<0.01).
Conventional echocardiography data
Routine two-dimensional echocardiography was employed to obtain conventional measurements.
In male subjects of Category 1 (Table 1), left atrial size, Interventricular Septal Diameter (IVS d), Left Ventricular Internal Diameter In Diastole (LVID d), Left Ventricular Posterior Wall Diameter (LVPW d), Left Ventricular End-Diastolic Volume (LVEDV), LV mass in diastole (LV Mass d), Cardiac Output (CO), mitral E/A ratio, Lateral Wall Tissue Doppler Imaging (TDI) E′ velocity, and 2D Fractional Shortening (FS) were significantly greater than in females (p<0.01). Conversely, E-Point Septal Separation (EPSS), lateral wall TDI E/E′ ratio, and 2D Left Ventricular Ejection Fraction (2D-LVEF) were greater in females (p<0.01, p>0.05, and p<0.05, respectively). Pooled data values for EPSS, IVSd, LVID d, LVPW d, LVEDV, LV Mass d, CO, TDI E′, and TDI E/E′ ratio were significantly higher in males (p<0.01, p<0.05). In contrast, left atrial size, mitral E/A ratio, 2D-LVEF, and 2D-FS were significantly higher in females (p<0.01).
4-Dimensional XStrain Speckle Tracking Data
LV strain data: A comparative analysis of LV strain parameters between category 1 and the pooled category (Table 1) revealed a significant reduction in GLS and GCS at the pap level in the pooled category (p<0.001 and p=0.01, respectively), although GCSR at the pap level showed borderline significance (p=0.06). Nevertheless, GCS at the mv level, global GRS at both mitral and papillary levels, and GCSR at the mv level were also lower in the pooled category; however, these differences did not reach statistical significance (p>0.05). Meanwhile, GRSR at both the mitral and papillary levels was marginally higher in the pooled category, though this increase was not statistically significant (p>0.05) (Table 1).
Table 1:Demographic, conventional echocardiography & strain data.
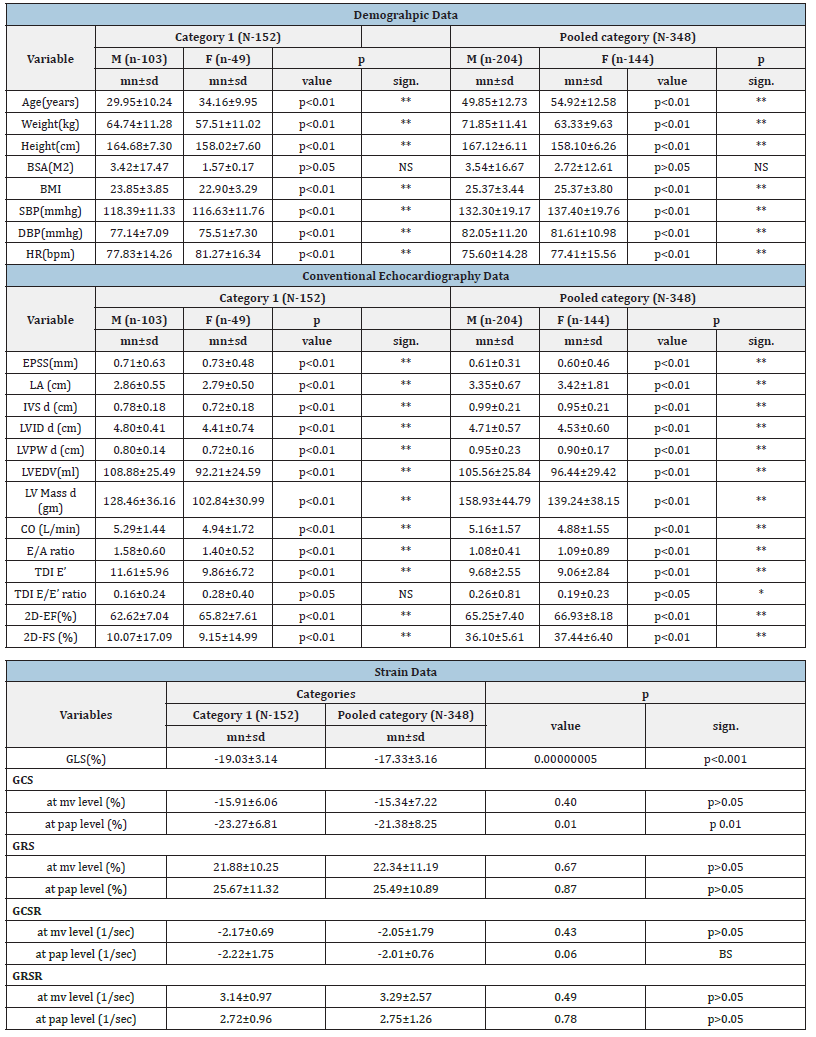
Sd: Standard deviation; sign: Significance; M: Male; F: Female; mn: Mean; HR: Heart rate; n: Number; SBP: Systolic BP; DBP: Diastolic BP; EPSS: E point septal separation; CO: Cardiac output; 2D: Two dimensional; EF: Ejection fractional; FS: Fractional shortening; sign: Significance; *: Significant; ** : Highly significant; NS: Not significant; mn: Mean; sd: Standard deviation; sign: Significance; GLS: Global longitudinal strain; GCS: Global circumferential strain; GRS: Global radial strain; GCSR: Global circumferential strain rate; GRSR: Global radial strain rate; mv: Mitral valve; pap: Papillary muscle; BS: Borderline significant.
Trend analysis of multiple left ventricular strain parameters
Trend analysis of MLVSP across ascending CVRF categories (Table 2, Figure 4) demonstrated a strong and statistically significant downward trajectory in GLS and GCS at the pap level (p<0.01), indicating progressive deterioration in myocardial deformation with increasing cardiovascular risk. GCSR at the mv level also exhibited a mild yet statistically significant decline (p<0.05), whereas GCSR at the papillary level showed borderline significance (p=0.09). Other parameters, including radial strain and their respective strain rates, did not display significant trends (p>0.05), suggesting relative preservation of these strain dimensions across risk categories (Table 2, Figure 4).
Figure 4:Graphical illustration of the trend analysis of MLVSP across cardiovascular risk categories 1-4, highlighting the progressive decline in GLS and GCS at pap level with increasing risk burden.
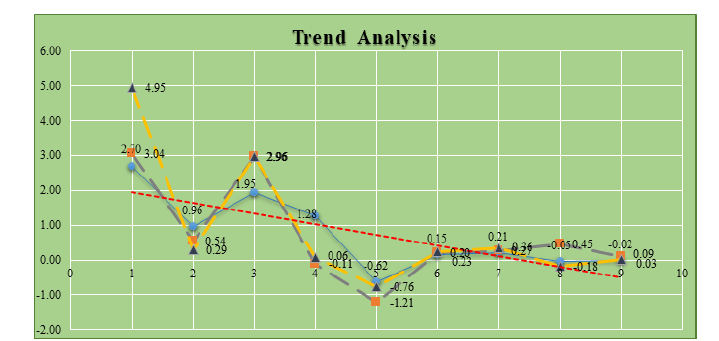
Table 2:Trend of LV strain parameters in cardiovascular risk factor categories.
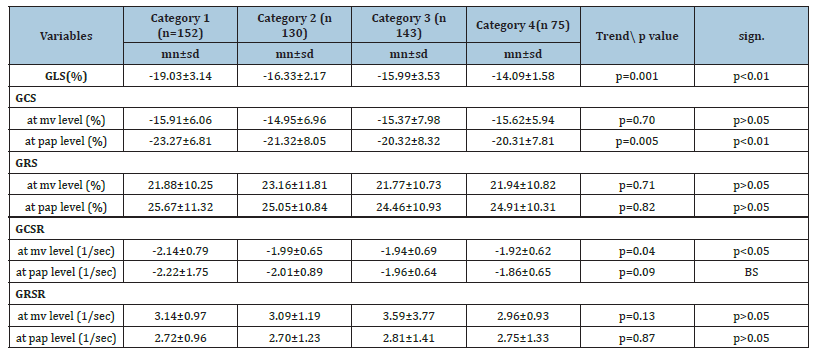
Sd: Standard deviation; sign: Significance; BS: Borderline significance; GLS: Global longitudinal strain; GCS: Global circumferential strain; GRS: Global radial strain; GCSR: Global circumferential strain rate; GRSR: global radial strain rate; mv: Mitral valve; pap: Papillary muscle.
Pearson’s correlation (Bivariate Analysis)
Pearson’s correlation analysis revealed predominantly weak
to moderate linear relationships among the strain parameters,
suggesting generally mild associations (Table 3, Figure 5):
A. Moderate negative correlations were observed between:
a) GCS and GRS at the mv level (r = -0.463)
b) GCS and GRS at the pap level (r = -0.528)
These findings suggest a notable inverse relationship; wherein
increased GCS may correspond with reduced GRS at the respective
anatomical levels.
B. Most of the remaining correlations were weakly positive
or weakly negative, indicating limited linear dependency
among the majority of strain parameters.
Despite the small effect sizes, several of these correlations were statistically significant, as supported by corresponding p-values (Table 3, Figure 5).
Figure 5:Pearson’s correlation: (A), No correlation; (B), Weak Positive; (C), Moderate Negative; (D), Weak Negative.
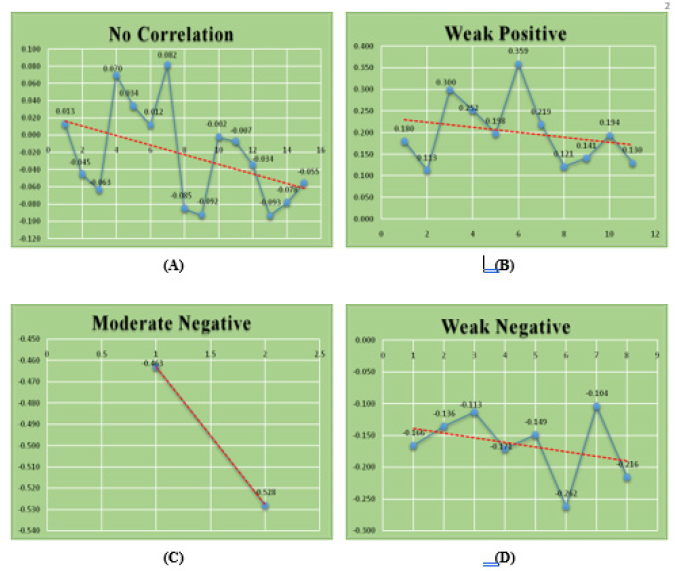
Table 3:Pearson’s correlation coefficient (Bivariate analysis).
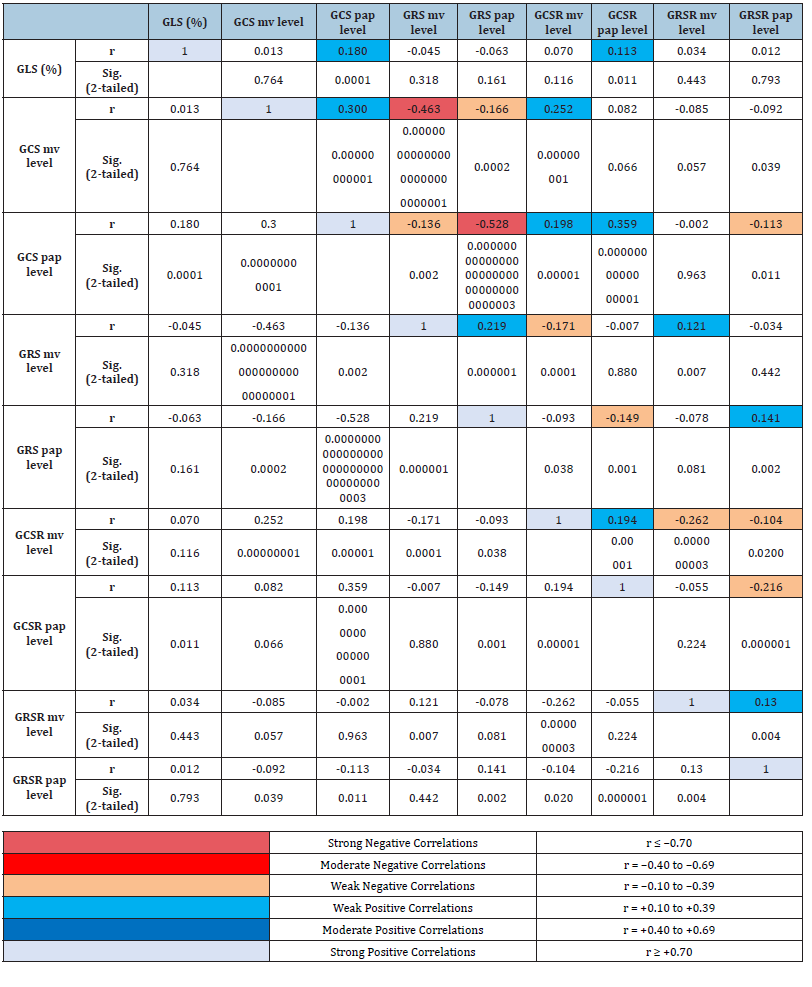
GLS: Global longitudinal strain; GCS: Global circumferential strain; GRS: Global radial strain; GCSR: Global circumferential strain rate; GRSR: Global radial strain rate; mv: Mitral valve; pap: Papillary muscle; sig: Significance
Multivariate regression analysis
On multivariate regression analysis, the following significant
associations were identified (Table 4, Figure 6):
a) Risk Category 3 - GLS (β = -0.164, p = 0.043),
b) Risk Category 2 - GCSR at mv level (β = -0.174, p = 0.032),
and
c) Risk Category 4 - GCSR at mv level (β = -0.188, p = 0.021),
all demonstrated statistically significant associations with Risk
Category 1 - GLS.
Other LV strain parameters did not exhibit any independent significant associations (Table 4, Figure 6).
Figure 6:Graphical Illustration of multivariate regression analysis of MLVSP across risk categories.
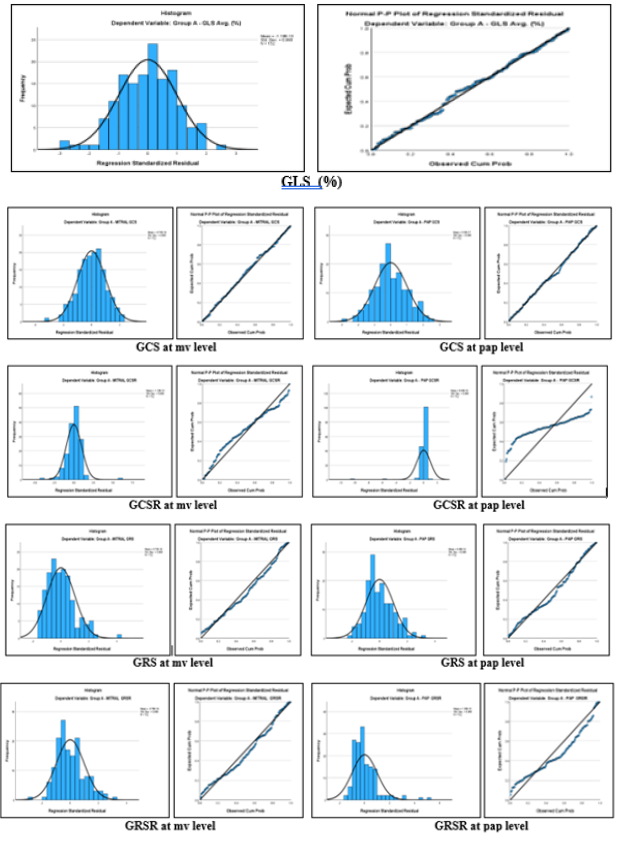
Table 4:Multivariate regression analysis.
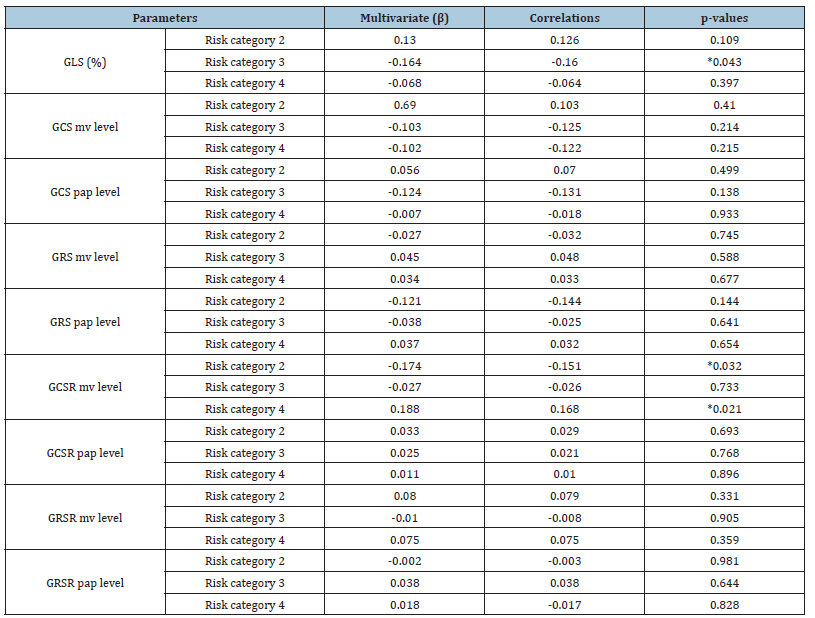
GLS: Global longitudinal strain; GCS: Global circumferential strain; GRS: Global radial strain; GCSR: Global circumferential strain rate; GRSR: Global radial strain rate; mv: Mitral valve; pap: Papillary muscle; *: p<0.05.
Discussion
Two-dimensional Speckle Tracking Echocardiography (2D STE) remains a widely employed, non-invasive modality for evaluating Left Ventricular (LV) systolic function, as well as strain, volumetric indices, and rotational mechanics-including twist, torsion, and rotation [17,18]. However, inherent limitations persist across 2D, 3D, and 4D STE platforms [17]. The most recent innovation, XStrain™ 4D, was developed to improve the precision of LV contractile function assessment [17], although its adoption in routine clinical practice remains limited.
4Dimensional/3dimensional versus 2dimensional speckle tracking echocardiography
Prior studies have demonstrated that Real-Time Three- Dimensional Echocardiography (RT3DE) and Four-Dimensional STE (4D STE) offer superior accuracy in quantifying LV Ejection Fraction (LVEF) and strain parameters compared to conventional 2D echocardiography [19-21]. This advantage largely stems from the geometric assumptions inherent to 2D-derived LVEF calculations [22]. Indeed, several reports have shown that LVEF and LV volumes measured by 2D imaging tend to be overestimated relative to RT3DE or 4D modalities [23,24]. In the present study, we employed 4DXStrainSTE to perform LVEF and volumetric assessments within a true 3D/4D analytical framework. Earlier work by Takahashi et al. [9] and the STAAB cohort [25] examined the influence of CVRFs on LV strain using 2D echocardiographic platforms. However, 2D-based methods may compromise strain accuracy due to spatial and geometric limitations. In contrast, our study leveraged 4DXStrainSTE-a technologically advanced and potentially more precise modality [7, 26].
Clinical significance of cardiovascular risk factors on LV strain
GLS has emerged as a sensitive and prognostically valuable marker of adverse cardiovascular outcomes, often surpassing GCS and GRS in predictive capacity. This superiority likely reflects the vulnerability of subendocardial, longitudinally oriented myocardial fibers to early pathological insults during the initial stages of myocardial dysfunction [27,28]. Conversely, circumferential strain-reflecting mid-wall circumferential fibers-typically remains preserved until later disease stages [29]. Radial strain, representing myocardial wall thickening in the radial dimension, is comparatively less sensitive to early changes [30]. Strain rate parameters provide complementary insights into the velocity of myocardial deformation, thereby refining the characterization of contraction and relaxation kinetics. CVRFs are highly prevalent among older adults and, if unaddressed, predispose individuals to overt Cardiovascular Disease (CVD) [31]. The cumulative presence of multiple CVRFs has been implicated in the development of subclinical myocardial dysfunction [32]. Importantly, impaired GLS has been reported even in individuals with preserved LVEF, underscoring its value as an early marker of myocardial impairment [33]. Moreover, multiple studies have linked an increasing burden of CVRFs with stepwise elevations in cardiovascular mortality risk [34,35].
Although prior investigations have explored the relationship between CVRFs and strain-primarily GLS-using 2D STE [9, 25], our study, employing 4DXStrainSTE, detected significantly lower GLS and GCS at the papillary level in pooled CVRF categories compared with the low-risk group (p < 0.01). While reductions in GCS at the mitral level, GRS at both mitral and papillary levels, and GRSR were also observed in the CVRF group, these differences did not achieve statistical significance (p > 0.05). Furthermore, trend analysis and linearity testing via Pearson’s correlation and multivariate regression demonstrated a significant, progressive decline in GLS and GCS at the papillary level across ascending CVRF categories, consistent with worsening myocardial deformation. GCSR at the papillary level showed borderline significance (p=0.09). Pearson’s bivariate correlation revealed predominantly mild linear associations among strain indices, while multivariate regression identified significant associations between GLS and GCSR at the mitral level with GLS. GLS remains the most widely adopted strain parameter in both clinical and research settings [36]. However, there is a notable paucity of studies systematically evaluating the impact of CVRFs on GCS and GRS. To our knowledge, this is the first study to comprehensively examine the clinical implications of CVRFs on GCS, GRS, GCSR, and GRSR using an advanced 4DXStrainSTE platform.
Conclusion
This study provides comprehensive normative data on LV strain parameters in healthy Indian adults and individuals with CVRFs, assessed using advanced 4DXStrainSTE. The presence of CVRFs was significantly associated with reduced GLS and GCS at the papillary level (p<0.01), while GCSR at the papillary level showed a borderline reduction (p=0.06). In contrast, GRSR values were marginally higher but not statistically significant (p>0.05).
A robust statistical approach-including trend analysis, Pearson’s correlation, and multivariate regression-demonstrated that ascending CVRF categories were associated with a significant stepwise decline in GLS and GCS at the papillary level (p<0.01), GCSR at the mitral level (p<0.05), and borderline significance for GCSR at the papillary level (p=0.09), indicating progressive myocardial dysfunction. Other parameters showed non-significant or inconsistent patterns (p>0.05). Pearson’s correlation revealed predominantly mild linear associations among strain parameters, while multivariate regression identified significant associations of GLS and GCSR at the mitral level with GLS. To the best of our knowledge, this is the first single-center investigation to comprehensively evaluate MLVSP in the context of CVRFs using 4DXStrainSTE. The results highlight distinct differences in LV strain profiles between CVRF-affected individuals and healthy controls, supporting the clinical utility of XStrain™ 4D STE as a cost-effective and sensitive tool for detailed ventricular mechanics assessment, particularly for GLS and related strain parameters.
Limitations of the Present Research
a. This was a single-center study conducted on healthy
Indian adults. Therefore, the reference values generated
cannot be extrapolated to other ethnic groups such as Africans,
Europeans, or Americans.
b. The specific ultrasound system used plays a significant
role in strain evaluation, and values may differ when using
other echocardiographic platforms due to software algorithm
variability [37].
c. A major limitation lies in the lack of standardization of GLS
values across vendors, which can affect strain measurements
[38,39].
d. The study did not incorporate validation against Cardiac
Magnetic Resonance Tagging (CMR-TAG) or Feature Tracking
(CMR-FT) [40], which remain the gold standards for strain
analysis.
References
- Yingchoncharoen T, Agarwal S, Popovic ZB (2013) Normal ranges of left ventricular strain: A meta-analysis. J Am Soc Echocardiogr 26(2):185-191.
- Lang RM, Badano LP, Mor-Avi V, Afilalo J, Armstrong A, et al. (2015) Recommendations for cardiac chamber quantification by echocardiography in adults: An update from the American society of echocardiography and the European association of cardiovascular imaging. J Am Soc Echocardiogr 28(1):1-39.
- Jasaityte R, Heyde B, D'Hooge J (2013) Current state of three-dimensional myocardial strain estimation using echocardiography. J Am Soc Echocardiogr 26(1):15-28.
- Papademetris X, Sinusas AJ, Dione DP, Duncan JS (2001) Estimation of 3D left ventricular deformation from echocardiography. Med Image Anal 5(1): 17-28.
- Elen A, Choi HF, Loeckx D, Gao H, Claus P, et al. (2008) Three-dimensional cardiac strain estimation using spatio-temporal elastic registration of ultrasound images: A feasibility study. IEEE Trans Med Imaging 27(11):1580-1591.
- Muraru D, Niero A, Zanella HR, Cherata D, Badano LP (2018) Three-dimensional speckle-tracking Echocardiography: Benefits and limitations of integrating myocardial mechanics with three-dimensional imaging. Cardiovasc Diagn Ther 8(1): 101-117.
- Takahashi K, Naami GA, Thompson R, Inage A, Mackie AS, et al. (2010) Normal rotational, torsion and untwisting data in children, adoledcents and young adults. J Am Soc Echocardiogr 23(3):286-293.
- Muraru D, Cucchini U, Mihăilă S, Miglioranza MH, Aruta P, et al. (2014) Left ventricular myocardial strain by three-dimensional speckle-tracking echocardiography in healthy subjects: Reference values and analysis of their physiologic and technical determinants. J Am Soc Echocardiogr 27(8): 858-871.
- Takahashi T, Kusunose K, Zheng R, Yamaguchi N, Hirata Y, et al. (2022) Association between cardiovascular risk factors and left ventricular strain distribution in patients without previous cardiovascular disease. J Echocardiogr 20(4): 208-215.
- Al Saikhan L, Park C, Hardy R, Hughes A (2018) Prognostic implications of left ventricular strain by speckle-tracking echocardiography in population-based studies: A systematic review protocol of the published literature. BMJ Open 8(7): e023346.
- Unger T, Borghi C, Charchar F, Khan NA, Poulter NR, et al. (2020) International society of hypertension global hypertension practice guidelines. Hypertension 75(6): 1334-1357.
- National Cholesterol Education Program (NCEP) Expert Panel on Detection, Evaluation, and Treatment of High Blood Cholesterol in Adults (Adult Treatment Panel III) (2002) Third Report of the National Cholesterol Education Program (NCEP) expert panel on detection, evaluation, and treatment of high blood cholesterol in adults (Adult Treatment Pane III) final report. Circulation 106(25): 3143-3421.
- WHO Expert Consultation (2004) Appropriate body-mass index for Asian populations and its implications for policy and intervention strategies. Lancet 363(9403): 157-163.
- American Diabetes Association (2020) Classification and diagnosis of diabetes: Standards of medical care in diabetes-2020. Diabetes Care 43(Suppl 1): S14-S31.
- Marston L, Carpenter JR, Walters KR, Morris RW, Nazareth I, et al. (2014) Smoker, ex-smoker or non-smoker? The validity of routinely recorded smoking status in UK primary care: A cross-sectional study. BMJ Open 4(4): e004958.
- Mitchell C, Rahko PS, Blauwet LA, Canaday B, Finstuen JA, et al. (2019) Guidelines for performing a comprehensive transthoracic echocardiographic examination in adults: Recommendations from the American society of echocardiography. J Am Soc Echocardiogr 32(1): 1-64.
- Mehrotra A, Mehrotra A, Shaban M, Kacker S (2024) Four-dimensional XStrain echocardiographic assessment of left ventricular strain and rotational mechanics: Technology, clinical applications, advantages and limitations. CVIA 9: 1-17.
- Mehrotra A, Kacker S, Shadab M, Chandra N, Singh AK (2022) 4 Dimensional XStrain speckle tracking echocardiography: Comprehensive evaluation of left ventricular strain and twist parameters in healthy Indian adults during COVID-19 pandemic. American Journal of Cardiovascular Disease 12(4): 192-204.
- Chen R, Wu X, Shen LJ, Wang B, Ma MM, et al. (2014) Left ventricular myocardial function in hemodialysis and nondialysis uremia patients: A three-dimensional speckle-tracking echocardiography study. PLoS One 9(6): e100265.
- Zhu M, Streiff C, Panosian J, Zhang Z, Song X, et al. (2015) Regional strain determination and myocardial infarction detection by three-dimensional echocardiography with varied temporal resolution. Echocardiography 32(2): 339-348.
- Jenkins C, Bricknell K, Hanekom L, Marwick TH (2004) Reproducibility and accuracy of echocardiographic measurements of left ventricular parameters using real-time three-dimensional echocardiography. J Am Coll Cardiol 44(4): 878-886.
- Chen R, Zhu M, Sahn DJ, Ashraf M (2016) Non-invasive evaluation of heart function with four-dimensional echocardiography. Plos One 11(5): e0154996.
- Patted SV, Ambar S, Porwal SC, Halkati PC, Prasad MR, et al. (2018) Comparison of left ventricular volume and left ventricular ejection fraction by 2-dimensional echocardiography by Simpson's method & real time 3-dimensional echocardiography in patients of normal conduction with normal left ventricular function, complete left bundle branch block with normal left ventricular function and with left ventricular dysfunction. Journal of Indian College of Cardiology 8(4): 167-171.
- Al-Allak HMA, Al-Aboodi AHN (2023) A four-dimensional volumetric quantification of the left ventricle in healthy pregnant women in the third trimester. Cureus 15(10): e46342.
- Morbach C, Walter BN, Breunig M, Liu D, Tiffe T, et al. (2019) Speckle tracking derived reference values of myocardial deformation and impact of cardiovascular risk factors-Results from the population-based STAAB cohort study. PLoS One 14(8): e0221888.
- Van mil AC, Pearson J, Drane AL, Cockcroft JR, McDonnell B, et al. (2016) Interaction between left ventricular twist mechanics and arterial haemodynamics during localised, non-metabolic hyperaemia with and without blood flow restriction. Exp Physiol 101(4): 509-520.
- Delgado V, Tops LF, Bommel RJV, Kley FVD, Marsan NA, et al. (2009) Strain analysis in patients with severe aortic stenosis and preserved left ventricular ejection fraction undergoing surgical valve replacement. Eur Heart J 30(24): 3037-3047.
- Lindqvist P, Bajraktari G, Molle R, Palmerini E, Holmgren A, et al. (2010) Valve replacement for aortic stenosis normalizes subendocardial function in patients with normal ejection fraction. Eur J Echocardiogr 11(7): 608-613.
- Greenbaum RA, Ho SY, Gibson DG, Becker AE, Anderson RH (1981) Left ventricular fibre architecture in man. Br Heart J 45: 248-263.
- Rahaman SKA, Nath RK, Kumawat A, Madhukar B (2024) A comparative study of detection of alteration of left ventricular strain by speckle tracking echocardiography in adult patients with rheumatic mitral stenosis. European Journal of Cardiovascular Medicine 14(6): 307-313.
- Matsuoka M, Inoue T, Shinjo T, Miiji A, Tamashiro M, et al. (2020) Cardiovascular risk profile and frailty in Japanese outpatients: The nambu cohort study. Hypertens Res 43(8): 817-823.
- Lloyd-Jones DM, Braun LT, Ndumele CE, Smith Jr SC, Sperling LS, et al. (2019) Use of risk assessment tools to guide decision-making in the primary prevention of atherosclerotic cardiovascular disease: A special report from the American Heart Association and American College of Cardiology. J Am Coll Cardiol 73(24): 3153-3167.
- Edvardsen T, Helle-Valle T, Smiseth OA (2006) Systolic dysfunction in heart failure with normal ejection fraction: Speckle-tracking echocardiography. Progress in Cardiovascular Diseases 49(3): 207-214.
- Li D, Jia Y, Yu J, Liu Y, Li F, et al. (2021) Adherence to a healthy lifestyle and the risk of all-cause mortality and cardiovascular events in individuals with diabetes: The ARIC study. Front Nutr 8: 698608.
- Barr EL, Zimmet PZ, Welborn TA, Jolley D, Magliano DJ, et al. (2007) Risk of cardiovascular and all-cause mortality in individuals with diabetes mellitus, impaired fasting glucose, and impaired glucose tolerance: The Australian Diabetes, Obesity, and Lifestyle Study (AusDiab). Circulation 116(2): 151-157.
- Zhang K, Sheu R, Zimmerman NM, Alfirevic A, Sale S, et al. (2019) A Comparison of global longitudinal, circumferential, and radial strain to predict outcomes after cardiac surgery. J Cardiothorac Vasc Anesth 33(5): 1315-1322.
- Patrianakos AP, Zacharaki AA, Kalogerakis A, Solidakis G, Parthenakis FI, et al. (2015) Two-dimensional global and segmental longitudinal strain: Are the results from software in different high-end ultrasound systems comparable? Echo Res Pract 2(1): 29-39.
- Nelson MR, Hurst RT, Raslan SF, Cha S, Wilansky S, et al. (2012) Echocardiographic measures of myocardial deformation by speckle tracking technologies: The need for standardization? J Am Soc Echocardiogr 25: 1189-1194.
- Thomas JD, Badano LP (2013) EACVI-ASE-industry initiative to standardize deformation imaging: A brief update from the co-chairs. Eur Heart J Cardiovasc Imaging 14(11): 1039-1040.
- Zweerink A, Allaart CP, Kuijer JPA, Wu L, Beek AM, et al. (2017) Strain analysis in CRT candidates using the novel Segment Length in Cine (SLICE) post-processing technique on standard CMR cine images. Eur Radiol 27(12): 5158-5168.
© 2025 Akhil Mehrotra. This is an open access article distributed under the terms of the Creative Commons Attribution License , which permits unrestricted use, distribution, and build upon your work non-commercially.
 a Creative Commons Attribution 4.0 International License. Based on a work at www.crimsonpublishers.com.
Best viewed in


.jpg)


 Editorial Board Registrations
 Submit your Article
 Refer a Friend
 Advertise With Us
.jpg)


.jpg)


.bmp)
.jpg)
.png)
.jpg)


.jpg)


.png)

.png)


.png)


