
- About Us
- Information
-

The Author ensures that the research has been conducted responsibly and ethically with adherence to all relevant regulations. read more..
- For Authors
- For Reviewer
- Manuscript Guidelines
- Membership
- Publication Ethics
-
- Journals
- Reprints
- e-Books
- Videos
- Policies
- Contact Us
 COVID-19
- Submissions


Full Text
Open Journal of Cardiology & Heart Diseases
A Mathematical Approach to Characterize Left Ventricular Hypertrophy from ECG Diagrams
Srijan Sengupta1, Uttam Ghosh1*, Susmita Sarkar1 and Shantanu Das2
1Department of Applied Mathematics, University of Calcutta,India
2Reactor Control Systems Design Section E & I Group BARC Mumbai, India
*Corresponding author: Uttam Ghosh, Assistant Professor, Department of Applied Mathematics, University of Calcutta, 92 APC Road, Kolkata 700 009, India
Submission: September 30, 2017; Published: January 31, 2018

ISSN: 2578-0204 Volume1 Issue2
Abstract
In this paper we have introduced a new mathematical approach to predict Left Ventricular Hypertrophy using fractional calculus. ECG graphs contain several points which are non-differentiable in the sense of classical calculus and termed as unreachable points. But these unreachable points are differentiable in the sense of fractional calculus. Though fractional calculus was born on 1695, still it is a developing field. Several mathematicians defined fractional derivatives in different ways. In this paper we have found modified left and right Riemann-Liouville derivative and calculated their difference at each unreachable point of the PQRST complexes of ECG graphs. This difference, termed as Phase Transition (P.T.) has been considered as an indicator for detection of LVH problem. For LVH patients it has been shown to be higher than normal people.
Keywords: Jumarie type fractional derivative; Left ventricular hypertrophy; Phase transition
Introduction
The fractional calculus is the generalization of ordinary differentiation and integration to an arbitrary order and is a growing field of Applied Mathematics [1-4]. It has many applications in Mathematical Biology, Engineering, Mathematical Economics etc. [5-7]. In reality there are many functions which are everywhere continuous but non-differentiable at some or all points. The ECG, EEG, stock market curves [8,9], the coast line [8,9] curves are representation of such types of functions. ECG stands for electrocardiogram or electrocardiograph which is the pictographic representation of the electrical charge depolarization and repolarization of the muscles of heart [10]. Such ECG is crucial for the diagnosis and management of abnormal cardiac rhythms. There are several types of heart diseases that cause chest pain which may be for Left Ventricular Hypertrophy, Right Ventricular Hypertrophy etc. To perform the study we take ECG samples from internet freely. Here the samples are chosen randomly with no preference of sex or age group. Actually we have studied it empirically.
In this paper we have characterized the unreachable points i. e. non-differentiable points of a Normal ECG and Abnormal ECG graphs (in my case Left Ventricular Hypertrophy choosing arbitrarily) by using Jumarie definition of fractional derivative [9]. Here we have found left and right fractional order derivative and corresponding phase transition at the non-differentiable points of the considerable ECG. It is observed that the calculated values of the phase transition at the non-differentiable points of LVH patients are higher than the values of normal ECGs. to study in normal and abnormal ECG curve; and finally this paper is concluded in section 4.0.
Some Definitions
Left ventricular hypertrophy (LVH)
Left Ventricular hypertrophy (LVH) is a condition where the muscle wall of heart's left pumping chamber (ventricle) becomes enlarged and thickened (hypertrophy). This can arise in response to some reason such as high blood pressure, aortic valve stenosis, hypertrophic cardiomyopathy or a heart condition that causes the left ventricle to work harder. Left ventricular hypertrophy is very common in people who have uncontrolled high blood pressure [10]. Certain genetic conditions are associated with developing hypertrophy. Women with hypertension are at higher risk of Left ventricular hypertrophy (LVH) than are men with similar blood pressure.
Symptoms
Left ventricular hypertrophy usually develops gradually. Patients may experience no signs or symptoms, especially during the early stages of the condition. The symptoms happen when the condition causes complications. The most common symptoms of LVH are:
i. Feeling short of breath,
ii. Chest pain, especially after activity,
iii. Feeling dizzy or fainting,
iv. Rapid heartbeat, or a pounding or fluttering sensation in chest.
ECG of LVH (in doctor's view)
Left ventricular hypertrophy causes a tall R wave (>25mm) in lead V5 or V6, a deep S wave in lead V1 or V2, inverted T wave in leads I, II, AVL, V5, V6, sometimes V4 and R waves in lead V5 or V6 plus S wave in lead V1 or V2 greater than 35 mm. It is difficult to diagnose minor degrees of left ventricular hypertrophy from the ECG [11].
Modified definitions of Riemann-Liouville derivative
The basic definitions of fractional derivatives are of Riemann- Liouville (R-L) [2], Caputo [8], and Jumarie [11]. To overcome the shortcoming of the R-L definition that derivative of a constant is non-zero which is contradiction of the conventional integer order calculus, Jumarie [11] first revised the R-L definition of fractional derivative in the following form.
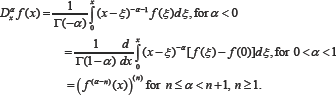
The above definition [11] is developed using left R-L derivative. Similarly modification has also been developed by us using the right R-L derivative [9]. Note in the above definition for negative fractional orders the expression is just Riemann-Liouvelli fractional integration. The modification is carried out in the R-L derivative formula, for the positive fractional orders alpha. The idea of this modification is to remove the offset value of function at start point of the fractional derivative from the function, and carry out R-L derivative as usually done for the function [9].
Unreachable function and graphs
Figure 1: A normal shape of PQRST wave in ECG.

There are many functions which are everywhere continuous but not-differentiable at some points or at all points. These functions are known as unreachable functions [11]. The function (i) is unreachable at the point .This means they have no integer order derivative at but have order derivative at that point [1]. Unreachable graphs are diagrammatic representation of unreachable functions. The ECG graphs are such types of unreachable graphs. They have unreachable points Q, R, S in the 'PQRST wave at which classical derivatives do not exist but fractional derivatives exist. In this paper we have used Q, R, S as points though they are wave of ECG shown in Figure 1.
Phase transition
We define the phase transition at a non-differentiable point of a continuous graph as the difference between the left and right modified R-L derivatives at that point.
Fractional Calculus Technique for Characterizing Left Ventricular Hypertrophy
In this section we shall describe the fractional calculus technique for characterizing left ventricular hypertrophy from ECG diagrams. This mathematical technique is used to calculate both left and right fractional derivatives and hence the phase transitions at the Q, R, S points of the QRS complexes of the V1, V2, V5 and V6 leads of ECG graphs. For this purpose first we take two points say Q1 at above of the Q point on QRS complex and say S1 after the point S on the same QRS complex of the ECG. So we can fit three straight lines with five points Q1, Q, R, S, S1 in which three non-differential points are present. This case arises many times in ECG leads. Due to this purpose we have to calculate left and right fractional derivative together with corresponding phase transition value at the unreachable points of ECG leads. Thus we construct the newly formed theorem as
Theorem
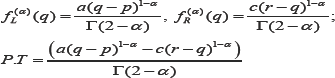
Let us consider the function with It is continuous at x=q such that but not differentiable at that point. Then left fractional derivative, right fractional derivative and phase transition at that point x=q are respectively:
In the above theorem we consider a function which is linear in both sides of non-differentiable point x=q. Similarly sometimes any one or both the segments say P1Q and QR are nonlinear. In those cases similar type of theorems are constructed to evaluate left and right fractional derivative together with corresponding phase transition value at the unreachable points of ECG leads to analyze the ECG graphs. All these cases have to be used in this paper in next section.
Applications of Fractional Derivative in ECG Graphs
Now we shall characterize the ECG graphs by the help of fractional derivative and compare normal ECGs with abnormal ECGs (LVH). For this purpose we shall consider %- order fractional derivatives. The non-differentiable points Q, R, S of QRS complexes of PQRST wave of any leads are used here usually points, not as wave. Also we shall calculate the fractal dimension of the considered leads of ECG graphs. If Q or S point is not prominent at QRS complex of any lead of the ECGs under consideration then we cannot find the Left Fractional Derivative and Right Fractional Derivative at that point. We have denoted those cases by 'NA' i.e. 'Not Arise'. To investigate the characteristics of the ECG we here consider normal ECG and problematic ECG (in our case LVH ECG to be compared with normal ECG).
Since LVH is characterized by deep S wave in V1 and V2 leads and long R wave in V5 and V6 leads. So our concern to find any distinguishing measurements of P.T values at non-differentiable points on S wave in V1 and V2 and R wave in V5 and V6 leads to characterize the problematic ECG (in our case LVH) with normal ECG. Thus our paper contributed only P.T. values at non- differentiable points at those leads for LVH ECGs. So our concern to find any distinguishing measurements of P.T values at non- differentiable points on S wave in V1 and V2 and R wave in V5 and V6 leads to characterize the problematic ECG (in our case LVH) with normal ECG. Following tables are new and constructed from our fractional calculus methodology.
Characterization ECG
The considerable methodology which is now used for normal ECG as well as for problematic ECG (LVH) [12] also shown to help us a strong comparison between Normal ECGs and LVH ECGs in this section.
Table 1A: Length of different parts of ECG: A=Length of S wave (mm) in V1 lead, B=Length of S wave (mm) in V2 lead ,C=Length of R wave (mm) in V5 lead, D=Length of R wave (mm) in V6 lead respectively.

Here, we see that in Table 1A lengths of S and R wave in V1, V2 is also below for normal ECG. So from Doctor's point of view and V5, V6 respectively are all greater than 25mm except length of this patient with problematic ECG has cardiac problem which S wave in V1 lead for problematic ECG, these measurement is below called Left Ventricular Hypertrophy. Now we have to calculate 25mm for normal ECG and length of E,F,G and H are all greater above mentioned techniques to characterize ECGs for comparing than 35mm of that table for problematic ECG, these measurement problematic ECG with normal ECG given below Table 1B & Table 1C.
Table 1B: Phase transition at the non-differentiable points Q,R,S of V1,V2,V5 and V6 leads of Normal ECG sample.

Table 1C: Phase transition at the non-differentiable points Q, R, S of V1, V2, V5 and V6 leads of Problematic ECG (LVH) sample.

Discussion
In this paper we have studied characteristics of normal ECG graphs and ECG graphs of LVH patients, by finding fractional derivatives at non-differentiable points. From the above table (1B- C) it is observed that Phase Transition (P.T) values are maximum at the point R and S of QRS complexes at V1, V2 and V5, V6 leads of problematic ECG respectively. We have recorded and compared the P.T values at the point R and S of V1, V2 and V5, V6 leads of different ECG leads. The P.T. values of different non-differentiable points of the V1, V2, V5, V6 leads in normal ECG are less than 50. For values 50 to 65 the patients are prone to LVH where as patients having P.T. values above 65 in the V1, V2, V5, V6 leads are suffering from LVH problem. But these ranges are not present in many cases such as if there are any other problem together with LVH; also if the nature of any lead behaves like a normal ECG lead (since ECG do not found any disease at first or minor stage in ECG tracing paper many times). In those case Doctors will decide to do another tests like ECO, TMT, Angiography of the patient to detect exact problem of that patient. The values of P.T. of normal ECG leads for different non-differentiable points are low but it increases abruptly for LVH patients. From our samples we can conclude that if the phase transition value is greater than 50 then the person will be in danger zone. Thus by studying large number of ECG it is possible to find the a suitable range for the fractal dimension of the ECG leads and phase transition (P.T) values at the non-differentiable points that will help the doctors to determine the LVH conditions of patients. We will report other ailments in our next study. However, this type of study is not reported elsewhere. This method is a new method we are reporting for the first time-could be an aid for differential diagnostics in medical science.
Compliance with Ethical Standards
Authors declare that none of them have any conflict of interest.
Ethical Approval
All ECG have been downloaded from internet.
Acknowledgement
Authors thank Dr. Tridip Sengupta, Ex-Senior Medical Officer Cardiology, R. G. Kar Medical College & Hospital, Kolkata, and Dr. Manoranjan Mandal, Department of Cardiology, N. R. S. Medical College, Kolkata, for their valuable guidance in understanding ECG graphs from medical point of view, and encouragement on this new idea to have a characterization studies for ECG. The authors are grateful to the anonymous referee for a careful checking of the details and for helpful comments that improved this paper.
References
- Das S (2011) Functional Fractional Calculus. (2nd edn), Springer-Verlag, Berlin, Heldelberg, Germany.
- Podlubny I (1999) Fractional differential equations, mathematics in science and engineering. Academic Press, San Diego, California, USA, p. 198.
- Miller KS, Ross B (1993) An introduction to the fractional calculus and fractional differential equations. John Wiley & Sons, New York, NY, USA.
- Mandelbrot BB (1982) The geometry of nature. Freeman. San Francisco, USA.
- Loverro Adam (2004) Fractional Calculus: History, definitions and Applications for the Engineer.
- Momani S, Odibat Z (2006) Analytical approach to linear fractional partial differential equations arishing in fluid mechanics. Physics Letters A 355(4-5): 271-279.
- Mainardi F (1996) Fractional relaxation-oscillation and fractional diffusion-wave phenomena. Chaos Soliton Fract 7(9) 1461-1477.
- Caputo M (1967) Linear models of dissipation whose q is almost frequency independent-ii. Geophysical Journal of the Royal Astronomical Society 13(5): 529-539.
- Ghosh U, Sengupta S, Sarkar S, Das S (2015) Characterization of non- differentiable points of a function by Fractional derivative of Jumarie type. European Journal of Academic Essays 2(2): 70-86.
- Hampton JR (2010) The ECG made easy. (8th edn).
- Jumarie G (2006) Modified Riemann-Liouville derivative and fractional Taylor series of non-differentiable functions further results. Computers and Mathematics with Applications 51(9-10): 1367-1376.
- ECGs are available from Internet (free Google Images).
© 2018 Srijan Sengupta, et al. This is an open access article distributed under the terms of the Creative Commons Attribution License , which permits unrestricted use, distribution, and build upon your work non-commercially.
Editor In Chief


.jpg)


Signup for Newsletter

Quick Links
 Editorial Board Registrations
 Submit your Article
 Refer a Friend
 Advertise With Us
Our Recent Edition

.jpg)


Top Editors


.jpg)


.bmp)
.jpg)
.png)
.jpg)


.jpg)


.png)

.png)


.png)


Financial Support

Sponsors

Latest e-Books

Latest Video

 a Creative Commons Attribution 4.0 International License. Based on a work at www.crimsonpublishers.com.
Best viewed in
a Creative Commons Attribution 4.0 International License. Based on a work at www.crimsonpublishers.com.
Best viewed in