- Submissions

Full Text
Theranostics of Cancer Research
Transverse Sectional Area and Muscle Density of Triceps Brachii, Biceps Brachii and Deltoideus: Comparative Studies in Cattle and Camel
Hena SA1*, Sonfada ML2, Shehu SA2, Jibir M3, Gosomji IJ1 and Omirinde JO1
1Department of Veterinary Anatomy, University of Jos, Nigeria
2Department of Veterinary Anatomy, Usmanu Danfodiyo University, Nigeria
3Department of Animal Science, Usmanu Danfodiyo University, Nigeria
*Corresponding author: Hena SA, Department of Veterinary Anatomy, Faculty of Veterinary Medicine, University of Jos, Nigeria
Submission: September 26, 2017; Published: October 27, 2017
ISSN: 2577-1922 Volume1 Issue2
Abstract
Skeletal muscle is a highly organized, complex, and dynamic tissue which provides maintenance of body posture against force by distributing loads and absorbing shocks. In this work efforts were done in bringing up information on some anatomical areas related to camel and cattle musculatures. In this study, forelimbs were obtained from 25 male camels (Camelus dromedarius) and from 25 male cattle (Zebu type) each within the ages of 6 months, 1 year, 3 years, 5 years and 7 years from Sokoto Municipal Modern abattoir, Sokoto, Nigeria. The triceps brachii, biceps brachii and the deltoideus muscles were dissected out, and their morphometrics (transverse sectional area and densities) determined. Results showed general increment in transverse sectional area values along chronological age advancement of the animals used, with values in cattle ranging from 11.33±0.80cm2 (deltoideus of 6 month old cattle) to 209.12±7.16cm2 (triceps brachii of 7 year old cattle); and in camel values of 13.83±0.78cm2 (deltoideus of 6 month old camel) to 178.90±6.68cm2 (triceps brachii of 1 year old camel). Muscle density on the other hand indicated decreased values as the ages of the animals increased, with the camel having values ranging between 0.33±0.03g/cm3 (deltoideus of 7 year old camel) to 2.22±0.13g/cm3 (biceps brachii of 6 month old camel); and in the cattle values of 0.26±0.02g/cm3 (deltoideus of 5 year old camel) to 1.16±0.14g/cm3 (biceps brachii of 6 month old camel). From the overall result shown for camel and cattle, the camel on the averagely had higher values for both transverse sectional area and muscle densities. Results from interaction outcomes, revealed that triceps brachii from 7 year old camel had a significantly highest value of transverse sectional area than those obtained from other muscles across different ages from both species studied. In the same vein, biceps brachii muscle obtained from 6 months old camel had highest value for muscle density. The information obtained in this study may not only advance the course of knowledge in this study field, but could also serve a useful tool in clinical practices as well as in proper planning for animal husbandry, more especially in meat science evaluation and monitoring.
Keywords: Transverse sectional area; Muscle density; Camel; Cattle
Introduction
Production of animals with a greater muscle mass in order to increase productivity of animal is a crucial goal in animal breeding and husbandry. Farm animals are classed precocial species due to their relative maturity at birth. Precocial species e.g. cattle and camel, are able to stand and walk immediately after birth, which suggests that a considerable functional development of muscles has occurred prior to birth. Skeletal muscle quantitatively makes up about 50-60% of the carcass weight in the precocial species [1,2]. The type of mechanical activity plays an important role in the development of muscle, including passive stretch imposed by bone growth, shortening of muscle fibres during movement exercise, or chronic stretch imposed by limb immobilization, which each have a differing effect on muscle development [3].
Skeletal muscle is a highly organized, complex, and dynamic tissue that responds to the mechanical forces placed upon it [4-6]. It provides maintenance of body posture against force by distributing loads and absorbing shocks [7]. Locomotion, which is a function of muscle development is essential for acquiring food and to escape predation and is, thus, a key ability of most animals. The specific condition under which skeletal muscle tissue functions in a species impacts on the structural design of the muscle tissue. A dominant mechanical constraint for the function of muscle tissue is animal size. Hoppeler et al. [8] reported that, as animals increase in length, muscle force should increase with the square of the length change while animal mass should increase with the cube of the length change. An important consideration in all modeling efforts is the assumption that force per unit muscle cross-sectional area is the same for animals of all sizes [9].
Efforts were done in bringing up information on some anatomical areas related to camel and cattle musculatures; few among these are our previous works on: Gross and Morphometric Evaluation of Deltoideus Muscle of Cattle and One-Humped Camel [10]; Comparative morphologic and biometric studies of triceps brachii and biceps brachii muscles of cattle and one-humped camel [11]; as well as Determination of perimysial and fascicular diameters of triceps brachii, biceps brachii and deltoideus muscles in Zebu cattle and one-humped camel [12]. Literature searches however could not yield information on muscle transverse sectional area and muscle densities in either the cattle or the camel nor both comparatively; it is against this background that this work was carried out in order to bridge the information gap in these animal’s species.
Materials and Methods
Forelimbs were obtained from 25 male camels (Camelus dromedarius) and from 25 male cattle (Zebu type) each within the ages of 6 months, 1 year, 3 years, 5 years and 7 years, the limbs were purchased from Sokoto Municipal Modern abattoir. The age of each animal was determined prior to slaughter, using the methods of Wilson [13] and Dyce et al. [14], while evaluation of the animals were done through physical examination to exclude any animal with musculoskeletal deformity or diseases [14]. The live body weights of the animals were estimated using linear body measurement based on the formula of Yagil [15].
The forelimbs from the slaughtered animals were obtained and wrapped in clean sterile polythene bags and transported in a clean box containing ice cubes to the Laboratory of the Department of Veterinary Anatomy, Usmanu Danfodiyo University, Sokoto, Nigeria, where the triceps brachii, biceps brachii and deltoideus muscles were all carefully identified and dissected out using the methods of Chibuzo [16] as slightly modified by Sonfada [17]. The connective tissues unsheathing each muscle were trimmed off as much as possible, noting the origin and insertion of every muscle before further different processing and analyses were done. The triceps brachii, biceps brachii and the deltoideus muscles were dissected out, and their morphometrics (muscle weight, length and diameter) determined. The muscle lengths and diameters were measured with a measuring tape (butterfly® type) in centimeters. The weights of larger muscles were however measured using Metler Balance (P1210, Metler Instruments, AG Switzerland, with a sensitivity of 0.1kg) while smaller muscles’ weights were determined using a Digital Electronic Balance (CITIZEN SCALES 1 PVT. LTD, Model MP- 600, with a sensitivity of 0.1g).
The transverse sectional area (TSA) of the muscles was determined as described by Sivachelvan [18]. Using this method, each of the muscles was cut into two halves across the center of the muscle belly (transverse section). A predetermined area of 12cm by 14cm (168cm2) was traced on a tracing paper (Natural Tracing Paper Gateway® model) using a pencil and the traced outline was weighed on a sensitive Digital Electronic Balance (CITIZEN SCALES 1 PVT. LTD, Model MP-600, with a sensitivity of 0.1g) recorded. The cut surface (transverse or cross section) of the muscle was pressed against the weighted tracing paper to outline the circumference of the muscle on the tracing paper. The outlined area of the muscle, already obtained, was cut off from the tracing paper and also weighed. From the known weight of the tracing paper and its initial coverage area, and the now known weight of the transverse section “cut surface” of the muscle on the tracing paper, the TSA was calculated and recorded in cm2). The muscle volume was calculated using a mathematical formula using the already known muscle area and muscle length. Thus: Volume (cm2))=Area (cm2)) x Length (cm).
The Muscle Density was calculated using a mathematical formula by substituting the values of muscle mass (weight) and muscle volume (which was already obtained) in the formula:
Density (g/cm3) = Mass/(Volume(cm2)))
Numerical data obtained were reported as mean±SD (Standard deviation) and presented in form of tables and figures. Data generated from the study were analyzed using a two way ANOVA and correlation analysis was also done on the transverse sectional area and the muscle density. Statistical significance of experimental observations were set at p<0.01 and p<0.05 where appropriate. All statistical analyses were done using SPSS (Version 16.0, 2007).
Results
Figure 1: Effect of age versus species interaction on muscle transverse sectional area.

Figure 2: Effect of age versus muscle interaction on muscle transverse sectional area.

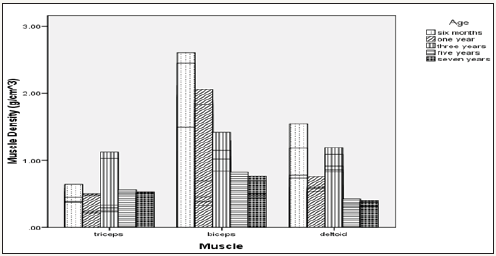
As shown on Table 1, there was a general increment in TSA values along chronological age advancement of the animals used. Muscle density on the other hand indicated decreased values as the ages of the animals increased (Table 1). From the overall result shown on Table 2 for both camel and cattle, the camel on the average indicated higher values for both TSA and the muscle densities. Figure 1 & 2 indicated interaction outcomes, which revealed that triceps brachii from 7 year old camel had a significantly highest value of TSA than those obtained from other muscles across different ages from both species studied. In the same vein, Figure 3-5 indicated that biceps brachii muscle obtained from 6 months old camel had highest value for muscle density.
Table 1: Transverse sectional area (TSA) and muscle density (MD) of triceps brachii, biceps brachii, and deltoideus in camel and cattle (Mean±SD).
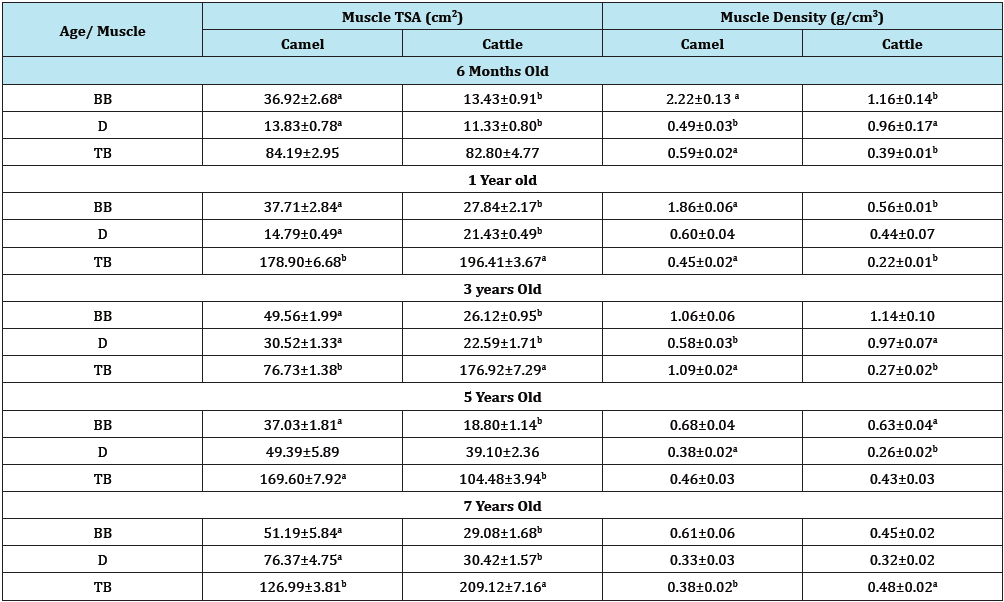
abMeans bearing different superscript in the same row within a subclass differ significantly (p<0.05)
BB: Biceps Brachii; D: Deltoideus; TB: Triceps Brachii; TSA: Transverse Sectional Area
Table 2: Overall mean muscle density and transverse sectional area.
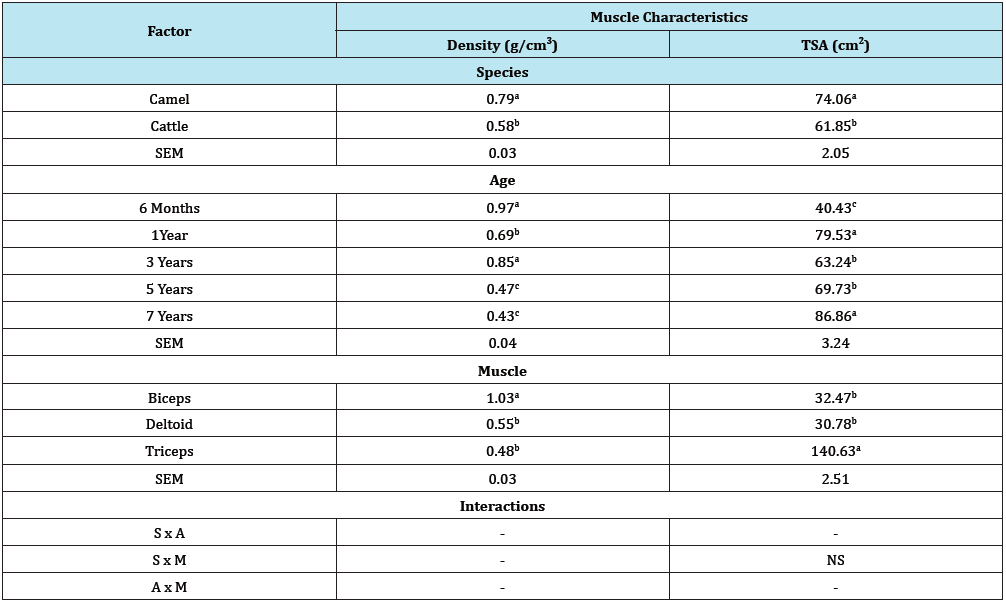
Figure 3: Effect of age versus species interaction on muscle density.
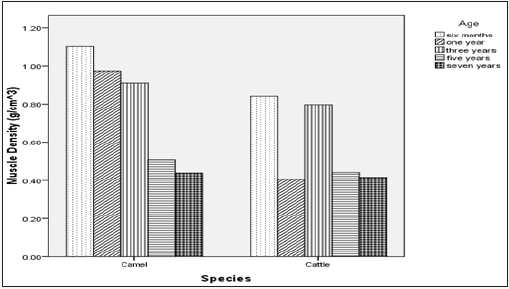
Figure 4: Effect of muscle versus species interaction on muscle density.
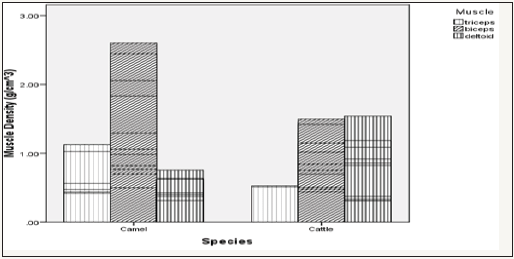
Figure 5: Effect of age versus muscle interaction on muscle density.
Discussion
This present study, with the mean TSA value of 35.85cm2 for the cattle aged 6 months, agreed with the findings of Albrecht et al. [19], where they reported that German Angus, studied at different ages of 6 months, 1 year and 2 years have shown mean transverse sectional area (TSA) of 35.3cm2, 59.3cm2, and 99.6cm2; so also agreed with the general increase in the TSA values along chronological ages as was also observed in this present study. Coefficients of correlation between muscle TSA and muscle density, indicated significantly positive values (p<0.01), this means that increase in muscle TSA had corresponding effects of muscle density increase. This was found to agree with the findings of Hall, [20]. This also further proved that muscle growth is isometrical across age advancement [21].
The obtained muscle density for the camel and cattle was in contrast to the report of Morale et al. [22]. He asserted that the composite tissue densities (e.g. muscle with slight amounts of fat) in man are the same as those for the common experimental mammals. In the present work, the camel had denser muscle than the cattle with the muscle density for the biceps brachii being denser than other muscle types across the species. This finding could be attributed to the stout nature of this muscle compared to triceps brachii and the deltoideus.
In this study, the muscle density showed decreased values along age increase, as observed from the overall means among both camel and cattle studied, this was confirmed from the correlation result where correlation coefficient of muscle TSA and muscle density were all significant (p<0.05). This however, is in contrast to the reports of Shareha et al. [23] that camel muscle had an increased density and muscle fibres diameter, which reduces the percentage of fat deposition between the muscle fibres. This assertion has on the other hand supported the fact that camel muscle has less fat compared to cattle as claimed by Eliman et al. [24], although in the present study the analysis of muscle fat was not done.
The shape of muscle fibre bundles is influenced by the region within the muscle as reported by Totland et al. [25], however, in the present study the muscles sampled for the TSA were all from the mid belly region of the different muscles, obtained somewhere half way along the entire muscle length, and as such the TSA values were true reflection of the muscle architecture. In the present work, muscle TSA showed increased values with increased chronological ages, this is in agreement with the findings of Wegner et al. [26], and it is a reflection of muscle growth along age increase among the animals studied. The ability to accurately and efficiently quantify muscle size is vital for assessing muscle function, because muscle mass is the primary determinant of muscle strength [27,28] although in the present study, muscle strength and functions were not assessed.
Though this study was concerned with only normal muscles, the application of the findings in this work may find acceptance in clinical practice as it has been reported by Paddon et al. [29] as well as Nosaka et al. [30] that muscle swelling can be assessed by measuring limb/muscle circumference using a tape measure, and/ or muscle thickness. However, to evaluate muscle swelling more accurately according to Chan et al. [31] it is better to measure muscle transverse sectional area, these were however evaluated in this work but they are not related to muscle swelling but to normal muscle growth along chronological age advancement of the animals and their body status. It has been asserted that two muscles of the same transverse-sectional area will have the same potential force of contraction but if one is twice as long, it will be able to contract further and thus perform more external work. The forelimb muscles of a quadrupedal animal should therefore be specialized in weight bearing, since they are critical in stabilization and force production during gait [32-35]. The information obtained in this study may not only advance the course of knowledge in this study field, but could also serve a useful tool in clinical practices as well as in proper planning of animal husbandry more especially in meat science evaluation and monitoring.
References
- McCoard SA (1998) The development and growth of skeletal muscle in fetal and neonatal lambs. A Thesis presented in partial fulfilment of the requirements for the Degree of Doctor of Philosophy in Animal Science at Massey University.
- Gunn HM (1989) Heart weight and running ability. J Anat 167: 225-233.
- Goldspink G, Scutt A, Loughna PT, Wells DJ, Jaenicke T, et al. (1992) Gene expression in skeletal muscle in response to stretch and force generation. Am J Physiol 262(3): R356-R363.
- Caiozzo VJ (2002) Plasticity of skeletal muscle phenotype: mechanical consequences. Muscle and Nerve 26(6): 740-768.
- Lieber RL (2002) Skeletal muscle structure, function, and plasticity. (2nd edn), Lippincott Williams & Wilkins, Baltimore (MD), Maryland, USA, p. 369.
- Botticelli R, Reggiani C (2006) Skeletal muscle plasticity in health and disease: from genes to whole muscle. Springer, New York, USA, p. 376.
- Lorenz T, Campello M (2001) Biomechanics of skeletal muscle. In Nordin M, Frankel VH, (Eds.), Basic Biomechanics of the Musculoskeletal System. (3rd edn), Lippincott Williams and Wilkins, Baltimore (MD), Maryland, USA, pp. 148-171.
- Hoppeler H, Fluck M (2002) Normal mammalian skeletal muscle and its phenotypic plasticity. J Exp Biol 205(15): 2143-2152.
- Close RI (1972) Dynamic properties of mammalian skeletal muscle. Physiol Rev 52(1): 129-197.
- Hena SA, Sonfada ML, Shehu SA, Jibir M, Gosomji IJ, et al. (2017) Gross and Morphometric evaluation of deltoideus Muscle of cattle and onehumped camel. International Journal of Innovative Research in Medical Science 2(7): 1010-1014.
- Hena SA, Sonfada ML, Shehu SA, Jibir M (2017) Comparative morphologic and biometric studies of triceps brachii and biceps brachii muscles of cattle and one-humped camel. Vom Journal of Veterinary Science 11: 36- 44.
- Hena SA, Sonfada ML, Shehu SA, Jibir M (2017) Determination of perimysial and fascicular diameters of triceps brachii, biceps brachii and deltoid muscles in Zebu cattle and one-humped camel. Sokoto Journal of Veterinary Sciences 15: 74-79.
- Wilson RT (1984) The camel. (1st edn), Longman Group Ltd., Burnt Mill, Halow, Essex, UK, pp.18.
- Dyce KM, Sack WO, Wensing CJG (2010) Textbook of Veterinary Anatomy. (4th edn), WB Saunders Company, Philadelphia, USA.
- Yagil R (1994) The camel in today’s world. A Handbook on Camel Management. Germany-Israel Fund for Research and International Development & Deutsche Welthungerhilfe, Bonn, Germany, p. 74.
- Chibuzo GA (2006) Ruminant Dissection Guide: A Regional Approach in the Goat. (2nd edn), Beth-Bekka Academic Publishers Limited, Maiduguri, Nigeria.
- Sonfada ML (2008) Age related changes in musculoskeletal Tissues of one-humped camel (Camelus dromedarius) from foetal period to two years old. A PhD Thesis, Department of Veterinary Anatomy, Faculty of Veterinary Medicine, Usmanu Danfodiyo University, Sokoto, Nigeria.
- Sivachelvan MN (1981) Anatomical Study of Adaptive Process in Muscle. PhD, Thesis, Massey University.
- Albrecht E, Teuscher F, Ender K, Wegner J (2014) Growth and Breed related changes of muscle bundle structures in cattle. J Anim Sci 84(11): 2959-2964.
- Hall BK (1985) An introduction to Bones by PDF Murray (1936). Revised edition. Cambridge University Press, Cambridge, England, pp. 11-19.
- Sivachelvan MN, Davies AS (1986) Antenatal anticipation of postnatal muscle function. J Anat 132(4): 545-555.
- Morale MF, Rathbun EN, Robert E, Smith Q, Paces N (1945) Studies on body composition: II. Theoretical considerations regarding the major body tissue components, with suggestions for application to man. J Biol Chem 158: 677-684.
- Shareha AM, Harmas S, Shagan AM, Al-Magrous N (2013) The effect of age on fat deposition in longissimus dorsi muscle in camel compared to goat. Int’l scientific conference of camelid and production, Khartoum- Sudan, North Africa, pp. 30-35.
- Eliman ME, Hamed ASM, Omer SIA, Ombabi YA (2013) The effects of age on carcass characteristics on male camels in Gadarif State, Sudan. ISCCRP, Khartoum, Sudan, North Africa, pp. 41-46.
- Totland GK, Kryvi H, Slinde E (1988) Composition of muscle fibre types and connective tissue in bovine M semitendinosus and its relation to tenderness. Meat Sci 23(4): 303-315.
- Wegner J, Albrecht E, Fiedler I, Teuscher F, Papstein HJ, et al. (2000) Growth and breed related changes of muscle fibre characteristics in cattle. J Anim Sci 78(6): 1485-1496.
- Cooke R (1997) Actomyosin interaction in striated muscle. Physiol Rev 77(3): 671-697.
- Moritani T, DeVries HA (1979) Neural factors versus hypertrophy in the time course of muscle strength gain. Am J Phys Med Rehabil 58(3): 115- 130.
- Paddon-Jones D, Abernethy P (2001) Acute adaptation to low volume eccentric exercise. Med Sci Sports Exerc 33(7): 1213-1219.
- Nosaka K, Newton M (2002) Is recovery from muscle damage retarded by a subsequent bout of eccentric exercise inducing larger decreases in force? J Sci Med Sport 5(3): 204-208.
- Chan R, Newton M, Nosaka K (2012) Measurement of biceps brachii muscle Cross-sectional area by extended-field-of view Ultrasound imaging technique. Kinesiologia Slovenica 19 (2): 36-44.
- Clarke KA, Still J (1999) Gait analysis in the mouse. Physiology and Behavior 66(5): 723-729.
- Green DJ (2010) Shoulder functional anatomy and development: implications for interpreting early hominin locomotion [dissertation]. The George Washington University, Washington (DC), USA, p. 377.
- Green DJ, Hamrick MW, Richmond BG (2011) The effects of hypermuscularity on shoulder morphology in myostatin-deficient mice. Journal of Anatomy 218(5): 544-557.
- Green DJ, Richmond BG, Miran SL (2012) Mouse shoulder morphology responds to locomotor activity and kinematic differences in climbing and running. J Exp Zool B Mol Dev Evol 318(8): 621-638.
© 2017 Hena SA, et al. This is an open access article distributed under the terms of the Creative Commons Attribution License , which permits unrestricted use, distribution, and build upon your work non-commercially.
 a Creative Commons Attribution 4.0 International License. Based on a work at www.crimsonpublishers.com.
Best viewed in


.jpg)


 Editorial Board Registrations
 Submit your Article
 Refer a Friend
 Advertise With Us
.jpg)


.jpg)


.bmp)
.jpg)
.png)
.jpg)


.jpg)


.png)

.png)


.png)


