
- About Us
- Guidelines
-

The Author ensures that the research has been conducted responsibly and ethically with adherence to all relevant regulations. read more..
- For Authors
- For Reviewer
- Manuscript Guidelines
- Membership
- Publication Ethics
-
- Journals
- Reprints
- e-Books
- Videos
- Indexing
- Contact Us
 COVID-19
- Submissions


Full Text
Open Access Biostatistics & Bioinformatics
An Intrusion Detection System based on Deep Learning
Virgilio Cusano, Emilio Fattibene, Mariagrazia Fugini* and Fabrizio Amarilli
Department of Information, Electronics and Bioengineering (DEIB), University of Maryland, Italy
*Corresponding author: Mariagrazia Fugini, Department of Information, Electronics and Bioengineering (DEIB), University of Maryland, Italy
Submitted: September 24, 2025; Published: November 05, 2025

ISSN: 2578-0247 Volume4 Issue 1
Abstract
With the rapid growth of network traffic, malicious users are rapidly developing new methods of network intrusion. To face these threats, current security systems have to develop high accuracy, short response time, and a never seen agility in recognizing the before-never-seen threats. One of the most crucial components of security systems is the Intrusion Detection System (IDS). This paper explores Machine Learning (ML) approaches for IDS. In this article we propose an IDS based on ensemble voting. We perform testing on real-world data using the UNSW-NB15 dataset and employing an unbalanced database with four different classification algorithms: Decision tree, random forest, k-nearest neighbour, and multiple layer perceptron. The voting ensemble classification method is used to improve the accuracy of the model and reduce the number of false positives. By using Deep Learning (DL) we also increase the possibility of discovery of new attacks. This research has also the goal of increasing the explainability of anomaly-based Network IDS, a problem now central in the literature of ML and DL-based systems.
Keywords:Intrusion detection; Deep learning; Machine learning; Ensemble learning; Voting; Explainable AI
Introduction
In an increasingly digital and diverse environment, the protection of private information and digital infrastructures using only traditional security solutions is a challenging task. Recent reports suggest that there is an increasingly number of the most common types of cybersecurity attacks, such as: DDos, MITM attacks, phishing and ransomware. In fact, in 2023 the number of ddos attacks per user has grown by 94% compared to 2022 [1], which evidences that there is a huge lack of defences against these attacks. In the (CS)2 AI-KPMG Control System Cybersecurity Annual Report [2], KPMG classified IDSs as the most used security technology to protect the organization assets against cyber threats. An IDS (Intrusion Detection System) is a set of mechanisms that monitor network traffic to detect suspicious or abnormal activity and then take actions based on the type of action. IDSs have several classifications depending on different variables. The most common types are based on the information source, on the type of analysis, and on the type of response.
Information source
i. Network-based (NIDS): The IDS analyzes the network traffic (e.g., packets) to detect possible attacks or intrusions. It requires distributed sensors in various strategic points of the network. The pros are that it needs few sensors to monitor even a large network but the cons are the low efficiency in a network congestion (Figure 1).
Figure 1:(CS)2 AI-KPMG 2024 report.

ii. Host-based (HIDS): The IDS is installed on every machine that needs to be protected and monitors process and application on the host where is installed. It exhibits high precision, especially in detecting Trojan Horse and Worms, but requires complex management due to his poor scalability..
The types of analysis executed by an IDS are as follows:
a. Signature detection: This analysis is meant to detect
patterns called signature of behavior related to known
attacks. This type of IDS has a low rate of false positives and
is characterized by a fast reaction time. The main drawback
of signature-based IDSs is the inability to recognize unknown
attacks.
b. Anomaly detection: On the opposite side, compared to
signature detection, this analysis focuses on anomaly action
without confronting it with previous pattern attack. This IDS
detects relevant deviations from the normal behavior of a
system by comparing them with the model built from history
data. Although the high percentage of false positives, these IDS
can detect unknown attacks.
Accordingly, the types of response are the following:
i. Active Response: The IDS can decide the type of action.
An active IDS usually resets the connection or reconfigures the
firewall trying to block the ongoing attack.
ii. Passive Response: The IDS notifies the system
administrator reporting the attack and delegates to specialized
operators the solution to prevent damage.
The IDS proposed in this article is a passive anomaly-based NIDS.
While IDSs in general require high accuracy and a short response time, passive IDSs, which are meant to provide results to be checked by an operator, require additional care on transparency and report readability. The proposed solution produces a report, both in csv and xlsx format, with the aim to be easy to be inspected. The goal of a readable report is to allow an expert operator to determine whether the IDS result is correct and implement the best policy to combat the signalled threat, so reducing the overall response time. To achieve this feature, we selected a minimal complete partition of the collected features. Since the volume of network flows is continuously growing, machine learning and deep learning become fundamental techniques for cybersecurity. Commonly used classification algorithms, such as decision tree and random forest [3], provide high accuracy, but they can be prone to problems such as overfitting. To face these problems, feature selection was used.
The main advantages of using feature selection are:
a. Avoiding the curse of dimensionality;
b. Avoiding overfitting;
c. Reducing the comprehensive time required for the model
fitting and prediction;
d. Facilitating the model interpretability.
Feature selection can help increase precision and reduce recall, but the final results strongly depend on the classification algorithm’s precision. To overcome the limits of the classifier, an ensemble method is provided. Using ensemble methods, in our case voting, can reduce false positives and increase accuracy and prediction. This improvement is mostly compensated for by the time required for the ensemble method. To reduce time consumption, parallelization and dataset reduction techniques are used. The paper is organized as follows. In section 2 we present related work. In section 3, we describe the innovation of our proposed approach. In section 4 the project engineering is illustrated. In section 5, we document the project. Finally, in section 6 we describe the results produced by our IDS and in section 7 we report our concluding remarks.
Related Work
In recent years, IDS research has mainly focused on improving accuracy and adaptability to new threats through the implementation of machine learning and deep learning techniques. For example, through the adoption of DL it has been possible to achieve high accuracy in the binary classification of DDoS attacks [4]. Given its increasingly frequent use, IDS have been used in various fields, such as automotive, with the aim of monitoring the Controller Area Network (CAN) of vehicles through the adoption of hybrid neural networks [5]. In the case of this research, the project aims to provide an adaptive and precise solution, with the possibility of use in various fields, providing as an innovation the use of ensemble voting with the aim of increasing the accuracy of the results. In fact, not only were all best practices followed and the most performing algorithms in the current literature used, but it was done in such a way as to guarantee a low rate of false positives and false negatives through particular attention to voting management.
One of the critical issues that must be addressed in network security is the implementation of an effective network intrusion detection. Despite the progress made in this field, the majority of Network- IDS are signature-based, leading to a complex network exposed to zero-day attacks and an alternative version of known attacks. In particular, an increasing number of systems are adopting signature-based IDS rather than anomaly detection IDS for reasons such as, durability of training data, high costs, and error rates owing to the dynamic nature of the data. Progressively, IDS’s are evolving as market product letting companies use them as COTS, as they are becoming the primary subject and direction of internet security research. Technology for intrusion detection is in constant development thanks to the incorporation of technologies like: Data mining, that allow an IDS to perform a more efficient and accurate training, pattern recognition, enhancing signature-based systems, and neural, networks that has improved the speed in the recognition phase.
Talking about adaptability to new and unforeseen attack patterns, recent studies done by Yoheswari [6] shows that by updating periodically the dataframe used to train the model with new and before unknown attacks, could significantly increase the accuracy, false positive rate and computational efficiency. As a matter of fact, future work could possibly implement a mechanism to update the data base used by the model with new behavior discovered during activity recognition, enhancing the accuracy of future prediction. Dini et al. [7] produced an interesting overview on IDSs, comparing different classifiers performances on three different datasets. This is one of the few studies that compares not only binary classification and multi-class classification, but also their computation time. It is noted that multi-class classification is lacks in precision and is more computationally demanding compared to binary classification.
Hnamte et al. [8] propose a hybrid deep learning-based IDS. The proposed model is heavily focused on deep learning and achieved 99.64% accuracy when tested. While the performance is outstanding, the computational time is not discussed. Milosevic et al. [9] explore a weighted voting ensemble method that uses deep learning-based classifiers. This model, tested using the CICIDS-2017 dataset, is unable to identify web attacks but produces outstanding results in all the other categories. Again, in the paper is not explored computational time, which could be problematic if using a deep learning-based ensemble method. Sridevi et al. [10] propose a supervised learning-based voting classifier. The proposed model produces optimal results, but the chosen dataset was collected more than 25 years ago and it contains only four categories of attacks. Deep learning-based classifiers are also not explored as well as computational time. Jain et al. [11] propose an IDS that uses an ensemble technique composed of eleven models. The proposed classifiers are both machine learning-based and deep learning-based. Memory-managing classifiers such as LightGBM are also explored, providing an insight on future developments. In a nutshell, DL-based IDSs and voting-based IDSs are both explored in the literature and provide promising results. On the other hand, their computational cost is seldom explored and discussed, although is extremely relevant in NIDS.
Innovation of the Approach
The proposed IDS model combines several good practices and recently proposed methods to achieve high accuracy, low false positives rates and high explainability. The innovation of our research is in the analysis of time complexity and explainability, both crucial for IDSs and scarcely analyzed in the literature. The main elements of our approach are listed in what follows.
Data preprocessing
Datasets usually contain features, which may affect the performance of some machine learning algorithms. Gradient descent-based algorithms, like neural networks, are greatly affected by this. Following these principles, we used several label encoders to transform the values of the string-based columns in a numeric value. The label encoder implemented by sklearn1 uses a numerical codification. Due to the problem structure, additional preprocessing, such as Principal Component Analysis (PCA), would have led to an analysis in an eleven-dimensional space. For this reason, we did not produce any additional preprocessing analysis. A scaler was applied to each classifier; more specifically, a minmax scaler was applied to the decision trees, random forest, and KNN, while a standard scaler was applied to the MLP. The small amount of data preprocessing required is due to the chosen dataset. The UNSW-NB15 dataset, which will be discussed later, provides a preprocessed dataset. Raw data, which we decided not to use, were also available. To include this model in a more complex system, data preprocessing would be fundamental.
Ensemble method
Ensemble classification is a result of the byzantine general’s problem [12]. Ensemble classification relies on the credibility of the singular components and provides a result based on the convolution of the results. Ensemble methods construct a set of several classifiers and provide a result based on a convolution of the results of the classifiers. To provide the result, ensemble methods offer several mechanisms, such as voting, stacking, and bagging. Ensemble classifiers offer the advantage of achieving higher accuracy and a lower false positive rate than the original classifiers. Weighting the classifiers, which is the analog version of the hyperparameter setting for the singular classifier, can help achieve better results.
Ensemble methods can be classified into two distinct groups:
i. Parallel: Parallel models train their models independently.
This method does not drastically increase the time complexity
if the mathematical parallelization is followed by a physical
parallelization of the classifiers on several cores. In this study we
use the average method for soft voting, which can be represented
by the following equation (1):
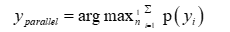
with n being the number of classifiers used by the model.
In soft voting, the final prediction is based on the predicted probabilities of each class.
ii. Sequential: Sequential models use the result of the previous classifier in order to reduce the total error of the ensemble method. These methods can be more time consuming because of their sequential nature (Figure 2). In this research, two parallel voting ensemble classifiers were used to achieve higher accuracy and to reduce false positives. To reduce time complexity, parallelization was used, allocating one core to every classifier.
Figure 2:https://www.ibm.com/think/topics/ensemble-learning.

Deep learning
Deep Learning (DL) refers to a family of algorithms that uses hidden layers to calculate the prediction. We used the Multiple Layer Perceptron (MLP) classification algorithm, which uses several hidden layers to predict the correct value. A Perceptron [13], as the original definition states, is a system that learns to recognize similarities or identities between patterns of optical, electrical, or tonal information, in a manner that may be closely analogous to the perceptual processes of a biological brain. The MLP works by feeding to the i-th layer the results of the previous layer’s perceptron’s. When the last layer predicts the result, a filter such as the Rectified Linear Unit (RLU) function or the adam solver [14] is applied and the result is recalculated until the model achieves a satisfactory result. This system allows the classification algorithm to be more agile and not prone to phenomenon such as overfitting or underfitting. The cons reside in low explainability and in the fact that these systems are susceptible to normalization. DL for malicious packets detection is a double-edged sword. On the one side, it achieves better results than any other model in detecting the least-represented attacks, on the other side it reduces the explainability. DL algorithms also usually have higher computational complexity than the other classifiers.
Explainability (XAI)
Explainability is a matter of strong interest in recent research. Explainability is about the ability of a model to provide an understandable explanation for its predictions. This ability is crucial to building trust and confidence in the model. An organization which uses deep-learning and AI has to keep this in mind. Explainability is pivotal in the proposed model. Explainability in a passive IDS is crucial because of the role of the human operator that interprets its results. In particular, explainability for IDSs produces advantages both in reducing comprehensive analysis time, both in incrementing the human operator accuracy itself. Explainability is provided in terms of the format of the model output, namely .xlsx format file containing seven features (IP sender, IP receiver, Protocol, Service, Duration, Rate, Attack category). This format can be more easily explored and changed both in the file format and in the features. Regarding the format, a .csv was also explored to reduce the report production time, but the .xlsx format was chosen to improve readability. The use of an ensemble of model-agnostic tools, such as SHAP, and model-specific tools increases the explainability of the model, supporting trust in the model and additional explainability. Tools like SHAP aim to facilitate the human operator’s decisionmaking based on the classification results. Both SHAP and the model-specific tools can be used to gain information on the entire system or on specific classifiers.
Time efficiency
Time performances are rarely covered in the literature. The proposed system is not only able to classify with high accuracy, but also implements several mechanisms to reduce time complexity. The classification algorithms are chosen keeping in mind their time complexity. Furthermore, the ensemble model is trained and classifies on several cores, reducing the duration required by both actions via parallelization. The test dataset was also divided in batches to simulate a real network flow. The batches dimension was set to 2000, but in a future application the size will be adjusted dynamically, scaling its value by considering both the thread pool and the incoming traffic flow. Time efficiency, although seldom covered in the literature, is one of the most important criteria for IDSs: the IDS response time affects the entire organization, helping confining an attack in the best case, or making the IDS useless in the worst case. Usually there is a tradeoff between model complexity and performance, but using the explained methods, we could achieve the same predicting performances of computationally heavy algorithms using lower computationally expensive algorithms, reducing the time needed for classification. The report production phase is time consuming and can reach almost 0.33% of the total classification time if half of the packets in the batch are attacks. Although this could be a problem for time efficiency, due to the passivity of the IDS the human action is still required and compared to the time scale of the human action, the delay is richly mitigated. Furthermore, switching to less consuming formats, such as .csv, could help mitigating this problem.
Project Development
This project is a python-based implementation. The selected IDE was Visual Studio Code and all the statistics are calculated on an Intel(R) Core (TM) Ultra 5 125U process.
UNSW-NB15 dataset
The UNSW-NB15 dataset [15] is one of the few publicly available datasets for network-based anomalies and it immediately gained acknowledgments in literature. Among the available datasets, UNSW-NB15 is also one of the most recent ones. Most of the contained attacks are unfortunately still heavily diffused worldwide.
The Cyber Range Lab of UNSW was generated and captured using
tcpdump 100GB of raw traffic. UNSW-NB15 contains a total of two
million and 540,044 records. In our project, a portion of this dataset
has been used as a training and testing set. This portion is divided
into 41 features and contains ten distinct categories of attacks:
a. Fuzzers;
b. Analysis;
c. Backdoors;
d. DoS;
e. Exploits;
f. Generic;
g. Reconnaissance;
h. Shellcode;
i. Worms;
j. Normal.
Fuzzers are attacks born from bug hunting. By feeding the system with invalid data, a bug can be installed, so allowing an attacker to exploit the vulnerability and gain unauthorized access, extract sensitive data, or disrupt services. Analysis attacks exploit the vulnerability found by analyzing power consumption of a device, or network traffic, or database operations. Power consumption can be a crucial information to break cryptographic algorithms; the time employed to elaborate a query in a database can expose hints on secret data. Backdoors are pieces of code, either maliciously or non-malicious, inserted in a program to gain access privileges (e.g., supervisor privileges) allowing the bypassing of authentication and verifications steps. Backdoors are frequently used by system administrators to accelerate their control routine on a system. However, these shortcuts are extremely dangerous and can allow attackers to gain full control of a whole system with minimal effort. Denial of Service (DoS) are attacks aimed at denying a particular service by inundating the network with a barrage of either valid or invalid messages. Usually, attackers use various devices to increase the rate of packets transmitted to the target server. In this case, we have Distributed Denial of Service (DDoS).
With the term” exploit” we identify a method or piece of code that takes advantage of vulnerabilities in software, applications, networks, operating systems, or hardware. Thanks to exploits, attackers can gain privileged (e.g., in supervisor mode) access to a system or inject a malicious script in legitimate software.
Generic attacks are a type of cyber-attack that can be used to reconstruct information from a database, even if the attacker does not know the data or queries. As a matter of fact, the majority of databases have different layers of secrecy and it is crucial to implement strong security controls to avoid attackers to get hints about secret data by submitting particular queries to the system. Opponents’ information is crucial to perform a successful attack, so attackers use Reconnaissance attacks to gather as much information as possible on the target before performing a full attack. Shellcodes are small pieces of code, such as scripts, used as the payload in the exploitation of a software vulnerability. They usually, in turn, exploit vulnerability to allow another successful attack. Worms are one type of malware. In particular, worms have the ability to autonomously self-reproduce their code to infect different systems. Attackers usually use worms to infect different devices to perform a DDoS (Distributed DoS) attack. With the category Normal we identify a normal action on the system, so it is not marked as an attack. The first nine categories contain attacks, while the last one contains the remaining traffic. This database was chosen from six different databases found in literature (KDD99-Cup, UNSW-NB15, CIC-IDS 2017, CSE-CIC-IDS 2018, BOT-IoT, CIDDS-001/CIDDS-002).
The main reason why this database was selected are:
i. The database contains a collection of both manufactured
and real-world traffic, making it realistic;
ii. The database was collected using publicly available tools
(tcpdump), which allows to recreate the collection process in a
real network;
iii. The Training and Testing sets were discovered to be
sufficient to reach high precision even though the dimension
of these datasets is contained. This leads to low training time,
which could be crucial in the case of a reset of the device
following an attack to the IDS itself or a critical failure (Table 1).
Table 1: Composition of the Data Frame UNSW-NB15.

The project has been developed using the NumPy, Pandas, and Sklearn Python libraries. Matplotlib and time were used to produce the graphs and compute the time-related statistics.
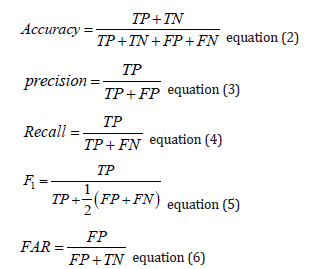
Employed metrics
To evaluate our model, we used the following metrics:
i. Accuracy measures how closely the predictions by a
model match the actual values.
ii. The precision of a classifier measures the proportion of
correctly predicted positive cases out of all cases predicted as
positive.
iii. Recall measures the proportion of correctly predicted
positive cases out of all actual positive cases. F1 combines
precision and recall into a single value, providing a balancedmeasure of how well the model performs. FAR (False Alarm
Rate) is a metric used to determine how many negatives were
classified as positives. In our case, is the number of attacks that
were not discovered by the IDS.
iv. Once the data have been classified, they can be divided
into four groups:
a. True positives (TP);
b. True negatives (TN);
c. False positives (FP);
d. False negatives (FN).
The following is the calculation formula:
As an additional metric, we used time. Classification time and detection time, which are the duration required to train the model and the duration required to categorize a sample using the trained model, respectively, are seldom found in literature. This metric is extremely relevant in our research and for IDSs. In general, the main objective of an IDS is to achieve the highest precision with the lowest time consumption. Long classification and detection time indicates that the complexity of the used model is too high. This is a frequent problem for DL-based methods. We evaluated both classification and detection time to ensure that the proposed model is able to get as close as possible to real-time analysis and that a technical error, such as reset, would not drastically reduce the network security for a long time.
Data preprocessing
Decision Tree and Random Forest provide high accuracy,
but can be prone to problems such as over- fitting. To anticipate
and solve these problems, feature selection was used. The main
advantages of using feature selection are:
a. Avoiding the curse of dimensionality;
b. Avoiding overfitting;
c. Reducing the comprehensive time required for the model
fitting and prediction;
d. Facilitating the model interpretability.
We calculated the importance of features using the property of the Random Forest classifier, and produced the graph in (Figure 3).
Figure 3:Feature importance.

The less meaningful features were cut out to reduce the model’s complexity and improve overall accuracy. Due to the imbalance between the two datasets, the testing and training datasets of the UNSW-NB15 dataset were merged and then split in a 70/30 ratio. Afterwards, a label encoder was applied to text-including features. Label Encoder codifies the values using a numerical encoding, which does not require additional space nor increase the complexity of our model. This operation requires a different encoder for every textual feature. To simulate a more realistic traffic flow, the testing set was divided once again into several batches, each composed of approximately 2000 instances. Other encoding techniques, such as one-hot, were considered. One-hot encoding specifically was considered to ensure that the model did not value the labelled features as ordered sets. What the model showed was not only a slight decrease in its predictive ability, but also a not insignificant increase in classification time. Taking into account these considerations, one hot encoding was immediately excluded.
Classification algorithms
Several classifiers were considered for the ensemble method.
Decision tree, random forest and MLP were chosen because they
could achieve high accuracy in low time. KNN was considered in a
later step. We have developed two engineered systems, based on
ML methods. One operates in real time and is devoted to financial
frauds [16]; the second is called ELENIDS (Ensemble Networkbased
Intrusion Detection System) and is being developed as a
research project as a general method. In both systems, we propose
two distinct models:
i. ELENIDS: This ensemble classifier uses the four selected
classifiers. It provides a more robust decision at the cost of an
increased decision time.
ii. F-ELENIDS: This ensemble classifier uses the DT, Random
Forest, and MLP as classifiers. It provides a less robust decision,
gaining a reduced decision time.
The classifiers were selected from literature, time and accuracy were the main metrics for evaluation in the selection of the classifiers. This is due to the nature of the system. SVM was considered, but the time complexity needed for the multi-feature classification far exceeded the time constraints, so it was rejected. Linear regression, specifically binomial regression, was also considered. This classification algorithm could not achieve the same accuracy values as the selected classifiers in the selected time slot. Both Decision Tree and Random Forest achieved high accuracy in low time. The weight distribution of the two ensemble systems was set, respectively, to (0.25891, 0.29051, 0.25142, 0.01014) for ELENIDS, and (0.25891, 0.29051, 0.25142) for F-ELENIDS. The weight Wc of each classifier c was calculated using the following formula:
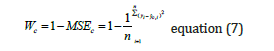
where MSEc is the previously calculated Mean Squared Error of the classifier c, y is the actual value, is the predicted value of the classifier c, and n is the number of instances in the training set.
Decision tree: A Decision Tree (DT) algorithm is a supervised learning method that uses a tree-like structure to classify data or make predictions. To compute decisions in the classifications, this algorithm considers the Shannon entropy of the possible classes before clustering the data considered (Table 2). The complexity related to building a balanced binary tree is
and with a query time of
The results of the comparison can be found in Figure 4.
Table 2: Comparison of Decision Tree strategies.

Figure 4:Decision trees strategies.

Random forest: A Random Forest (RF) Classifier is a ML learning algorithm that uses the ensemble method to classify data with different Decision Trees. In Table 3, the strategies applied to find the optimal Random Forest (Figure 5).
Table 3:Random Forest strategies.

Figure 5:Random forests comparison.

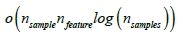
Multilayer perceptron: A Multi-Layer Perceptron (MLP) is a forward neural network. MLP computes its result based on a sequential convolution of the single-layer results. In every layer there is at least one single Perceptron, which is the atomic unit of this neural network. A Perceptron [17], a logic approximation of a human neural nerve, uses perceptron’s to take as an input an array of binary inputs and to produce a binary value. The time complexity [18] T of a MLP can be approximated using the formula in (9).
Given the fact that the number n of neurons for a given problem can be regarded as a constant, the overall complexity is given by:

where n would be the number of neurons in the network.
To find the optimal MLP for our problem, we evaluated the
performance of several MLPs and chose the one that provided
the best results on our dataset. The MLPs were tested with the
following strategies:
a. First MLP
i. hidden layer sizes: (50,);
ii. activation: ’relu’;
iii. solver: ’adam’;
b. Second MLP
i. hidden layer sizes: (100,);
ii. activation: ’relu’;
iii. solver: ’adam’;
c. Third MLP
i. hidden layer sizes: (128,64,);
ii. activation: ’relu’;
iii. solver: ’adam’;
d. Forth MLP
i. hidden layer sizes: (128,64,32,);
ii. activation: ’relu’;
iii. solver: ’adam’;
e. Fifth MLP
i. hidden layer sizes: (100,50,);
ii. activation: ’tanh’;
iii. solver: ’adam’;
f. Sixth MLP
i. hidden layer sizes: (100,);
ii. activation: ’logistic’;
iii. solver: ’sgd’;
For each strategy, a maximum number of iterations mi was applied, with:
The MLPs were tested both before and after applying a standard scaler. Figure 6 & 7 show the results. Based on the results of these experiments, the fifth MLP was selected as optimal MLP and used in the ensemble system.
Figure 6:MLP comparison without the standard scaler.

K-Nearest neighbour: K-Nearest Neighbour (KNN) is a supervised learning classifier which uses proximity to make classifications or predictions about the grouping of an individual data point. KNN suffers greatly from the curse of dimensionality and is highly sensible to feature scaling. The performance of KNN algorithms were measured before the scaler application and after applying different scalers to find the optimal scaler and the optimal number of neighbours. Eventually, MinMaxScaler was found to be the optimal scaler for our problem Figure 7. This approach also led to a reduction in the time used for fitting and classification. To solve the curse of dimensionality, the paper [19] proposes to use the feature importance produced by a Random Forest algorithm to select a subset of features to train and test the KNN. This approach led to a 0.4% increase in accuracy Figure 8 & 9.
Figure 7:MLP comparison with the standard scaler.

Figure 8:KNN without scaler, KNN with standard scaler, KNN with MinMaxScaler, and KNN with MaxAbsScaler.

Figure 9:KNN without scaler, KNN with standard scaler, KNN with MinMaxScaler, and KNN with MaxAbsScaler.

Algorithm
Algorithm 1 IDS (Model)
i. Import the UNSW-NB15 Dataset
ii. Testing set import
iii. Feature selection
iv. Label encoding
v. Ensemble model fit
vi. for Accuracy < Target do
vii. Ensemble model testing
viii. Accuracy Testing
ix. end for
x. Label decoding
xi. Report production
xii. Report saving
Algorithm 2 IDS (Possible System Proposal)
Import the UNSW-NB15 Dataset
2: Feature selection
Label encoding
4: Ensemble model fit
for Accuracy < Target do
6: Ensemble model
predicts Ensemble
model testing
8: Accuracy Testing
end for
10:
while Incoming network traffic do
12: while dim < batchDimmension do
batch <= Traffic
14: end while
Label encoding of the batch
16: Ensemble model predicts
Label decoding
18: Report production
Report saving
20: end while
Documenting the Project
In this section, we document the IDS system development by providing the business model and the user experience.
Documents for Business Process Management (BPM)
In this section, we illustrate the BPM model of the proposed IDS. Figure 10 concerns only the basic structure of the IDS, ignoring all the additional proposed features and the external processes. Specifically, the acquisition phase, which concerns another software, and the post-classification analysis, which requires additional care, are ignored. A more complex model is provided in Figure 11. In order to proceed towards Explainability of our AI-based system, the results of the classification process can be requested both as an Excel file and a CSV. Figure 12 reports one of the results of a tested batch.
Figure 10:Basic IDS model.

Figure 11:Contextualized IDS.

Figure 12:Screenshot of a report from the IDS.

Archimate
We propose two Archimate models. The first one (Figure 13) is based on a NIDS that rests on a distinct architecture in the network, outside the client’s physical devices. This proposal is based on the idea that providing a physical architecture could maintain the same time constraints that were considered, taking advantage of the use of GPUs or several cores. The second model (Figure 14) is a software solution independent of the client’s architecture. This solution, which is the implemented one, has no way to control time efficiency, since it depends on the number of cores in the physical machine.
Figure 13:First model (hardware and software).

Figure 14:Second model (software only).

Result
In this section, we illustrate the results related to the explained metrics. All the calculated statistics were produced using the entire testing dataset. In Table 4 the results are reported, divided by metric and classifier, both for Binary (B) and Multiclass (M) classification. Together with the metrics specified in Section 4.2, the Mean Squared Error (MSE) of each classifier is specified. Figure 15 & 16 diagrams the main computational results (Figure 17 & 18). Present, respectively, the ROC curve calculated for binary and multiclass classification. The ROC curve for multiclass classification was obtained using the OvR (One-vs-Rest) strategy. Both ELENIDS and F-ELENIDS perform better than the individual classifiers in every metric other than time. Still, as shown in Table 4, F-ELENIDS achieves near real-time performance. Achieving near real-time is essential for critical systems like IDSs, where time is crucial for early detection of cyber threats. In terms of FAR, both ELENIDS and F-ELENIDS outclass the individual classifiers in binary classification. In multiclass classification, ELENIDS is comparable with the best classifier, which would be the DT, while F-ELENIDS performs better, but with a trivial margin.
Figure 15:Results.

Table 4:Performance statistics.

Figure 16:Confusion matrices.

Figure 17:Binary ROC curve.

Figure 18:OvR ROC curve.

Concluding Remarks
IDS tools are becoming more and more vital for enterprise security. While the literature has been focusing on signaturebased systems for many years, anomaly-based IDSs are becoming increasingly popular in recent years. One drawback of these systems is that they achieve lower accuracy and higher false alarm rates; the advantage is their agility and the ability to discover unknown attacks. Another downside of IDSs is their computational complexity, which is usually very costly. Hence, finding the optimal model in terms of accuracy, times, and other metrics is complex but needed, also to help reduce costs related to both the development and operation of IDSs. This paper has presented a network-based, hybrid, passive IDS. We have reviewed current works and, in accordance with the literature, have proposed an IDS based on both ML and DL to classify real- world traffic in an efficient, time effective, and precise manner. We have illustrated the IDS model design and implementation. The model combines several classifiers to achieve high precision in binary classification of malicious traffic and high precision, even though lower than the one obtained for binary classification, in multiclass classification for attack type classification. Accuracy, FAR, and time were the most valuable metrics in this research and were both deeply studied and achieved. Explainability was explored in the final output of the model, which consists in .xlsx format file containing five features (Protocol, Service, Duration, Rate, Attack category). This format can be easily changed both in the file format and in the features. Regarding the format, .csv was also explored to reduce the report production time, but we chose to use .xlsx to improve readability.
The illustrated model, which is the classificatory engine of an IDS, is part of a larger system that we are developing. The complete system includes a traffic collector and an UI system that allows the auditor to visualize the excel files produced by the model. Future research is directed to improving the DL features of the model and towards balancing of the hyper parameters. Future research should also reduce the comprehensive time by implementing more timeefficient classifiers (XGBoost Trees,) or using CUDA-based solution.
The DL algorithm, which is a bottleneck in classifying time, is also an issue of future research. We have investigated the optimal MLP for this problem, but other DL algorithms could possibly maintain the same performance reducing the time complexity. This is an open debate in the literature and several statements exist. However, none of the current solutions explores time complexity extensively, as an essential metric would deserve, since research is still directed to the effectiveness of controls. Finally, the proposed model could be implemented with lower efforts by employing a server-based solution, or an on-device program solution.
References
- (2024) Cisco Systems. Global Threat Analysis Report. POLITesi pp. 4-6.
- (2024) Control System Cybersecurity Annual Report. (CS)2 AI-KPMG p. 75.
- Siddharth K, Gagan PK, Chandrababu K, Janardhana RS, Ramdas SB, et al. (2023) A comparative analysis of network intrusion detection using different machine learning techniques. J Contemp Edu Theo Artific Intel 1(1): 1-7.
- Davide A, Genovese A, Vincenzo P (2023) Anomaly-based intrusion detection system for ddos attack with deep learning techniques. In Proceedings of the 20th International Conference on Security and Cryptography SCERYPT 1: 267-275.
- Thomas B (2023) A study on controller area network deep-learning intrusion detection systems. POLITesi Libraries and Archives.
- Yoheswari S (2024) Optimized intrusion detection model for identifying known and innovative cyber-attacks using support vector machine (SVM) algorithms. Journal of Science Technology and Research 5(1): 401-407.
- Pierpaolo D, Andrea B, Sergio S, Qinghe Z, Kaouther G, et al. (2023) Overview on intrusion detection systems design exploiting machine learning for networking cybersecurity. Applied Sciences 13(13).
- Vanlalruata H, Jamal H (2023) DCNNBiLSTM: An efficient hybrid deep learning-based intrusion detection system. Telematics and Informatics Reports 10: 100053.
- Marija M, Vladimir C, Ivan M (2024) Network intrusion detection using weighted voting ensemble deep learning model. In 2024 11th International Conference on Electrical, Electronic and Computing Engineering, pp. 1-6.
- Sridevi S, Prabha R, Narsimha RK, Monica KM, Senthil GA, et al. (2022) Network intrusion detection system using supervised learning-based voting classifier. 2022 International Conference on Communication, Computing and Internet of Things, pp. 01-06.
- Namo J, Mukund S, Kuldeep C, Gobinath R (2023) Intrusion detection system using ensemble technique. In: 2023 3rd International Conference on Innovative Sustainable Computational Technologies (CISCT) Institute of Electrical and Electronics Engineers, pp. 1-5.
- Leslie L, Robert S, Marshall P (1982) The byzantine general’s problem. ACM Trans Program Lang Syst 4(3): 382-401.
- Frank R (1957) The perceptron: A perceiving and recognizing automaton. Report, Project PARA, Cornell Aeronautical Laboratory 85(460-461): 58.
- Diederik PK, Jimmy B (2017) Adam: A method for stochastic optimization. Machine Learning, pp. 1-15.
- Nour M, Jill S (2015) Unsw-nb15: A comprehensive data set for network intrusion detection systems (unsw-nb15 network data set). In 2015 Military Communications and Information Systems Conference (MilCIS), pp. 1-6.
- Gaetano A, Mariagrazia F (2025) Real-time fraud detection using machine learning. In 2025 33rd International Conference on Enabling Technologies: Infrastructure for Collaborative Enterprises (WETICE), pp.1-6.
- Anindya AP, Hamid AM, Afrida H, Handoko B, Triyani H, et al. (2024) Stravens: Sentence transformer voting ensemble for intent classification-based chatbot model. IEEE Access 12: 197187-197200.
- Gursel S, Zhenning G (2014) Complexity analysis of multilayer perceptron neural network embedded into a wireless sensor network. Procedia Computer Science 36: 192-197.
- Shengxin Z (2025) A method for improving knn model performance based on surrogate model fea- ture selection. IPMLP ’25: In Proceedings of the 2nd International Conference on Image Processing, Machine Learning, and Pattern Recognition pp. 171-176.
© 2025 Mariagrazia Fugini. This is an open access article distributed under the terms of the Creative Commons Attribution License , which permits unrestricted use, distribution, and build upon your work non-commercially.
Editor In Chief


.jpg)


Signup for Newsletter

Quick Links
 Editorial Board Registrations
 Submit your Article
 Refer a Friend
 Advertise With Us
Our Recent Edition

.jpg)


Top Editors


.jpg)


.bmp)
.jpg)
.png)
.jpg)


.jpg)


.png)

.png)


.png)


Financial Support

Sponsors

Latest e-Books

Latest Video

 a Creative Commons Attribution 4.0 International License. Based on a work at www.crimsonpublishers.com.
Best viewed in
a Creative Commons Attribution 4.0 International License. Based on a work at www.crimsonpublishers.com.
Best viewed in