- Submissions

Full Text
Open Access Biostatistics & Bioinformatic
Mining Online Author’s Publication to Report the Core Research Domain with PubMed MeSH Terms: a Systematic Review for a Journal
Chien Cheng Huang1,2 and Tsair Wei Chien3,4*
1Chang Jung Christian University, Taiwan
2Chi-Mei Medical Center, Taiwan
3Department of Medical Research, Chi-Mei Medical Center, Taiwan
4Department of Hospital and Health Care Administration, Chia-Nan University of Pharmacy and Science, Taiwan
*Corresponding author: Tsair Wei Chien, Department of Hospital and Health Care Administration, Chia-Nan University of Pharmacy and Science, Tainan, Department of Medical Research, Chi-Mei Medical Center, 901 Chung Hwa Road, Yung Kung Dist, Tainan 710, Taiwan
Submission: April 16, 2018;Published: April 25, 2018

ISSN: 2578-0247
Volume1 Issue3
Abstract
Background: Identifying an author’s research domain (RD) using MeSH (Medical Subject Headings) terms is essential for a journal’s development and its readership, but no journal uses mining online methods or social network analysis (SNA) to extract journal publication information to report an author’s contributions.
Objective: To select prestigious authors and papers that have contributed most to a journal, we retrospectively (1) calculated an SCI (Science Citation Index) journal’s most recent impact factors (IF) and (2) used graphical representations that include MeSH terms of RDs for authors and journals.
Methods: We collected 2,053 papers published between July 1, 1999, and April 3, 2017, in the Journal of Medical Internet Research (JMIR) and cited by 673 journals, for which we also collected annual IFs for 394 SCI journals, including the JMIR. The prestigious authors and JMIR papers based on the weight of the 5-year SCI IFs from 394 cited-by papers in 2015. The JMIR core aims and scope are presented using major MeSH terms based on their corresponding average weighted scores. Social network analysis was used to create a graphical RD pattern for JMIR, and its prestigious papers and authors.
Results: All JMIR 5-year IFs have not been less than 2.9 for the past 14 years. The authors who contributed most to JMIR in a number of publications and weighted citations are Gunther Eysenbach and My Hua. Their cohesion measures (ranging from 0 to 1.0) to JMIR are 34% and 5.7%, respectively. The highest prestige weighted contribution among papers published in JMIR is the one (PMID: 23567935 /DOI: 10.2196/jmir.2324) with a cohesion measure of 4.5%.
Conclusion: An author’s research domain is required with an essential and graphical presentation along with the author’s submission to the target journal. Journal editors also look forward to evaluating an author’s research domain and the submitted paper’s cohesion measure for the journal.
Keywords: Research domain; MeSH terms; Cohesion measure for a journal; Social network analysis; Science Citation index; Impact factor
Abbreviations: BC: Betweenness Centrality; CR: Concentration Ratio; EDA: Exploratory Data Analysis; HHI: Herfindahl Hirschman Index; IDA: Initial Data Analysis; IF: Impact Factor; JCR: Journal Citation Reports; JMIR: Journal of Medical Internet Research; MeSH: Medical Subject Headings; NLM: National Library of Medicine; RD: Research Domain; SCI: Sciences Citation Index; SNA: Social Network Analysis; SSCI: Social Sciences Citation Index; VBA: Visual Basic for Applications
Background
Keywords or short phrases can assist indexers to cross-index an article of interest. However, author-defined keywords are not as common or accurate as MeSH (medical subject headings) terms used by researchers in search of bioinformatics [1,2], but authors are often required by their target journal to provide three to ten keywords that represent the main content of the article for an article [3-7]. MeSH terms, developed by the National Library of Medicine (NLM), are manually assigned to each document by biomedical subject specialists based on the context of the whole document [2]. Usually, MeSH processing is not finished until at least a half year after a paper published in Medline, but new MeSH vocabulary is annually added. MeSH terms contain high-density and well-defined information the whole article which cannot be inferred merely by reading the title and the abstract. Our review of the relevant literature revealed no studies that have applied MeSH terms to identify author research domains (RDs). Our online mining approach will improve the ability of authors to objectively report their RDs when using increasingly large and complex PubMed data. Scientific publication is one of the objective measurements to evaluate the achievements of a medical specialty or discipline [8]. Many journals are included in the Thomson Reuters Science Citation Index (SCI). Since the advent of bibliometrics, citation analysis has been widely used in many disciplines to evaluate the influence of academic articles [9-17].
Social network analysis (SNA) [18-20] is used to define authors, journals, or papers as the “nodes” of a network connecting to another node with a relationship represented as an edge [21,22]. Several algorithms and measures have been developed and used with SNA to graphically explore data. When our aim is set to investigate whether any author or paper most fits the research domain of a journal and its scope within the journal’s MeSH network, centrality measures can be applied [22], which means that the core subject can be analyzed using the centrality measure [23,24]. We aimed to report prestigious authors, and prestigious papers contributed to a journal, both of which we can use to retrospectively (i) calculate a journal’s past SCI IFs and (ii) show graphical representations of the RD for the author and the journal within the network of MeSH terms.
Methods
Data sources
We downloaded 2,053 abstracts based on the journal of medical internet research (JMIR) from the US NLM of Health (Pubmed. com) since 1999(July 1st) to 2017(April 3th), Their corresponding 1st authors, MeSH terms, and cited-by papers along with the journal names were extracted from the online website using an author-made MS Excel VBA (visual basic for applications) module (Multimedia 1) A total of 1,945 cited-by journals were obtained from the JMIR website (Multimedia 2) in which 1,055 journals were included in Thomson Reuters in line with the 2015 5-year SCI impact factors from JCR. A concentration ratio (CR4) was computed according to the top four market shares [i.e., ratio=top four divided by all the proportions (=1.0)]. CR4=0 represents no concentration, indicating perfect competition or at the very least monopolistic competition. Similarly, the four largest firms (here, the topic) in the industry would not have any significant market share. CR4<50% represents low concentration, indicating that the category ranges from perfect competition to an oligopoly. A CR4 value of 50%-80% represents medium concentration, suggesting an oligopoly. A CR4 value of 80%-100% represents high concentration, indicating that the category ranges from an oligopoly to monopoly. A CR4 value of 100% implies total concentration, indicating an extremely concentrated oligopoly or a monopoly. The CR4 will be applied to the following networks for examining author core domain with MeSH terms based on the Betweenness centrality (BC).
The first aim on the JMIR annual impact factors
The Journal 5-year Impact Factor in a year (e.g, 2015) is defined as the number of citations to articles published in the previous five years (e.g., 2010-2014) including the journal selfcites, divided by the number of articles published during that time [25,26]. We calculated the eligible SCI citation number for each JMIR papers, summed the total citation number in the previous 2 and five years, and divided by the published number in the specific period. Fourteen impact factors from 2001 and 2004 to 2017 were computed for 2-year and 5-year impact factors, respectively.
The second aim of the weighted scores of the JMIR papers
We applied the weight (i.e., referring impact factors of cited-by papers) and un-weighted (i.e., just computing citation count of SCI cited-by papers) to the paper. The paper weighted score is a metric of excellence and a contribution (or a prestige) truly to the journal, In this study, we excluded those cited-by papers with JMIR selfcites to emphasize the paper on the 100% prestige from excellent outside journals in the author and paper contribution analysis.
The third aim of the most productive author in JMIR
The most productive author is selected from the number of published papers in JMIR. The author research domain was drawn using the SNA visualization representation.
The fourth aim of the weighted and un-weighted scores of the JMIR authors
Similar to the weighted scores(i.e., the adjusted by the journal impact factor) used for the best paper selection, we selected the first author by the measures of weighted and un-weighted score based on their cited-by papers excluding the JMIR self-cites.
The fifth aim on the MeSH terms for presenting JMIR aims and scope
Using the weighted score including JMIR self-cites, we obtained the score for each major MeSH terms (i.e., with a symbol of asterisk) in an article and then average them if any one exists in different JMIR papers. Secondly, any possible pair of MeSH in an article was linked together without duplication (e.g., either A->B or B->A will be selected once and only). Thirdly, the combined weighted score was generated by the multiplication of the two originated weighted score averaged within a similar pair (e.g., either A->B or B->A). The total combined weighted score will be computed for each pair of linkage. Finally, the top 100 combined weighted scores were selected and applied to the social network analysis. Pajek SNA software [27] was performed to draw the pattern of JMIR aims and scope with MeSH terms. Interested authors are recommended to see Multimedia 3 & 4).
An author or paper fitting not journal’s scope with cohesion score
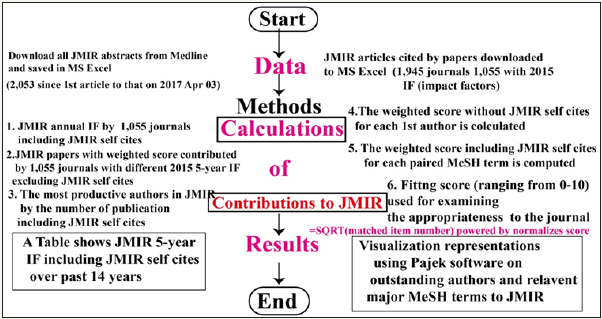
Betweenness centrality expresses a focus on the bases of how often a specific node is found on the shortest route between each pair of nodes in the network [28]. We normalized betweenness centrality yielded by Pajek software for each actor (i.e., MeSH term in this example). The higher Betweenness of a weight score means the central and important extent more to the network. Any author’s research domain (or a paper domain) with the top 100 major MeSH terms can be used for matching the journal’s MeSH terms. The cohesion measure ranging from 0 to 1.0 can be computed by the topic portion explained by the total journal topics within JMIR major MeSH terms with their BC weighted scores. Figure 1 presents the study flowchart. The JMIR MeSH trend across years is present based on the relative frequency of the topic (i.e., term) appearance. The bubble size shows the strength of the topic in comparison with others’ frequency.
Figure 1 Flow chart of this study.
Results
The first aim of the JMIR annual impact factors
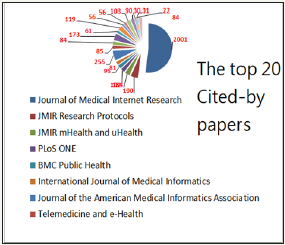
The 2 and 5-year impact factors for JMIR are present in Table 1. We can see that all the JMIR 5-year impact factors are not less than 3.0 since 2004. All the JMIR 2-year impact factors are not less than 1.78 since 2001. The number of 5-year impact factors is greater than that of 2-year impact factor in the number of years (i.e., 8/6=1.33) since 2004. The reasons for the low impact factor in 2017 are that (i) the data were early ended on 2017 Apr. Three earlier than the JCR report released for its report at the mid-June of the year, and (ii) some SCI papers were perhaps not included in this study. The concentration ratio (CR4: top four market share to all 1,055 citedby journals) is 24.46 %, indicating a low centrality is held ranging from perfect competition to an oligopoly. JMIR accounts for a large part of citation in the top 20 SCI cited-by journals see Figure 2.
Table 1: JMIR 5-year impact factor (IF) annually calculated.
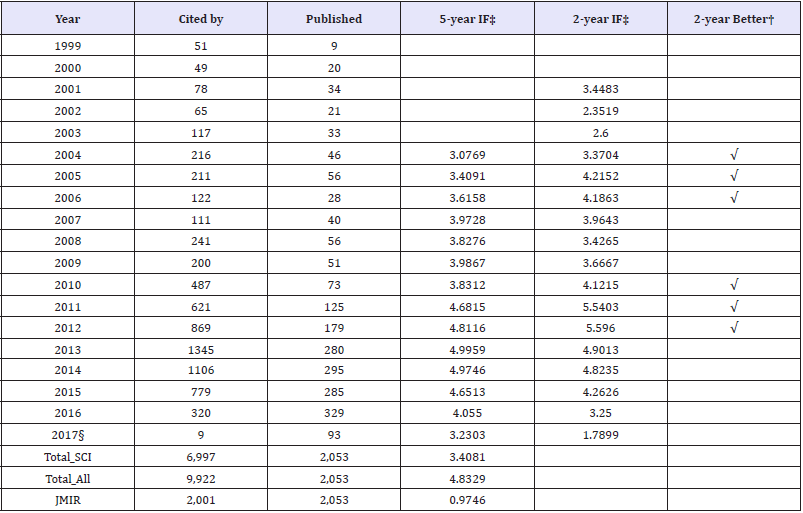
Note. ‡IF: Impact Factor; †when the value in 2-year IF is greater that in 5-year IF § denotes publication data collected until 2017 Apr 03.
Figure 2: Top 20 SCI cited-by journals to JMIR.
The most prestigious paper (=108.52 with a weighted score) is the one [29] entitled “Works citing “Health-Related Effects Reported by Electronic Cigarette Users in Online Forums” online published on 2013 Aug. 08 at http://www.jmir.org/article/citations/2324. It has two major MeSH terms (telemedicine and internet) cited by 58 papers in which 50 were SCI papers. The cohesion measure fitting JMIR is 4.5% with two major MeSH terms (i.e., internet and telemedicine). Two authors, My Hua, Mina Alfi and Prue Talbot, contributed to this paper.
The third aim of the most productive author in JMIR
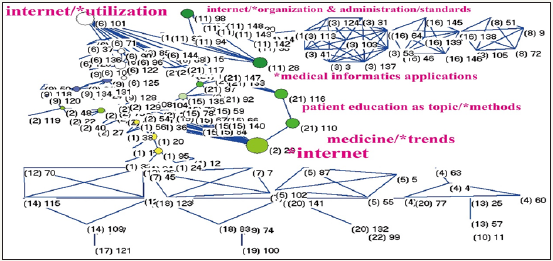
Author Gunther Eysenbach earns the most productive prestige with 27 papers published in JMIR and 20-SCI papers including JMIR papers. His cohesion measure fitting JMIR is high at 34% with 25 major MeSH terms. His research domain (Figure 3) is represented by the MeSH terms extracted from 20 papers downloaded from Pubmed.com. The strongest MeSH (with a high Betweenness centrality) shown in Figure 3 is internet in Cluster 2, followed by internet/utilization in Cluster 6, internet/organization & administration/standards in Cluster 11, and patient education as topic/methods in Cluster 21, see the name in red with the cluster number in parentheses. The CR4 is 43.91%, indicating the author core research domain is a little bit of an oligopoly (i.e., interdiscipline not centralized on a few domains).
Figure 3: Research domain of the author Gunther Eysenbach using MeSH terms to display from the 20 published papers in the Pubmed library.
The fourth aim of the weighted scores of the JMIR authors
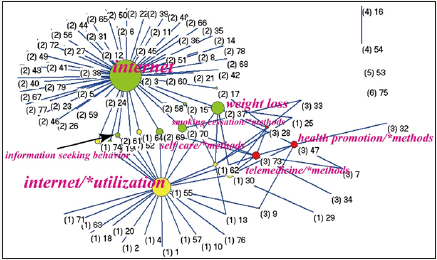
The author Hua [29] has a high weighted score (=108.52). A total of 30 papers cited by other SCI papers (excluding JMIR) were found. Hua [29] is the first author of the most contribution paper in JMIR, who published one and the only one paper in JMIR till now. Using his MeSH terms from the six published papers downloaded from Pubmed library to draw his research domain, we can see in Figure 4 that his cohesion measure is 5.7% with 3 terms fitting JMIR MeSH terms, and the MeSH of nicotine/administration & dosage is bridging the two clusters 2 and 4 on the left-top corner. The CR4 is 100% including the only one major MeSH term of nicotine/administration & dosage and internet, indicating author Hua’s [29] core feature is a monopoly. Using the top 100 MeSH terms (i.e., 79 unique MeSH terms) to draw the pattern of JMIR core scope is easily classified in Figure 5. We can see the core MeSH term is internet on the left top corner in Cluster 2. Others are internet/ utilization in Cluster 1 and telemedicine/methods, and health promotion/methods are shown in Cluster 3. The CR4 is 79.82%, indicating the JMIR core scope is dominant in a range from an oligopoly to monopoly. The JMIR cohesion measure fitting himself is undoubtedly at 100% with 79 major MeSH terms.
Figure 4: Research domain of the author Hua [29], MY using MeSH terms to display from the six published.
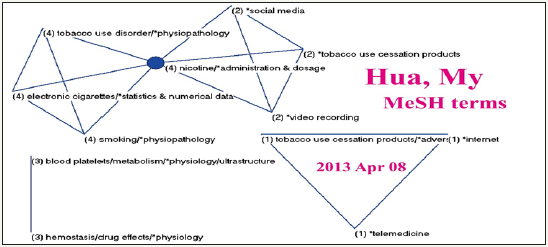
Figure 5: Citing JMIR Journals altogether display the visualization domain of JMIR.
Trends in cohesion measures and JMIR topics over years
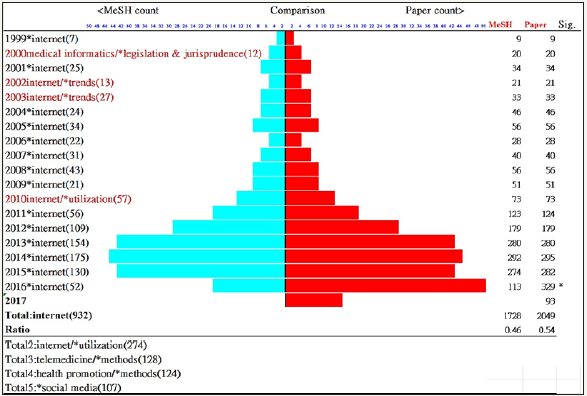
Trends in cohesion measures, as well as counts of papers and MeSH terms, are shown in Figure 6. When excluding data in 2016 due to uncompleted MeSH terms. The least correlation coefficient between cohesion and the paper count was improved from 0.77 to 0.44. We can see the trends on average cohesion measures for all JMIR papers are held on the way beyond 2.5% since 2005. It is interesting to see the JMIR core topics over the years in Figure 7. There are two stages from the beginning legislation and internet trends (before 2004) to the internet in recent 12 years. The frequency occurred annually is numbered in brackets. The symbol in the last column denotes that the two counts presents significantly different when the lower portion added by 1.96* pooled SE is less than 0.5 (i.,e. a half probability for a pair count comparison).
Figure 6: Trends of cohesion measures for JMIR over years.
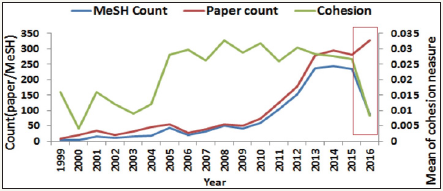
Figure 7: Trends in topics for JMIR over years.
Discussion
Key findings
We demonstrated the computation of 2 and 5-year impact factors for JMIR over past 14 years. The most productive author is Gunther Eysenbach with 27 papers published in JMIR and with a cohesion measure 34%. The most prestigious JMIR paper [29] is at http://www.jmir.org/article/citations/2324. The most contribution author with a high weighted score (=108.52) is Hua [29]. His cohesion measure fitting JMIR domain is 5.7%. The SNA visualization representations help us show that JMIR core topic is the internet.
What this adds to what was known
There are 27,839 papers with the keyword MeSH in title/ abstract when searching Pubmed database in 2017 May 14. Only two papers [1,2] were incorporated MeSH into social network analysis to explore interesting knowledge. Citation analysis has also been done in many disciplines [10-17]. Most of them summarized the citation strength of highly cited authors or analyzed the citation strength of productive authors within a topic over past years. None included Pubmed MeSH terms to report the research domain with a graphical presentation for an author or a paper, or a journal. Many journals are always concerning their Impact Factors annually released by the Journal Citation Reports (JCR). None puts efforts on drilling down contributions to authors or papers. We explored a way combing SNA and MeSH terms to report author research domain and journal core feature. It is different from using SCI category to define core journal sets [26], but somewhat similar to those authors [30,31] considering cited-by papered indexed with terms from the MeSH medical informatics hierarchy. After all, their sets of journals included all those indexed by the NLM with MeSH terms) for Index Medicus, which were indexed by the International Yearbook of Medical Informatics, and several other selected journals from standardized lists and considered opinion [26]. Combining SNA and MeSH terms to report author research domain and journal core feature is novel and promising in the future.
What it implies and what should be changed
In statistics, exploratory data analysis (EDA) is an approach to analyze data for summarizing their main characteristics, often with visual methods. Thereby EDA is for seeing what the data can tell us beyond the formal modeling or hypothesis testing usage [32]. The information showing from Figure 3-5 can help us know the image of author and journal using the MeSH terms. Furthermore, journal editors and reviewers can focus a little bit effort on the author research domain before reviewing author’s paper. The aims and scope of a journal can be examined by both core author domain and fitting journal score in future. Furthermore, highly prestigious authors with one picture demonstrating their spectacular research domain are encouraged and required to summit papers for increasing the possibility of SCI impact factor in future, especially their research domain fitting into the journal aims and scope.
What is most MeSH term closely associated with JMIR domain is unknown before we completed this study (Figure 5)? An apocryphal story often told to illustrate data mining concepts is about beer and diaper sales. It usually goes along with both beer and diaper sales which were strongly correlated [33-35]. We, like some studies studying co-authorship relations within and between papers [36- 38], were interested in using social network analysis (SNA) [18-20] to analyze keywords related to the journal’s aims and scope. We found that the closest MeSH term related to the internet in JMIR papers is Weight Loss in Figure 5. Other JMIR features are those interet/*utilization and telemedicine/*methods in other clusters. We are confidently looking forward to seeing more authors and combining the two of SNA and MeSH for exploring journal scope in the future.
Strengths of this study
We demonstrated several videos in Multimedia to interested readers (i) how to extract such data from the US NLM(Pubmed. com), (ii) how to organize research data to congruent with study purpose, and (3) how to perform Pajek SNA software and calculate the cohesion measure to the journal. Future researchers are suggested to imitate (or even to emulate) this approach to other studies if combing SNA and MeSH terms. It is somewhat different from those search and extraction methods from Pubmed database [1,2] and those just applying SNA to a topic of interest [36-38]. We used SNA to analyze MeSH terms associated with the journal, papers, and authors. It is also different from others applying to health report issues [39,40]. In Figure 5 we can see that JMIR is enclosed with the keyword “internet.” With a similar method, we can investigate other journals and report their concentration ratios. If no any core journal feature exists in its network, it means no any special image (or say product position) in an author mind. Exploratory data analysis is much more different from initial data analysis (IDA)[41] which focuses more narrowly on checking assumptions required for model fitting and hypothesis testing, and handling missing values and making transformations of variables as needed. In contrast, exploratory data analysis encompasses IDA to help us making policy and strategy in management.
Limitations and future studies
There are several limitations in this study. First, all data were extracted from Pubmed.com. Some papers without any MeSH term are included in this study due to lagging behind manually assigned to each document by biomedical subject specialists based on the context of a whole document [2], which will affect the results and inference making for this study. Second, there are many algorithms used for SNA. We merely applied separation components showing in Figures. Any changes made along with algorithm used will present different pattern and judgment. Third, we applied concentration ratios as an index to represent the core feature of the journal or the author. The definition of the concentration ratio does not use the market shares of all the MeSH terms in the studied network. The selection of the top 100 paired MeSH terms, the top 4 to compute the concentration ratio, and the Betweenness centrality scores of SNA will be biased when comparing to other criteria. The concentration ratios provide a sign of the oligopolistic nature in a network and indicate the degree of competition. The Herfindahl index [42] (also known as Herfindahl-Hirschman Index, or HHI) providing a complete picture of industry concentration than does the concentration ratio is recommended to future studies.
There are several limitations in this study. First, all data were extracted from Pubmed.com. Some papers without any MeSH term are included in this study due to lagging behind manually assigned to each document by biomedical subject specialists based on the context of a whole document [2], which will affect the results and inference making for this study. Second, there are many algorithms used for SNA. We merely applied separation components showing in Figures. Any changes made along with algorithm used will present different pattern and judgment. Third, we applied concentration ratios as an index to represent the core feature of the journal or the author. The definition of the concentration ratio does not use the market shares of all the MeSH terms in the studied network. The selection of the top 100 paired MeSH terms, the top 4 to compute the concentration ratio, and the Betweenness centrality scores of SNA will be biased when comparing to other criteria. The concentration ratios provide a sign of the oligopolistic nature in a network and indicate the degree of competition. The Herfindahl index [42] (also known as Herfindahl-Hirschman Index, or HHI) providing a complete picture of industry concentration than does the concentration ratio is recommended to future studies.
Conclusion
Author’s research domain is required to submit to a target journal with his/her manuscript. The journal editor is also expected to evaluate author’s cohesion measure to the journal and his/her core research domain with MeSH terms to display.
References
- Yao Q, Liu PH, Ma FC, Yao L, Zhang SJ (2013) Global informetric perspective studies on translational medical research. BMC Med Inform Decis Mak 13: 77.
- Lu Y, Figler B, Huang H, Tu YC, Wang J, et al. (2017) Characterization of the mechanism of drug-drug interactions from PubMed using MeSH terms. PLoS One 12(4): e0173548.
- International Committee of Medical Journal Editors (1997) Uniform requirements for manuscripts submitted to biomedical journals. N Engl J Med 336: 309-316.
- IEL (Inderscience Enterprises Ltd) (2015) Keyword requirements.
- Nadim A (2005) How to write a scientific paper? Ain Shams Journal of Obstetrics and Gynecology 2: 256-258.
- Rhodes W (2010) Guest editorial: The abstract as a marketing tool. Optical Engineering 49: 7.
- Day R, Gastel B (2006) How to write and publish a scientific paper. (6th edn), Westport, Greenwood Press, Connecticut, USA.
- Chang HT, Lin MH, Hwang IH, Chen TJ, Lin HC, et al. (2017) Scientific publications in gastroenterology and hepatology in Taiwan: An analysis of Web of Science from 1993 to 2013. J Chin Med Assoc 80(2): 80-85.
- Hu SK, Huang J, Hong WD, Du XJ, Jin R, et al. (2017) The 50 most-cited articles in gastroenterology and hepatology from mainland China. Pak J Med Sci 33(1): 215-220.
- Coelho DH, Edelmayer LW, Fenton JE (2014) A century of citation classics in otolaryngology-head and neck surgery journals revisited. Laryngoscope 124(6): 1358-1362.
- Baltussen A, Kindler CH (2004) Citation classics in critical care medicine. Intensive Care Med 30(5): 902-910.
- Brandt JS, Downing AC, Howard DL, Kofinas JD, Chasen ST (2010) Citation classics in obstetrics and gynecology: the 100 most frequently cited journal articles in the last 50 years. Am J Obstet Gynecol 203(4): 355.e1-e7.
- O’Sullivan KE, Kelly JC, Hurley JP (2015) The 100 most cited publications in cardiac surgery: a bibliometric analysis. Irish J Med Sci 184(1): 91-99.
- Kelly JC, Glynn RW, O’Briain DE, Felle P, McCabe JP (2010) The 100 classic papers of orthopaedic surgery: a bibliometric analysis. J Bone Joint Surg Br Vol 92(10): 1338-1343.
- Kavanagh RG, Kelly JC, Kelly PM, Moore DP (2013) The 100 classic papers of pediatric orthopaedic surgery: a bibliometric analysis. J Bone Joint Surg Am 95(18): e134.
- Pagni M, Khan NR, Cohen HL, Choudhri AF (2014) Highly cited works in radiology: the top 100 cited articles in radiologic journals. Acad Radiol 21(8): 1056-1066.
- Cao F, Li J, Li A, Fang Y, Li F (2012) Citation classics in acute pancreatitis. Pancreatology 12(4): 325-330.
- Landon BE, Keating NL, Barnett ML, Onnela JP, Paul S, et al. (2012) Variation in patient-sharing networks of physicians across the United States. JAMA 308(3): 265-273.
- Barnett ML, Christakis NA, O’Malley J, Onnela JP, Keating NL, et al. (2012) Physician patient-sharing networks and the cost and intensity of care in US hospitals. Med Care 50(2): 152-160.
- Landon BE, Onnela JP, Keating NL, Barnett ML, Paul S, et al. (2013) Using administrative data to identify naturally occurring networks of physicians. Med Care 51(8): 715-721.
- Takahashi Y, Ishizaki T, Nakayama T, Kawachi I (2016) Social network analysis of duplicative prescriptions: One-month analysis of medical facilities in Japan. Health Policy 120(3): 334-341.
- Sadoughi F, Valinejadi A, Shirazi MS, Khademi R (2016) Social network analysis of Iranian researchers on medical parasitology: A 41 Year Coauthorship survey. Iran J Parasitol 11(2): 204-212.
- Osareh F, Khademi R, Rostami MK, Shirazi MS (2014) Co-authorship network structure analysis of Iranian researchers’ scientific outputs from 1991 to 2013 based on the Social Science Citation Index (SSCI). Collnet J Scientometr Info Manag 8(2): 263-271.
- Liu X, Bollen J, Nelson ML, Van Sompel H (2005) Co-authorship networks in the digital library research community. Info Process Manag 41(6): 1462-80.
- Institute for Scientific Information (1993) 1993 SCI Journal Citation Reports. Institute for Scientific Information, Philadelphia, USA, Vol. 10.
- Theodore AM, Katherine WM (1998) The structure of medical informatics journal literature. J Am Med Inform Assoc 5(5): 448-466.
- deNooy W, Mrvar A, Batagelj V (2011) Exploratory social network analysis with pajek: revised and expanded. (2nd edn), Cambridge University Press, New York, USA.
- Badar K, Hite JM, Badir YF (2013) Examining the relationship of coauthorship network centrality and gender on academic research performance: the case of chemistry researchers in Pakistan. Scientometrics 94(2): 755-775.
- Hua M, Alfi M, Talbot P (2013) Health-related effects reported by electronic cigarette users in online forums. J Med Internet Res 15(4): e59.
- Sittig DF, Kaalaas SJ (1995) A quantitative ranking of the biomedical informatics serials. Methods Inf Med 34(4): 397-410.
- Sittig DF (1996) Identifying a core set of medical informatics serials: an analysis using the MEDLINE database. Bull Med Libr Assoc 84(2): 200- 204.
- Andrienko N, Andrienko G (2005) Exploratory analysis of spatial and temporal data. A Systematic Approach, Springer, Germany.
- Domingos P (2012) A few useful things to know about machine learning. Communications of the ACM 55(10): 78-87.
- Verhoef PC, Kooge E, Walk N (2016) Creating value with big data analytics: making smarter marketing decisions. Routledge, London, UK.
- Power DJ (2002) What is the “true story” about data mining, beer and diapers? DSS News 3(23).
- Farashbandi ZF, Geraei E, Siamaki S (2014) Study of co-authorship network of papers in the Journal of Research in Medical Sciences using social network analysis. J Res Med Sci 19(1): 41-46.
- Sadoughi F, Valinejadi A, Shirazi MS, Khademi R (2016) Social network analysis of Iranian researchers on medical parasitology: A 41 year coauthorship survey. Iran J Parasitol 11(2): 204-212. 38. Osareh F, Shirazi SM, Khademi R (2014) A survey
- Osareh F, Shirazi SM, Khademi R (2014) A survey on co-authorship network of Iranian researchers in the field of pharmacy and pharmacology in web of Science during 2000-2012. J Health Admin 17(56): 33-45.
- Zhao K, Wang X, Cha S, Cohn AM, Papandonatos GD, et al. (2016) A multi relational social network analysis of an online health community for smoking cessation. J Med Internet Res. 18(8): e233.
- Stewart SA, Abidi SS (2012) Applying social network analysis to understand the knowledge sharing behaviour of practitioners in a clinical online discussion forum. J Med Internet Res. 14(6): e170.
- Andrienko N, Andrienko G (2005) Exploratory analysis of spatial and temporal data. A Systematic Approach. Springer, Germany.
- Liston HC, Pilkington A (2004) Inventive concentration: an analysis of fuel cell patents. Science and Public Policy 31(1): 15-25.
- Borgatti SP, Everett MG, Freeman LC (2002) Ucinet for windows: software for social network analysis. MA: Analytic Technologies, Harvard, USA.
- Bastian M, Heymann S, Jacomy M (2009) Gephi: an open source software for exploring and manipulating networks. International AAAI Conference on Weblogs and Social Media, USA.
Multimedia
1. Multimedia 1
Mining online author’s Publication from Medline and JMIR websites
2. Multimedia 2
Organizing data using an author-made MS Excel module
2. Multimedia 2
Mining online author’s Publication from Medline and JMIR websites
3. Multimedia 3
Computing Betweenness centrality using Pajek SNA software
4. Multimedia 4
How to generate a cohesion measure for a journal scope
© 2018 Tsair Wei Chien. This is an open access article distributed under the terms of the Creative Commons Attribution License , which permits unrestricted use, distribution, and build upon your work non-commercially.
 a Creative Commons Attribution 4.0 International License. Based on a work at www.crimsonpublishers.com.
Best viewed in


.jpg)


 Editorial Board Registrations
 Submit your Article
 Refer a Friend
 Advertise With Us
.jpg)


.jpg)


.bmp)
.jpg)
.png)
.jpg)


.jpg)


.png)

.png)


.png)


