- Submissions

Full Text
Novel Techniques in Nutrition and Food Science
Quality of Coffee Beverage Fermented by Commercial and Wild Microorganisms: Compared by Physicochemical and Sensory Analyses
Sandy R Dias1, Cintia da Silva Araújo2, Leandro L Macedo3, Flávia de Abreu Pinheiro3 and Wilton S Cardoso3*
1Federal University of Lavras, Department of Food Science, Brazil
2Federal University of Espírito Santo, Department of Food Engineering, Brazil
3Federal Institute of Espírito Santo, Department of Food Science and Technology, Brazil
*Corresponding author:Wilton S Cardoso, Federal Institute of Espírito Santo, Department of Food Science and Technology, Brazil
Submission: June 06, 2024;Published: September 05, 2024

ISSN:2640-9208Volume8 Issue1
Abstract
The controlled fermentation of coffee improves the quality of the beverage. This study aimed to evaluate the quality of Arabica coffee using inoculants of both commercial and wild microorganisms for wet coffee fermentation and to assess the final quality of the fermented coffees using these different starter cultures. The musts were evaluated for reducing sugar content using the DNS method over fermentation time and the coffee beans (green and roasting) were assessed for soluble protein content using the Bradford method, reducing sugars and sensory quality analysis through cupping tests. The reducing sugar content of the musts decreased after 24 hours of fermentation for all treatments, except for the commercial yeast Saccharomyces cerevisiae Safbrew T-58, where this parameter was statistically equal after 48 hours of fermentation, reaching 0.01%. After fermentation, the green beans showed similar levels of soluble proteins and total reducing sugars for all treatments, with minimally significant differences observed. The soluble protein content decreased (on average 82.2%), while the reduced sugar content increased (on average 76.2%) after coffee roasting. All treatments were classified as specialty according to the SCA, although no significant differences were observed. Fermentation using the commercial yeast S. cerevisiae Safbrew T-58 obtained the highest score (84.7 pts). Therefore, it was found that wet fermentation using microorganisms isolated from coffee and commercial ones improved coffee quality and presented different sensory descriptors in the different treatments.
Keywords:Arabica coffee; Coffee quality; Starter culture; Isolated microorganisms
Introduction
Coffee is a globally consumed product. In recent years, consumers have been faced with a market offering a wide range of this product, aiming to please various tastes, from sweeter and lighter beverages to stronger and more robust ones [1]. The pleasant aroma and potential beneficial effects on the human body are among the main factors contributing to the increased consumption of coffee [2,3] The pursuit of quality coffee has sparked interest from both producers and consumers. However, it is important to emphasize that coffee quality is a multifactorial parameter and is closely related to various factors such as geographical location, genotype, presence/absence of defects, fruit maturity, chemical composition and processes of fermentation, drying, roasting, storage and beverage preparation [4,5]. Controlled coffee fermentation plays a crucial role in producing high-quality coffees. There are different coffee processing methods, including wet, dry and semi-dry. In the wet process, peeled coffee beans are submerged in water tanks for fermentation, which typically lasts between 24 to 48 hours. During peeling, the husk and pulp are removed, leaving only the mucilage adhered to the beans [6,7]. To produce high-quality coffee beverages, fermentative processes have been widely employed. It is expected that there will be a change in coffee quality due to the metabolites produced by the present microorganisms. However, spontaneous and uncontrolled fermentations can result in coffees with variable and inconsistent qualities [3]. In this sense, there has been an increase in the number of studies employing previously isolated microorganisms, aiming to control fermentation and increase beverage quality [8-12,7]. Additionally, the use of isolated microorganisms can contribute to reducing fermentation time and product standardization [8]. Although fermentation in wet processing post-harvest coffee processing is widely used, resulting in a quality product, it is often performed in an uncontrolled manner, leading to unpredictable results. Thus, the use of microorganisms previously isolated from coffee may represent a way to identify those most promising for a controlled process [10]. In this context, the present study aimed to evaluate the impact of fermentation carried out by different starter cultures, both previously isolated from coffee and commercial, on the physicochemical parameters of fermentation must, green and roasted fermented beans, as well as on the sensory quality of the resulting beverage.
Material and Methods
Coffee beans
The coffee beans of the Catuaí Red variety were manually harvested at the cherry stage of ripeness on a rural property located at an altitude of 900 meters, belonging to the municipality of Venda Nova do Imigrante (20° 25’21.3”S and 41° 10’09.3” W), in the state of Espírito Santo, Brazil. The fruit collection took place in July 2018.
Commercial microorganisms
The yeasts Saccharomyces cerevisiae Safbrew T-58 (Fermentis) and S. cerevisiae Craft Series (LALVIN) and the lactic acid bacteria Lactobacillus acidophilus (Prolive-Aché), are commercial and were acquired from specialized websites that sell supplies for craft beers and the L. acidophilus was purchased from a local pharmacy.
Prospecting of wild microorganisms
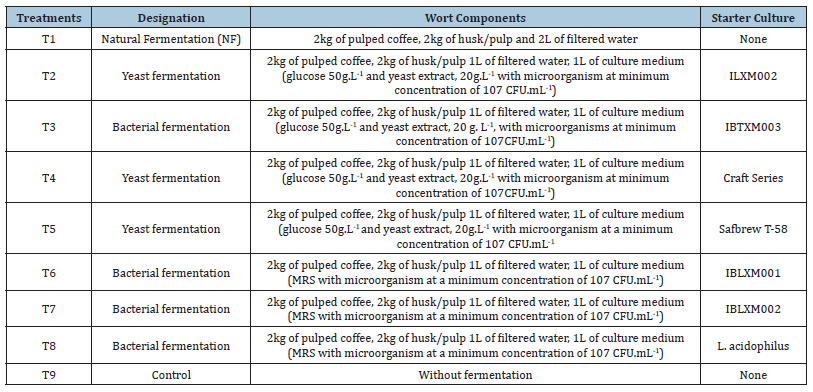
Twenty microorganisms isolated from coffee beans were multiplied and subsequently lyophilized. For the isolation of microorganisms, the methodology described by Vilela (2009) was adopted with modifications. Samples of coffee fruits were randomly chosen and homogenized with 180mL of sterile peptone water (0.1% bacteriological peptone) for 5 minutes manually. From this extract, serial dilutions of 10-1 to 10-5 were made. The total bacteria present in the samples were enumerated using an aliquot of 0.1mL in AN medium (Nutrient Agar) by the surface spreading method. Lactic acid bacteria were enumerated in the MRS medium (Man, Rogosa and Sharpe). AN and MRS plates were incubated at 28 and 37 °C for 48 hours, respectively. To evaluate the growth of yeasts and filamentous fungi, DG18 and MEA media were used. Plates were incubated at 28 °C and evaluated after 24 and 48 hours for bacteria and yeasts and 7 days for filamentous fungi Vilela (2009). Isolation was conducted in triplicate. Subsequently, the number of colonies and morphology were recorded based on the total square root of the colonies and then different colonies were replicated on new plates to obtain pure culture. The multiplication of these microorganisms consisted of inoculating the isolated microorganism in a specific liquid medium for the growth of total bacteria, lactic acid bacteria and yeasts. 250mL of liquid medium was used for each microorganism. Multiplication was monitored by optical density at 600nm until reaching an absorbance of 2.0. Subsequently, another 500mL of medium was added, remaining until reaching a value of 2.0 again. After the multiplication time, the microorganisms were concentrated by centrifugation at 5000rpm at 5 °C for 10min. The precipitate was taken for freezing at -30 °C, followed by lyophilization, where it remained for 12 to 24 hours for drying. Lyophilized microorganisms were stored in a freezer at -20 °C. Before fermentation, the microorganisms (wild and commercial) were multiplied in a minimal medium containing sucrose (50 g.L- 1) and yeast extract (5 g.L-1) or a specific medium for lactic acid bacteria (NMR) (Table 1). In the flow hood, a sample of lyophilized microorganisms was transferred to the previously sterilized and cooled medium. Inoculated media were incubated in a Shaker incubator at 25°C until reaching a concentration of 107CFU.mL-1 in the medium, to be used in grain fermentation.
Table 1:Description of treatments used for coffee fermentation.
Inoculation and coffee fermentation
The fermentation experiments were conducted at the Federal Institute of Espírito Santo (IFES), Campus Venda Nova do Immigrate. Freshly harvested coffees were selected and mechanically pulped in a pulper. The pulped fruits were fermented in open highdensity polyethylene bioreactors. All treatments contained 2kg of pulped coffee, 2kg of husk/pulp, 1L of filtered water and 1L of medium with microorganisms at a concentration of 107CFU.mL-1. Fermentations were conducted with and without the addition of inoculum (control/spontaneous fermentation) and the specifics of each treatment used are presented in (Table 1). The fermentations were conducted for 48 hours. After fermentation, the coffees were transferred to raised drying beds for sun drying until they reached approximately 11% moisture content. All fermentations were conducted at room temperature, carried out in three replicates and the analyses were performed in duplicate.
Analysis of fermentation must
The must was characterized by totally reducing sugar content. For this, 25mL of the must at 24 and 48 hours were withdrawn and 1mL of the supernatant was centrifuged at 10.000rpm for 5 minutes and taken for analysis.
Analysis of coffee beans
The green and roasted coffee beans were subjected to analysis for soluble protein content and total reducing sugars. For the preparation of extracts from green and roasted coffee beans, 1g of coffee and 10mL of distilled water at 90°C were used. The samples were vacuum filtered through qualitative filter paper and the filtrate was used for subsequent analysis. Total reducing sugars were determined by the Dinitro Salicylic Acid (DNS) method [13] with modifications. In a test tube, 100μL of sample, 1000μL of distilled water and 1mL of DNS reagent were added. The mixture was heated in a water bath at 100°C for 5 minutes, followed by cooling. The absorbance of the samples was measured in a spectrophotometer at 540nm. The standard curve was constructed with the standard (glucose concentration versus absorbance) to quantify the values of reducing sugars. The obtained areas were plotted on a linear curve, whose equation was used to estimate the concentration in the sample extracted from the must, green and roasted beans. The protein content was determined by the Bradford method using bovine serum albumin as a standard, with modifications [14]. In a test tube, 100μL of sample and 5mL of Bradford reagent were added. The mixture was left at room temperature for 5 minutes. The absorbance of the samples was measured in a spectrophotometer at 595nm. Through a standard curve (μg BSA bovine serum albumin versus absorbance), the protein contents of green and roasted coffee beans were calculated.
Roasting and cupping
Samples of coffee (100g) were roasted in a roaster (TMC Pinhalense) with a capacity of 150g and subsequently ground in an electric grinder (Bunn, Coffee Mill). Roasting was performed 24 hours in advance and grinding was done after 8 hours of resting. The samples were roasted at an initial temperature of 150 °C (setpoint). The temperature increased by 5 °C per minute until reaching 200 °C. All samples were roasted for 9 to 11 minutes and after roasting and cooling, the samples remained sealed, following the methodology established by the Specialty Coffee Association (SCA 2023). Six expert coffee tasters with Q-Grader certifications conducted the sensory analysis. The sensory analysis was performed according to the SCA Protocol (2018). The minimum number of evaluators in the sensory analysis was initially proposed by [15] to reduce subjectivity in the analysis.
Statistical analysis
The experiments were conducted in a Completely Randomized Block Design (CRBD). The physicochemical and sensory data were evaluated through analysis of variance (ANOVA), followed by Tukey’s test for data evaluation, with a significance level of 5% (p≤0.05), respectively. The values are presented as mean ± standard deviation.
Results and Discussion
Fermentation must
Table 2:Values for total reducing sugars assessed in the fermentation musts after 24 and 48 hours of the fermentation process.
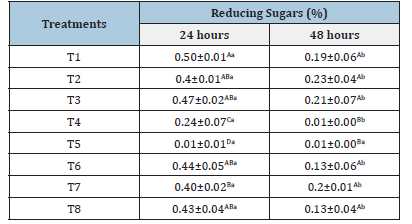
Means followed by at least one uppercase letter in the column do not differ from each other by Tukey’s test (p<0.05). Means followed by at least one same lowercase letter in the row do not differ from each other by Tukey’s test (p<0.05).
The total reducing sugar content was evaluated in the fermentation must at 24 and 48 hours (Table 2). Reduction in reducing sugar values was observed throughout fermentation for all treatments, except for treatment T5 (Safbrew T-58), where the reducing sugar content was already low within the first 24 hours. At 24 hours of fermentation, it was observed that treatment T5 (Safbrew T-58), followed by treatment T4 (Craft Series), had the lowest levels of reducing sugars in the must (0.01% and 0.24%), indicating high metabolism of the commercial yeasts. The same behavior was observed at 48 hours of fermentation. Apparently, although treatment T4 shows good capacity for utilizing the sugars in the must, there is a dependence on a longer time for this to occur compared to treatment T5. During fermentation, microorganisms consume the sugars present, converting them into organic acids and other metabolites that contribute to acidity, sweetness and different sensory descriptors in the beverage [16]. Efficient consumption of mucilage sugars is important for coffee quality, as if the process does not occur properly, it can lead to damage to the grain drying stage, favoring the development of fungi and bacteria, which consequently leads to a loss of beverage quality [9].
Physical-chemical evaluation of green and roasted beans
Soluble proteins and total reducing sugars were evaluated in fermented and dried coffee beans, before and after roasting. The levels of soluble proteins and total reducing sugars in green beans ranged from 0.47% to 1.22% and from 0.84% to 1.66%, respectively. As for roasted beans, these values ranged from 0.03% to 0.23% and from 1.51% to 3.26%, respectively (Table 3). The watersoluble proteins found in coffee beans are mainly globulins and albumins [17]. Regarding the soluble protein content, no significant differences were found between the treatments. Therefore, no differences were observed between natural fermentation (T1), isolated microorganism use (T3), commercial microorganisms (T8), and control (T9). Additionally, although the soluble protein content decreased after roasting in all treatments, there was no significant difference between them (Table 3). The reduction in protein content during roasting is an expected phenomenon, as coffee roasting is a complex process involving a series of chemical reactions that results in changes in the grain composition. During this process, proteins, along with sucrose, are consumed. It is estimated that about 21% of the proteins present in green beans are used in the Maillard reaction to produce melanoidins [17]. It is important to highlight that this decrease in protein content during roasting is desirable, as the greater the degradation of these proteins, the higher the potential quality of the final beverage [18]. The levels of reducing sugars found in green beans are similar to those reported by other authors for beans after fermentation [6,19] observed little change in glucose and fructose levels during coffee fermentation, keeping these levels relatively stable in the bean. However, a significant variation of these compounds is expected in the mucilage layer. [10] found a more pronounced reduction in sugar content when coffee beans were inoculated with specific microorganisms compared to the control treatment (spontaneous fermentation). However, this behavior was not observed in the present study, as no significant difference was found between treatments T1 (natural fermentation), T3 (IBTXM003), T8 (L. acidophilus) and T9 (control).
Table 3:Values obtained for the content of soluble proteins and reducing sugars in green and roasted coffee beans.

Means followed by at least one uppercase letter in the column do not differ from each other by Tukey’s test (p<0.05).
Means followed by at least one lowercase letter in the row do not differ from each other by Tukey’s test (p<0.05).
The highest levels of reducing sugars in green beans were found in treatments that used isolated microorganisms, namely T2 (ILXM002), T3 (IBTXM003) and T6 (IBLXM 001). On the other hand, treatments using commercial microorganisms, T4 (Craft Series) and T8 (L. acidophilus), did not show statistically significant differences and exhibited lower values. In roasted beans, the lowest content of reducing sugars was observed in treatment T9 (control). An increase in the content of reducing sugars was observed after the roasting process for all treatments, except for treatment T9. This increase is related to the thermal degradation of sucrose, resulting in the release of glucose and fructose [20]. Knowledge about the content of sugars and proteins in green beans is crucial since, during coffee roasting, these reducing sugars and amino acids act as important aroma precursors through the Maillard reaction [18]. The main sugars involved are glucose and fructose, which can be in free form or result from sucrose hydrolysis. In addition to the Maillard reaction, sugars are also consumed in the caramelization reaction, which contributes to the production of volatile compounds [1,2,21-23].
In turn, proteins contribute to aroma formation by being precursors of amino acids through their thermal degradation [23]. Furthermore, as observed by [4], the use of yeast in fermentation releases several extracellular enzymes that, together with the organic acids produced, can hydrolyze larger molecules, resulting in compounds important for aroma formation, including reduced sugars and amino acids.
Sensory Analysis
Sensory analysis plays a fundamental role in determining the quality of coffee beverages. In this study, five Q-Grader-certified tasters evaluated the sensory quality of the fermented coffees (Table 4). No statistically significant differences were observed between the overall scores of the different treatments, according to the Tukey test (p>0.05). All samples were classified as specialty coffees, with scores above 80 points (SCA, 2023). Regarding the overall score, values ranged from 81.00 to 84.70 points.
Table 4:Sensory terms used to describe the coffees from different treatments and the total sensory score of the beverage.
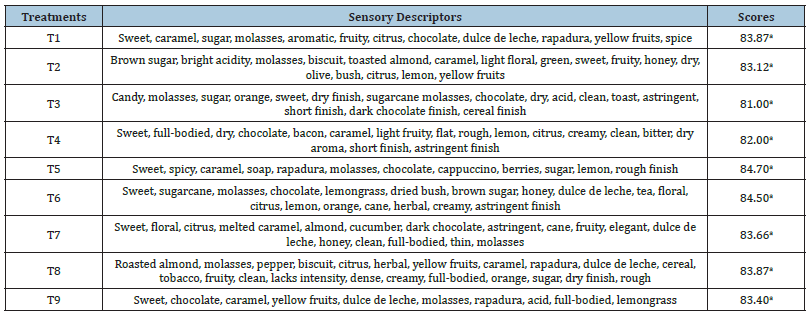
Means followed by the same letters do not differ significantly from each other according to the Tukey test (p<0.05).
Figure 1.Sensory differences perceived by the panel of experienced tasters.
Note: *Indicates a significant difference by the Tukey test (p<0.05).
Note: The graphic program was Microsoft Excel (version 365).
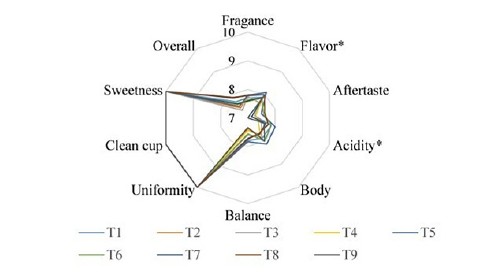
Although the flavor and aroma of coffee are mainly developed during the roasting process, it is important to note that the chemical components of green beans also play a crucial role in these parameters. Therefore, factors such as species, variety, fruit ripeness and type of processing used should be considered. Additionally, controlling fermentation parameters results in the production of specific chemical components related to the metabolism of the microorganism used as the starter culture [24]. In Figure 1, the graphs of sensory attributes for coffee fermented by different microorganisms and the control are presented. No statistically significant differences (p<0.05) were observed for the attributes of aftertaste, acidity, body, balance, fragrance, uniformity, clean cup, sweetness and overall. Only treatments T6 (IBLXM001) and T4 (Craft Series) showed statistical differences in relation to the acidity parameter, with T6 obtaining the highest score. Regarding the flavor parameter, treatments T5 (Safbrew T-58) and T6 (IBLXM001) were statistically equal and obtained a higher score than treatment T3 (IBTXM003) alone. It is not uncommon for significant differences not to be found in the sensory parameters of coffees fermented by different microorganisms. [10] did not observe significant differences in the parameters of clean cup, uniformity, aftertaste, sweetness, balance and overall scores in coffees fermented via natural fermentation or with yeast inoculation. Similarly, [24] reported no significant differences between the attributes of clean cup, balance, flavor, acidity, sweetness, body, uniformity, fragrance/ aroma and overall, when evaluating fermentation with inoculation of different microorganisms (yeasts, bacteria and lactic acid bacteria) and spontaneous fermentation.
Conclusion
The results of this study demonstrate that the use of the Safbrew T-58 yeast can significantly reduce the time required for coffee fermentation, representing a valuable time-saving measure. Analyses of the different microorganisms tested, including the control (without fermentation), did not reveal significant differences in the proteins and reducing sugars in both green and roasted beans. Additionally, in the sensory evaluation, all treatments achieved scores above 80, indicating the production of high-quality beverages. These findings highlight that, whether using wild or commercial starter cultures, it is possible to obtain excellent coffee. These discoveries have the potential to positively influence the industry, providing new opportunities to produce superior-quality coffees.
References
- Evangelista SR, Silva CF, Miguel MGP da C, Cordeiro C de S, Pinheiro ACM, et al. (2014) Improvement of coffee beverage quality by using selected yeasts strains during the fermentation in dry process. Food Research International 61: 183-195.
- Lee LW, Cheong MW, Curran P, Yu B, Liu SQ et al. (2015) Coffee fermentation and flavor-An intricate and delicate relationship. Food Chemistry 185: 182-191.
- Liu F, Song Z, Zhang T, Tong X, Chen MY, et al. (2022) Characterization of the therapeutic properties and flavor profile of coffee via monoculture fermentation with endophytic microbial isolates. ACS Food Science & Technology 2(6): 1039-1049.
- Bressani APP, Martinez SJ, Sarmento ABI, Borém FM, Rosane FS (2020) Organic acids produced during fermentation and sensory perception in specialty coffee using yeast starter culture. Food Research International 128: 108773.
- Waters DM, Arendt EK, Moroni AV (2017) Overview on the mechanisms of coffee germination and fermentation and their significance for coffee and coffee beverage quality. Critical Reviews in Food Science and Nutrition 57(2): 259-274.
- Elhalis H, Cox J, Frank D, Zhao J (2020) The crucial role of yeasts in the wet fermentation of coffee beans and quality. International Journal of Food Microbiology 333: 108796.
- Wang C, Sun J, Lassabliere B, Yu B, Zhao F, et al. (2019) Potential of lactic acid bacteria to modulate coffee volatiles and effect of glucose supplementation: Fermentation of green coffee beans and impact of coffee roasting. Journal of the Science of Food and Agriculture 99(1): 409-420.
- Da Silva Vale A, De Melo Pereira GV, De Carvalho Neto DP, Rodrigues C, Pagnoncelli MGB, et al. (2019) Effect of co-inoculation with pichia fermentans and pediococcus acidilactici on metabolite produced during fermentation and volatile composition of coffee beans. Fermentation 5(3): 67.
- De Carvalho Neto DP, Vinícius De Melo Pereira G, Finco AMO, Rodrigues C, Carvalho JCD, et al. (2020) Microbiological, physicochemical and sensory studies of coffee beans fermentation conducted in a yeast bioreactor model. Food Biotechnology 34(2): 172-192.
- Elhalis H, Cox J, Frank D, Zhao J (2021) Microbiological and chemical characteristics of wet coffee fermentation inoculated with hansinaspora uvarum and pichia kudriavzevii and their impact on coffee sensory quality. Frontiers In Microbiology 12.
- Pregolini VB, De Melo Pereira GV, Da Silva Vale A, De Carvalho Neto DP, Soccol CR et al. (2021) Influence of environmental microbiota on the activity and metabolism of starter cultures used in coffee beans fermentation. Fermentation 7(4): 278.
- Silva CF, Vilela DM, de Souza Cordeiro C, Duarte WF, Dias DR, et al. (2013) Evaluation of a potential starter culture for enhance quality of coffee fermentation. World Journal of Microbiology and Biotechnology 29(2): 235-247.
- Miller GL (1959) Use of dinitrosalicylic acid reagent for determination of reducing sugar. Analytical Chemistry 31(3): 426-428.
- M (1976) A rapid and sensitive method for the quantitation of microgram quantities of protein utilizing the principle of protein-dye binding. Analytical Biochemistry 72(1-2): 248-254.
- Pereira LL, Guarçoni RC, Moreira TR, de Sousa LHBP, Cardoso WS, et al. (2019) Very beyond subjectivity: The limit of accuracy of Q‐Graders. Journal of Texture Studies 50(2): 172-184.
- De Carvalho Neto D, De Melo Pereira G, Tanobe V, Thomaz Soccol V, G Da Silva B, et al. (2017) Yeast diversity and physicochemical characteristics associated with coffee bean fermentation from the Brazilian Cerrado Mineiro Region. Fermentation 3(1): 11.
- Wang X, Lim LT (2015) Physicochemical characteristics of roasted coffee. Coffee in Health and Disease Prevention, Academic Press, Massachusetts, USA, pp: 247-254.
- Cardoso WS, Dias SR, Coelho VS, Pereira LL, Fioresi DB et al. (2023) Maillard reaction precursors and arabica coffee (Coffea arabica L.) beverage quality. Food and Humanity 1: 1-7.
- Ribeiro LS, Evangelista SR, da Cruz Pedrozo Miguel MG, van Mullem J, Silva CF, et al. (2018) Microbiological and chemical-sensory characteristics of three coffee varieties processed by wet fermentation. Annals of Microbiology 68(10): 705-716.
- Bertuzzi T, Martinelli E, Mulazzi A, Rastelli S (2020) Acrylamide determination during an industrial roasting process of coffee and the influence of asparagine and low molecular weight sugars. Food Chemistry 303: 125372.
- Cho IH, Lee S, Jun HR, Roh HJ, Kim YS et al. (2010) Comparison of volatile maillard reaction products from tagatose and other reducing sugars with amino acids. Food Science and Biotechnology 19: 431-438.
- Wang C, Sun J, Lassabliere B, Yu B, Liu SQ, et al. (2020) Coffee flavour modification through controlled fermentation of green coffee beans by Lactococcus lactis cremoris. LWT 120: 108930.
- Lee LW, Cheong MW, Curran P, Yu B, Liu SQ et al. (2016) Modulation of coffee aroma via the fermentation of green coffee beans with Rhizopus Oligosporus: II. effects of different roast levels. Food Chemistry 211: 925-936.
- Mahingsapun R, Tantayotai P, Panyachanakul T, Samosorn S, Dolsophon K, et al. (2022) Enhancement of arabica coffee quality with selected potential microbial starter culture under controlled fermentation in wet process. Food Bioscience 48: 101819.
© 2024 Wilton S Cardoso. This is an open access article distributed under the terms of the Creative Commons Attribution License , which permits unrestricted use, distribution, and build upon your work non-commercially.
 a Creative Commons Attribution 4.0 International License. Based on a work at www.crimsonpublishers.com.
Best viewed in


.jpg)


 Editorial Board Registrations
 Submit your Article
 Refer a Friend
 Advertise With Us
.jpg)


.jpg)


.bmp)
.jpg)
.png)
.jpg)


.jpg)


.png)

.png)


.png)


