- Submissions

Full Text
Novel Approaches in Cancer Study
Texture Analysis Machine-learning for Risk Stratification of Vocal Cord Leukoplakia
Zufei Li1, Hong Zhang2, Jinghui Lu3, Joshua Si3, Muo Lu1, Zhikai Zhang1, Tianyu Liu3, Tiancheng Li1,4* and Wenli Cai3*
1Department of Otorhinolaryngology, Head and Neck Surgery, Beijing Chaoyang Hospital, Capital Medical University, China
2Department of Pathology, Peking University First Hospital, Beijing, China
3Department of Radiology, Massachusetts General Hospital and Harvard Medical School, USA
4Department of Otorhinolaryngology-Head and Neck Surgery, Peking University First Hospital, China
*Corresponding author:Tiancheng Li, Department of Otorhinolaryngology, Head and Neck Surgery, Beijing Chaoyang Hospital, Capital Medical University, Chaoyang District, China
Submission: August 25, 2023Published: December 22, 2023

ISSN:2637-773XVolume7 Issue5
Abstract
Objective: This study was to investigate the machine-learning texture analysis of laryngoscope image for risk stratification of Vocal Cord Leukoplakia (VCL).
Design: Retrospective case-control study.
Materials and methods: The laryngoscopy images were divided into the training datasets and the testing datasets. Five machine-learning classifiers including Support Vector Machine (SVM), Random Forest (RF), Naïve Bayes (NB), Neural Network (NN) and XG Boost (XGB) were trained using the training dataset and tested using the testing dataset. In addition, two laryngologists performed the Clinical Visual Assessments (CVA) for both training and testing datasets. The performances among five machine-learning models and two laryngologists were evaluated by using the area under the Receiver Operating Characteristic (ROC) Curves (AUC).
Result: In the training dataset, all five machine-learning models achieved Area Under Curve (AUC) between 0.935-0.966, in which RF was superior to other models. The AUC of clinicians’ CVAs were between 0.612-0.722. In the testing dataset, all five machine-learning models achieved AUC between 0.949-0.988. The AUC of clinicians’ CVAs were between 0.631-0.752.
Conclusion: The five machine-learning classifiers achieved excellent performance in predicting the pathological grading of VCL, which outperformed the CVA by clinicians.
Keywords:Vocal cord leukoplakia; Laryngoscopy; Machine learning; Texture analysis; Pathological grading
Introduction
Vocal Cord Leukoplakia (VCL) is a clinical diagnosis indicating abnormal white patches or plaques on the vocal mucosa that cannot be classified clinically as any other conditions [1]. It is believed that VCL is a chronic inflammatory response caused by smoking, drinking and Gastroesophageal Reflux (GER) or physical factors such as contralateral vocal cord polyps. However, the influence of infectious factors such as Human Papilloma Virus (HPV) remains controversial. In addition, there may be genetic susceptibility because in some cases environmental factors cannot be determined [2,3].
White light laryngoscope combined with biopsy is the standard diagnostic procedure for evaluating VCL [2].Under the laryngoscope, VCL can be observed as white patches covering on the surface of vocal cords, which can be classified pathologically into 5 grades, benign hyperplasia, mild dysplasia, moderate dysplasia, severe dysplasia, and epithelial cancer according to the World Health Organization (WHO) pathological classification system (Version 2006) [4]. Furthermore, the 2017 WHO Blue Book simplifies the five pathological grade of VCL into low-risk (squamous hyperplasia, mild dysplasia) and highrisk groups (previous categories moderate and severe dysplasia, epithelial cancer) [5]. The malignant transformation of high-risk VCL is 20%. In general, VCL is treated conservatively for 1-3 months at the first diagnosis [6]. If conservative treatment is not effective, an excisional biopsy is required. The depth of resection is adjusted according to the infiltration[6]. The Sequelae of surgery is related to the extent of surgical resection. If high-risk VCL can be accurately identified early, the scope of surgical resection may be smaller, and the sequelae are more likely to be recovered.
Recently, it has been reported that laryngoscopy may be used to detect high-risk leukoplakia based on the leukoplakia thickness, surface type, degree of inflammation of the lesion, and patient age, achieving a sensitivity of 80.4% and a specificity of 81.5% [7]. Different laryngoscopy techniques are employed to detect high-risk VCL, such as autofluorescence imaging, Narrow Band Imaging (NBI), laryngostroboscopic imaging, with the sensitivity between 82.6~92%, and the specificity is between 78%~92.8%, which varied depends on physicians’ experience and the nature of leukoplakia with ICC (inter-observers’ correlation) between 0.6 and 0.85 [8-10].
Texture analysis has been widely used in geophysics, agriculture, materials, and other scientific fields as well as in medical image analysis from gray-scale CT, MRI, ultrasound [11-14] to color endoscopic images [15-18]. Recently, texture analysis machinelearning , or radiomics, has gained great attention that links the imaging textures to clinical findings by using machine-learning models, which is expected to more objectively identify the tumor imaging features that correlates to biologic subgroups and subtypes of lesions [19]. To overcome the low performance of regular laryngoscopy in differentiation of malignant and precancerous lesions, Unger et al employed a high-speed stroboscopic laryngoscopy yielding 4,000 images per second and applied wavelet texture analysis using Support Vector Machine (SVM) to reveal the vocal cord dynamic patterns affected by abnormal vocal cords [20]. Such a high-speed stroboscope laryngoscopy is uncommon in clinical practice. To improve the accuracy of VCL diagnosis in regular white light laryngoscope images, Song et al compared the GLCM (Gray-Level Co-Occurrence Matrix) textures and observed that entropy and variance had the sensitivity and specificity of over 80% in differentiation of benign and malignant lesions [21]. Ren et al developed a deep-learning technique to automatically detect vocal cord lesions on white light laryngoscope [22]. Their study focused on the detection of VCL lesions without the classification of benign and malignant. The aim of this study was to investigate the machine-learning models using texture analysis of white light laryngoscope images for risk stratification of VCL, and to compare the performances of difference machine-learning models and clinician visual assessment.
Materials and methods
This study was approved by the Institutional Review Board and was conducted in accordance with the relevant guidelines and regulations. Informed consent was waived by the ethics committee due to the retrospective nature of this study.
Study cohort
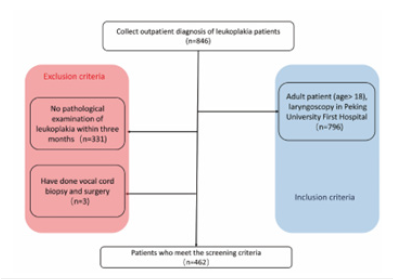
Patients diagnosed with VCL who underwent laryngoscopy examination between January 1, 2013, to June 1, 2023 were retrospectively collected. The data comes from two laryngoscopy examination centers, the Peking University First Hospital and Beijing Chaoyang Hospital of Capital Medical University. The patient inclusion criteria were: (1) Adult patients ≥18 years old; (2) Laryngoscope images were available, and (3) Pathological diagnosis of biopsy and/or surgery was performed. The exclusion criteria were: (1) No pathological biopsy was performed within 3 months after the diagnosis; (2) Previous vocal cord surgery or invasive vocal cord examination was performed.
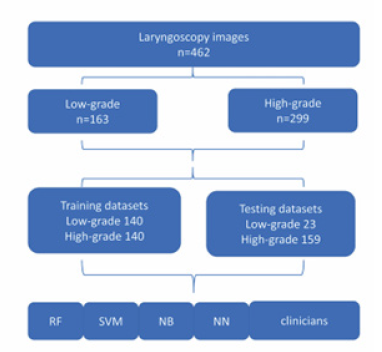
As shown in Figure 1, a total of 846 patients diagnosed with leukoplakia were enrolled in the study, of which 462 patients who met the criteria were finally selected. The patients were divided into training groups and testing groups. To maintain the balance of training dataset, we included 140 cases (50%) of high-grade dysplasia and 140 cases of low-grade dysplasia (50%), In the testing group, there were 159 high-grade dysplasia (87.4%), and 30 low-grade dysplasia (12.6%).
Figure 1:Flow diagram shows patient selection.
Pathologic diagnosis
VCL is pathologically classified into two subgroups: low-risk dysplasia (squamous hyperplasia, and mild dysplasia) and high-risk dysplasia (moderate and severe dysplasia, and carcinoma in situ) according to the WHO pathological grading criteria (Version 2017) [5]. The pathological manifestations of low-grade dysplasia are low malignant potential with morphology ranging from squamous hyperplasia to an augmentation of basal/parabasal cells, up to the middle of the epithelial thickness, and upper part unchanged. The pathological manifestations of high-grade dysplasia are high malignant potential including atypical epithelial cells, with morphological thickening at least from half of lower epithelium up to the entire epithelial thickness.
Architectural criteria include abnormal maturation; variable degrees of disordered stratification and polarity; altered epithelial cells occupy from half to the whole epithelial thickness; variable degree of irregularly shaped rete ridges; intact basement membrane; no stromal changes. Cytological criteria include cellular and nuclear atypias; marked variations in size and shape; hyperchromasia; nucleoli increased in number and size; mitoses increased throughout the epithelium, with or without atypical forms; dyskeratotic and apoptotic cells frequent throughout the epithelium [5]. The pathological grading was determined by a pathologist and a laryngologist in censuses (H.Z, T.L)
Laryngoscopy examination and ROI delineation
All laryngoscopy examinations were performed by experienced otolaryngologists using a flexible 2.9mm laryngoscope (Olympus Medical Systems, Tokyo, Japan). The collected laryngeal images were taken under white light conditions. Two clinicians (Z.L, M.L) reviewed the laryngoscopy images and selected a clear and glarefree image from about 10 VCL laryngoscope images for each patient. The vocal cord in the picture needs to be in the middle, showing all the vocal cord structure, the vocal cords are located in the abductor state.
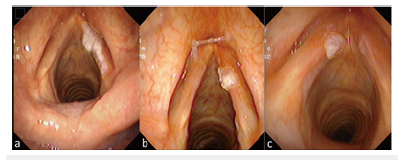
The Region of Interest (ROI) of VCL were manually delineated on laryngoscope images by three otolaryngologists (Z.L, M.L, Z.Z). The final contour of each ROI was determined by the consensus of three otolaryngologists (Figure 2).
Figure 2:ROIs of Vocal Cord Leukoplakia (VCL). (a) 56-years-old male with severe dysplasia of the right vocal cord. (b) 48-years-old male with squamous hyperplasia of the right vocal cord. (c) 63-years-old male with a pathological diagnosis of squamous cell carcinoma of the left vocal cord.
Feature extraction
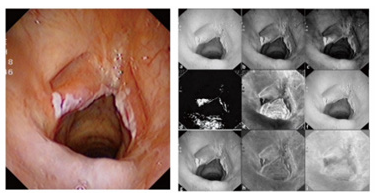
First, the laryngoscope images were decomposed into three different color spaces: HSV, RGB and CIELAB by using IMAGE J (Softonic International, Barcelona, Spain). The HSV color space is hue (Hue), Saturation (Sat), and Value (Val). The RGD color space is Red, Green, Blue. The CIE Lab color space is defined as brightness (L), a and b are two color channels. Thus, each image was decomposed into 9 channel images (Figure 3).
Figure 3:On the left is the original image, on the right is the color space decomposition image. In the right image, (a-c) The decomposition diagram of RGB color space is red (a), green (b), and blue (c) channels in sequence. (d-f) The decomposition diagram of HSV color space is Hue(d), Sat(e), and Val(f) channels. (g-i) The decomposition diagram of CIELAB color space is lightness(g), “a”channel is red-green space (h), and “b”channel is blue-yellow space (i).
A set of 56 textures were extracted in each ROI on each color channel of the images including histogram features (n=13), Gray Level Co-Occurrence Matrix (GLCM) features (n=21), Gray Level Run-Length Matrix (GLRLM) features (n=11), and gray level zone size matrix (GLZSM ) features (n=11). This resulted in a total of 504 texture features for each laryngoscope images.
Model training and testing
3DQI software platform (3D Quantitative Imaging Laboratory, Massachusetts General Hospital and Harvard Medical School) was utilized to training and testing of machine-learning models of texture analysis, including feature selection, model training, and model validation.
Feature selection and models
Table 1:Technical parameters of 5 machine-learning classifiers.
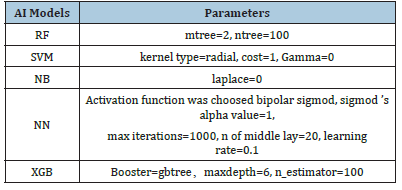
To build the model for classification of low-risk and high-risk groups, we performed Boruta algorithm [23] to select important features related to the risk stratification. In this study, those selected features were sorted in descending order of importance. To maintain consistency and avoid overfitting, only the top 10 features, if any, were used to train the machine-learning models. A higher place of a feature among selected features indicates greater significance and classification value of the feature for the machinelearning model created. To compare the performance of different machine-learning models, we trained five models including Random Forest (RF), Support Vector Machine (SVM), Naïve Bayes (NB)Neural Network (NN) and eXtreme Gradient Boosting (XGB). Their technical parameters are listed in Table1.
Training, validation and testing
The training, validation, and testing of five machine learning models were conducted on the 3DQI platform. The entire dataset was separated into the training and testing images: 280 cases for training including 140 cases of low-grade leukoplakia and 140 cases of high-grade leukoplakia, and 182 cases for testing including 23 low-grade cases and 159 high-grade cases.
We applied 10-fold cross-validation method to train and validate the performance of each model. We also used testing dataset to evaluate the performances of the trained models. Two laryngologists delivered Clinical Visual Assessments (CVAs) of dataset images. Clinicians delivered assessments of images without time constraint and were blinded to the pathological results of the patients. The data flow of the study is shown in Figure 4.
Figure 4:The flow diagram of the dataset creation.
Statistical Analysis
Statistical analysis was conducted by 3DQI platform. Quantitative variables were showed as mean ± SD. Intraclass Correlation Coefficient (ICC) was analyzed for estimating the interobserver agreements between different models, which was defined as good consistency between 0.75 and 1, fair consistency between 0.4 and 0.75, and poor under 0.4. Receiver Operating Characteristic (ROC) curve was used to evaluate the performance of the models. The Area Under the Curve (AUC)≥0.8 was considered a good performance. Two ROCs were compared using DeLong et al. [24] method. A p-value <0.05 was considered statistically significant.
Result
Patient cohort
In the training dataset, the mean age of patients was 59±10.4 years, range from 31-86 years, and 266 men (95.0%) and 14 women (5.0%). In the testing group, with The mean age of 61±8.9 years, range from 41-78 years, and 179 males (98.4%) and 3 females (1.7 %). There was no significant difference in age and gender between the two groups(p>0.05).
Feature selection
Thirty important features were selected by Boruta algorithm, and we used the top ten important features to establish machinelearning models. The top ten important features were calc_energy (Sat), calc_meanDeviation (Red), calc_meanDeviation (Val), glrlm_ GLN (Sat), glszm_HISAE (Blue), glcm_inverseVariance (a_star), glszm_IV (Sat), glszm_SZV (Sat), glcm_inverseVariance (b_star) and glrlm_SRHGLE (Blue). Figure 5 shows the heatmap and box plot of the selected top 10 features in the low- and high-grade groups of VCL.
Figure 5:(a) Heatmap of top ten features on training dataset. (b) Box plot of filtered features between lowgrade( L) and high-grade groups(H) in training and testing dataset.
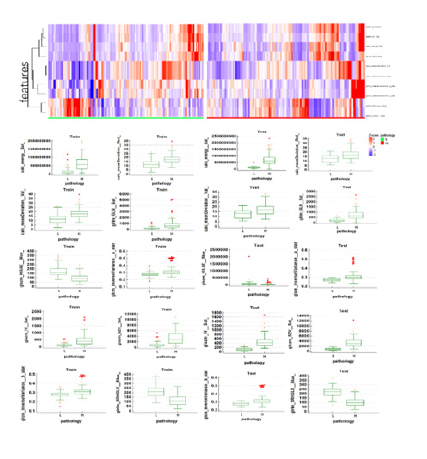
Figure 6:ROC curves of AI models and clinicians’ CVAs in training datasets. (a) ROC curves of AI models. (b) ROC curves of clinician’s’ CVAs in training datasets. (c) ROC curves of AI models and (d) clinician’s’ CVAs in testing datasets. (AUC=the area under the ROC curve).
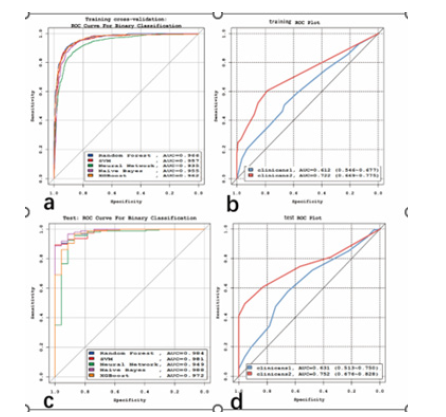
Table 2:The validation/ performance performances of 5 machine learning models.

Model building and validation
Table 3:The comparison of validation ROCs of 5 models in training datasets in training/ testing datasets.
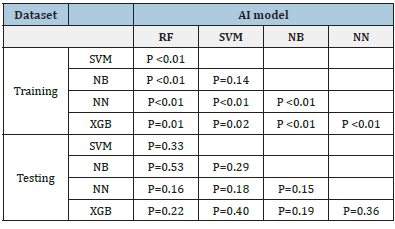
In training datasets, the AUCs of the five machine learning models of RF, SVM, NB, NN and XGB, were 0.966 (95%CI:0.960~0.971), 0.957 (95%CI:0.949~0.964), 0.955 (95%CI:0.947~0.962), 0.935 (95%CI:0.925~0.943) and 0.962 (95%CI:0.955~0.968), respectively. Of which, RF achieved the best performance. The detailed performances of these models are listed in Table 2. The ROCs of these five models shown in Figure 6a were statistically significantly different (P<0.05) except between SVM and NB (p=0.14), see Table 3.
Figure 6b shows the ROCs of CVAs by two clinicians. The AUC of clincans1 and clincans2 were 0.612 (95%CI:0.552 to 0.669), and 0.722 (95%CI:0.666 to 0.774). The AUCs of the two CVAs were significant (p<0.01). ICC of CVAs between two clinicians was 0.396. The ROCs of CVA were significantly different compared with machine-learning models (p <0.05).
Testing
In the testing datasets, the AUCs of these five machine learning models of RF, SVM, NB, NN and XGB were 0.984 (95%CI:0.969~0.999), 0.981 (95%CI:0.964~0.998), 0.988 (95%CI:0.976~1.000), 0.949 (95%CI: 0.890~1.000) and 0.972 (95%CI:0.942~1.000), respectively. Table 2 lists the detailed performance. The difference among these 5 models were not significant (p>0.05), see Table3. The ROCs of these five models are shown in Figure 6c.
The AUC of clincans1 and clincans2 were 0.631 (95%CI:0.557 to 0.702), 0.752(95%CI:0.683 to 0.813), see Figure 6d, with significant difference (p=0.031). ICC of CVAs by two clinicians was 0.649. The CVAs were significantly different from machine learning models (p <0.05).
Discussion
Texture analysis
There are differences in the absorption of light by human tissues. Different wavelengths of light have different penetrating capabilities to tissues. Therefore, tissue structures of different depths show different colors [25]. Using this principle, endoscopic techniques such as NBI, FACE and I-scan can highlight the malignant tissue structure of a lesion [26-28]. Therefore, there may be a connection between the texture characteristics of different color spaces and the structure of the lesion. In this study, we calculated textures in nine color channels of three color spaces include HSV, RGB and CIELAB. Freitas et al applied color space decomposition to improve the recognition ability of the cystoscope [29]. Vasileios et al used color space decomposition to extract texture features to automatically distinguish normal tissues and ulcers on capsule endoscopic images, mean accuracy>95%) [30].
In this study, we demonstrated that the pathological classification of vocal cord leukoplakia can be distinguished by textures extracted from three color spaces decomposed from ordinary white light laryngoscope images. The features selected by machine learning are mainly concentrated in the two channels of Sat and Blue. The saturation channel screened out the second-order features to indicate the color of the lesion. The pathological highrisk group has a value greater than the low-risk group. Considering that the internal color of the leukoplakia with a high pathological level has higher color saturation and more dramatic changes. It may be related to the disorder of the internal structure of highgrade leukoplakia, which presents more color changes, which is similar to the color changes of malignant lesions in the research of Rzepakowska A, et al. [31]. The features screened in the blue channel all show that the value of the high-risk group is low.
This principle is similar to narrow-band imaging. Malignant lesions have an increased absorption of blue and green light due to superficial vascular proliferation. They appear reddish-brown in the narrow band, and benign lesions are blue green [25]. However, the naked eye cannot perceive this change in ordinary white-light endoscopic images. This feature is highlighted by the use of color decomposition technology. In this study, the poor-quality pictures were manually excluded when selecting images, and the images were from the same laryngoscopy machine at one institute, which ensured highly consistent quality of the dataset. In future, we will collect different white light laryngoscopic images from multiple institutes. Although the color space dissolution may reduce the image variability caused by lighting, some of the important textures selected in this study were from the color channels that may be affected by the lighting. We will employ image normalization before feature extraction to improve the feature stability, adding color correlations and Zernike moments to extract image features.
Machine-learning and comparing with clinicians
In this study, five Machine-Learning (ML) models demonstrated significantly good performance with AUC>0.9. RF can handle highdimensional data, the generalization ability of the model is strong, and the model training results are highly accurate. As a classifier with superior performance, RF is used in various applications [16]. In this study, RF models in the training dataset outperformed other ML models. We used balanced dataset to reduce over-fitting in training procedures. However, the outperformance between RF and other models were not significant in testing dataset, which may be caused by the unbalanced test dataset.
The performances of the five ML models were significantly better than the performances of clinicians’ CVA. The accuracy of ML model was also better than that of clinicians’, which can provide a reliable and accurate basis for clinicians to choose treatment options. As to high-risk patients, biopsy or surgery can be performed without waiting 1-3 months of conservative treatment. In this study, The CVAs of the two clinicians have lower accuracy. Clinician 2 is a senior laryngologist, and his CVAs are more accurate than that of Clinician 1, indicating the clinical experience is helpful for making correct clinical diagnosis. Fang et al. classification vocal fold leukoplakia by clinical scoring (including age, sex, smoking history and CVAs). The model had an AUC of 0.86, the sensitivity of 80.4%, and the specificity of 81.5%. The CVAs of their model were judged by multiple laryngologists [32]. However, the performance of their model is still lower than that of our machine learning models.
The inter-observer’s variability in manual-drawing ROIs shows slight impacts to the performance of ML models. In an experiment, the expanded ROI resulted in very similar results. According to our data [supplementary materials], dilated ROIs will achieve more stable results than those of reduced ROIs. The limitations of this research included the number of samples of this study was still relatively small, and it was not suitable for establishing a deeplearning model. In the follow-up research, as the amount of data increases. We plan to use color texture technology combined with deep learning technology to enrich 3DQI’s functions in automatic drawing [33]. In the follow-up research, the machine can automatically segment the ROI to further reduce the difference caused by manual drawing.
Conclusion
The five machine-learning models have excellent performances in predicting the pathological grade of VCL, which outperformed the clinician’s CVAs. The ML models could serve as a reliable and conveniently tool in laryngoscopy for the risk stratification and clinical managements of patients with VCLs, suggesting great potentials for clinical applications.
References
- Panwar A, Lindau R, Wieland A (2013) Management of premalignant lesions of the larynx. Expert Rev Anticancer Ther 13(9): 1045-1051.
- Garrel R, Uro Coste E, Costes Martineau V, Woisard V, Atallah I, et al. (2023) Vocal-fold leukoplakia and dysplasia. Mini review by the French Society of Phoniatrics and Laryngology (SFPL). Eur Ann Otorhinolaryngol Head Neck Dis 137(5): 399-404.
- Sadri M, McMahon J, Parker A (2006) Laryngeal dysplasia: aetiology and molecular biology. J Laryngol Otol 120(3): 170-177.
- Thompson L (2006) World Health Organization classification of tumours: pathology and genetics of head and neck tumours. Ear Nose Throat J 85(2):74.
- Gale N, Poljak M, Zidar N (2017) Update from the 4th Edition of the World Health Organization Classification of Head and Neck Tumours: what is new in the 2017 WHO Blue Book for Tumours of the Hypopharynx, Larynx, Trachea and Parapharyngeal Space. Head Neck Pathol 11(1): 23-32.
- Flint PW, Haughey BH, Robbins KT (2014) Cummings Otolaryngology-head and neck surgery E-Book. Elsevier Health Sciences, Amsterdam, Netherlands.
- Li C, Zhang N, Wang S, Cheng L, Haitao W, et al. (2018) A new classification of vocal fold leukoplakia by morphological appearance guiding the treatment. Acta Otolaryngol 138(6): 584-589.
- Ni XG, Wang GQ, Hu FY, Ling Xu, Xin MX, et al. (2019) Clinical utility and effectiveness of a training programme in the application of a new classification of narrow-band imaging for vocal cord leukoplakia: A multicentre study. Clin Otolaryngol 44: 729-735.
- Rzepakowska A, Sielska BE, Cruz R, Sobol M, Osuch WE, et al. (2018) Narrow band imaging versus laryngovideostroboscopy in precancerous and malignant vocal fold lesions. Head Neck 40(5): 927-936.
- Arens C, Reussner D, Woenkhaus J, Leunig A, Betz CS, et al. (2007) Indirect fluorescence laryngoscopy in the diagnosis of precancerous and cancerous laryngeal lesions. Eur Arch Otorhinolaryngol 264(6): 621-626.
- Wu S, Zheng J, Yong L, Zhuo W, Siya S, et al. (2018) Development and validation of an MRI-based Radiomics signature for the preoperative prediction of Lymph node metastasis in bladder cancer. Ebio Medicine 34: 76-84.
- Lambin P, Leijenaar RT, Deist TM, Jurgen P, Evelyn EC, et al. (2017 ) Radiomics: the bridge between medical imaging and personalized medicine. Nat Rev Clin Oncol 14(12): 749-762.
- Ji GW, Zhang YD, Zhang H, Fei PZ, Ke Wang, et al. (2019) Biliary Tract Cancer at CT: A Radiomics-based model to predict lymph node metastasis and survival outcomes. Radiology 290(1): 90-98.
- Yu FH, Wang JX, Ye XH, Deng J, Hang J, et al. ( 2019) Ultrasound-based radiomics nomogram: A potential biomarker to predict axillary lymph node metastasis in early-stage invasive breast cancer. Eur J Radiol 119: 108658.
- Wang C, Luo Z, Liu X, Bai J, Liao G (2018) Organic boundary location based on color-texture of visual perception in wireless capsule endoscopy video. J Healthc Eng 10: 3090341.
- Pogorelov K, Suman S, Azmadi HF, Aamir SM, Olga Ostroukhova, et al. (2019 ) Bleeding detection in wireless capsule endoscopy videos-Color versus texture features. J Appl Clin Med Phys 20(8): 141-154.
- Stoecker WV, Wronkiewiecz M, Chowdhury R, Stanley RJ, Jin Xu, et al. (2011 ) Detection of granularity in dermoscopy images of malignant melanoma using color and texture features. Comput Med Imaging Graph 35(2): 144-147.
- Szczypiński P, Klepaczko A, Pazurek M, Daniel P (2014 ) Texture and color-based image segmentation and pathology detection in capsule endoscopy videos. Comput Methods Programs Biomed 113: 396-411.
- Gillies RJ, Kinahan PE, Hricak H (2016) Radiomics: Images are more than pictures, they are data. Radiology 278(2): 563-577.
- Unger J, Lohscheller J, Reiter M, Eder K, Betz CS, et al. ( 2015) A noninvasive procedure for early-stage discrimination of malignant and precancerous vocal fold lesions based on laryngeal dynamics analysis. Cancer Res 75(1): 31-39.
- Song CI, Ryu CH, Choi SH, Roh JL, Nam SY, et al. ( 2013 ) Quantitative evaluation of vocal-fold mucosal irregularities using GLCM-based texture analysis. Laryngoscope 123(11): E45-E50.
- Ren J, Jing X, Wang J, Xue Ren, Yang Xu, et al. (2020) Automatic recognition of Laryngoscopic images using a deep-learning technique. Laryngoscope 130(11): E686-E693.
- Kursa MB, Rudnicki WR ( 2010) Feature Selection with the Boruta Package. Journal of Statal Software 36(11): 1-13.
- DeLong ER, Delong DM, Clarke Pearson DL ( 1988 ) Comparing the areas under two or more correlated receiver operating characteristic curves: a nonparametric approach. Biometrics 44(3): 837-845.
- Kuznetsov K, Lambert R, Rey JF ( 2006) Narrow-band imaging: potential and limitations. Endoscopy 38(1): 76-81.
- Kakushima N, Yoshida M, Yamaguchi Y, Takizawa K, Kawata N, et al. (2019) Magnified endoscopy with narrow-band imaging for the differential diagnosis of superficial non-ampullary duodenal epithelial tumors. Scand J Gastroenterol 54(1): 128-134.
- Osawa H, Yamamoto H (2014) Present and future status of flexible spectral imaging color enhancement and blue laser imaging technology. Dig Endosc 1: 105-115.
- Kodashima S, Fujishiro M (2010) Novel image-enhanced endoscopy with i-scan technology. World J Gastroenterol 16(9): 1043-1049.
- Freitas NR, Vieira PM, Lima E, Lima CS ( 2018) Automatic T1 bladder tumor detection by using wavelet analysis in cystoscopy images. Phys Med Biol 63(3): 035031.
- Charisis VS, Hadjileontiadis LJ, Liatsos CN, Mavrogiannis CC, Sergiadis GD (2012) Capsule endoscopy image analysis using texture information from various colour models. Computer methods and programs in biomedicine 107(1): 61-74.
- Rzepakowska A, Sobol M, Sielska BE, Niemczyk K, Osuch WE (2020) Morphology, vibratory function, and vascular pattern for predicting malignancy in vocal fold Leukoplakia. J Voice 34(5): 812.e9-812.e15.
- Fang TJ, Lin WN, Lee LY, Chi KY, Li AL, et al. (2016) Classification of vocal fold leukoplakia by clinical scoring. Head Neck 38 Suppl 1: E1998-2003.
- Wittenberg T, Kothe C, Münzenmayer C, Grobe M, Volk H, et al. (2003) Automatic Classification of Leukoplakia on Vocal Folds Using Color Texture Features.
© 2023. Tiancheng Li. This is an open access article distributed under the terms of the Creative Commons Attribution License , which permits unrestricted use, distribution, and build upon your work non-commercially.
 a Creative Commons Attribution 4.0 International License. Based on a work at www.crimsonpublishers.com.
Best viewed in


.jpg)


 Editorial Board Registrations
 Submit your Article
 Refer a Friend
 Advertise With Us
.jpg)


.jpg)


.bmp)
.jpg)
.png)
.jpg)


.png)

.png)


.png)


