
- About Us
- Information
-

The Author ensures that the research has been conducted responsibly and ethically with adherence to all relevant regulations. read more..
- For Authors
- For Reviewer
- Manuscript Guidelines
- Membership
- Publication Ethics
-
- Journals
- Reprints
- e-Books
- Videos
- Policies
- Contact Us
 COVID-19
- Submissions


Full Text
Modern Concepts & Developments in Agronomy
Determination of Color, Whiteness Index, and Glossiness Properties in Wax Applied American white oak (Quercus alba) Wood
Umit Ayata1* and Ahmet Ayata2
1Department of Interior Architecture and Environmental Design, Turkey
2Retired Construction Supervisor, Turkey
*Corresponding author:Umit Ayata, Faculty of Arts and Design, Department of Interior Architecture and Environmental Design, Bayburt University, Bayburt, Turkey
Submission: July 18, 2024;Published: August 30, 2024

ISSN 2637-7659Volume14 Issue 3
Abstract
In today’s context, American white oak wood is used in agricultural tools, carpentry, doors, railway vehicles, furniture, and upholstery. In this study, surfaces obtained by applying wax at different coat numbers (1, 2, and 3) on American white oak (Quercus alba) wood were evaluated for color parameters, glossiness (║ and ⊥, 20 o, 60 o, and 85 o), and whiteness index (WI*) (║ and ⊥) values. Results from samples with different numbers of wax coats were compared with control samples. According to the results obtained, significant differences in coat numbers were observed across all tests. Wax treatments resulted in declines in L* and ho values, alongside rises in a*, C*, and b* values. The ΔL* values were negative, whereas the Δa*, Δb*, and ΔC* values were positive. The color difference (ΔE*) values were determined as follows: 5.62 for 1 coat of wax, 11.96 for 2 coats of wax, and 10.57 for 3 coats of wax. In all degrees and directions tested, the lowest gloss values were obtained with the control samples, while the highest WI* values were also found in the control samples. In this study, it was noted that applying different numbers of wax layers yielded varying outcomes.
Keywords:
American white oak; Glossiness; Whiteness index; Wax; ColorIntroduction
Wood is one of the most important natural raw material sources used by humans. Its significant role as a renewable resource is attributed to its widespread availability, as well as its properties such as hardness, strength, elasticity, and lightness. Additionally, its ability to be shaped and the capacity to improve certain properties, along with qualities like nail and screw holding capabilities and adhesiveness, contribute to its importance. Thanks to these favorable characteristics, wood material finds thousands of applications today [1].
Wood materials left exposed to outdoor conditions in their natural state are susceptible to various biotic and abiotic hazards. Therefore, it may be necessary to impregnate them or apply protective coatings, especially for those of aesthetic significance [2].
Wood surface treatments have been employed since ancient times to overcome inherent limitations, enhance aesthetic appeal, ensure cleanliness, and provide protection against external elements. In furniture production, various wood species and surface finishes are utilized, each offering distinct structural properties that influence their application. These variations in structural and surface properties are critical factors that define and restrict the use of varnish systems in different contexts [3].
Young worker bees produce wax, which is secreted as a liquid from four pairs of wax glands located on the ventral surface of their abdominal tergites. This liquid wax spreads over the surface of these plates and solidifies upon exposure to air, forming a single wax scale on each tergite. These scales appear as small wax flakes on the lower part of the bee’s body. A worker bee produces eight wax scales every 12h. The size of the wax glands is dependent on the worker bee’s age: they reach their maximum size around 12 days old and gradually decrease from the eighteenth day until the end of their life [4].
This study seeks to fill a research gap in the literature, where wax-based treatments have been extensively studied in various modifications or in their natural state across different wood species [5-30]. Studies have reported the application of wax-based chemicals prepared using various methods on wood materials. However, there is a notable lack of investigation into the surface properties after applying three different coat numbers of wax specifically on American oak wood. Below are summarized details about this particular tree species.
American oak (Quercus alba) has been valued by several Native American tribes for its antiseptic and astringent properties and has been used medicinally to treat various ailments. The bark was chewed to treat mouth sores [31]. Heartwood generally shows a moderate level of resistance to decay. It finds extensive use in various applications such as railroad ties, lumber, mine supports, barrel-making, fence posts, fuelwood, cladding, and more. Highquality white oak is especially preferred for making tight barrels. Its durability against decay makes it a popular choice for ship and boat planking as well as curved components. Moreover, it is utilized in doors, flooring, railway equipment, agricultural tools, carpentry, furniture, and a wide range of other products [32]. In terms of its composition, the cellulose content in American oak wood is 38.11%, lignin is 25.01%, ethanol-cyclohexane soluble extractives are 2.03%, and hot water solubility is 3.16% [33]. Waxes are also applied to drawer slides and edges, as well as on surfaces that need to be slippery, such as skis, to reduce friction. Waxes can be softened with heat [34].
In this study, color, glossiness, and whiteness index values were determined on surfaces obtained by applying wax at different coat numbers on American white oak (Quercus alba) wood.
Material and Method
For this research, American white oak (Quercus alba) wood sourced commercially was cut into dimensions of 100 x 200 x 20mm. The wood surfaces underwent sanding with 80, 100, and 120 grit sandpapers using a vibration sander before being cleaned with compressed air. A wax-based oil mixture, comprising natural and synthetic waxes (neutral color, 30% dry residue, paste-like appearance, characteristic odor, water-dispersible but not soluble, pH 7.6), was applied to the wood surfaces in 1, 2, and 3 coats using a brush.
Glossiness, much like color and light intensity, is a psychophysical quantity that requires standardized illuminating and observing conditions [35]. Glossiness tests were conducted using the ETB- 0833 model gloss meter device according to the ISO 2813 [36,37] standard. These tests were performed at three different angles (20 °, 60 °, and 85 °) in both perpendicular and parallel directions to the wood fibers.
Whiteness index (WI*) values were measured using the Whiteness Meter BDY-1 device, evaluating both parallel and perpendicular orientations to the wood fibers, following ASTM E313-15e1 [38] standards.
The color change of the samples was assessed using the CS-10 (CHN Spec, China) device, following the ASTM D 2244-3 [39] standard [CIE D65 light source, CIE 10 ° standard observer; illumination system: 8/d (8°/diffuse illumination)]. In the literature, ΔC* is referred to as chroma difference or saturation difference, and ΔH* is referred to as hue difference or shade difference [40]. The total color differences were computed utilizing the formulas provided.
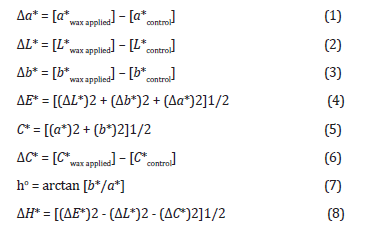
Definitions for other parameters [ΔC*, Δa*, Δb*, and ΔL*] can be found in Table 1 [40]. The criteria for visually assessing the calculated ΔE* color difference are outlined in Table 2, in accordance with DIN 5033 [41].
Table 1:The definitions of ΔC*, Δa*, Δb*, and ΔL* [40].

Table 2:Comparison criteria for ΔE* evaluation [41].

Statistical Analysis
Using statistical software and measurements from the study, calculations have been conducted to determine maximum measurement values, minimum mean values, analysis of variance, standard deviations, homogeneity groups, and percentage (%) change rates.
Findings and Discussion
Table 3 shows the analysis of variance results for color parameters. In all tests for color parameters, the number of coats factor was found to be significant (Table 3).
Table 3:Analysis of variance results for color parameters.

Table 4 displays the measurement results for color parameters. With wax applications, decreases were found in ho and L* values, while increases were observed in C*, a*, and b* values (Table 4).
In the a* parameter, the highest result was observed in the samples treated with 2 coats of wax (9.59), while the lowest result was found in the control samples (6.23). a* test, the greatest increase was observed in the samples with 2 coats of wax, showing a rise of 53.93%, while the smallest increase was recorded in the samples with 1 coat of wax, at 22.95% (Table 4).
The highest L* value was found in the control group samples (64.14), while the lowest value was obtained on surfaces treated with 2 coats of wax (53.93). The smallest decrease rate in L* was observed with 1 coat wax application (%6.53), whereas the highest decrease rate was seen in the experimental samples with 2 coats of wax (%15.92) (Table 4).
Table 4:Measurement results for color parameters.

In the b* value test, the highest rate of increase was observed in the samples treated with 2 coats of wax at 27.65%, whereas the lowest rate of increase was found in the samples treated with 1 coat of wax at 18.26%. For the b* parameter, the highest result was found in the samples treated with 2 coats of wax (24.19), while the lowest result was obtained in the control samples (18.95) (Table 4).
When looking at C* parameter, the highest increase rate was obtained in the samples treated with 2 coats of wax at 30.48%, while the lowest increase rate was found in the samples treated with 1 coat of wax at 18.60%. For C* value, the lowest result was observed in the control samples (19.95), whereas the highest result was seen in the samples treated with 2 coats of wax (26.03) (Table 4).
Regarding the results for the ho parameter, after wax applications, the minimum decrease rate was 0.93% with 1 coat, and the maximum decrease rate was 4.82% with 2 coats. In ho parameter, the lowest result was found on the surfaces of samples treated with 2 coats of wax (68.34), while the highest result was obtained on the control samples where no wax application was done (71.80) (Table 4).
Table 5 presents the results for total color differences. The ΔH* values were determined to be 0.54 for 1 coat of wax, 1.34 for 2 coats of wax, and 1.02 for 3 coats of wax. For all wax applications, the ΔL* values were found to be negative (darker than the reference), while the Δa*, Δb*, and ΔC* values were positive (indicating the samples were redder, yellower, and clearer/brighter than the reference, respectively). The ΔE* values were found to be 5.62 for 1 coat of wax, 11.96 for 2 coats of wax, and 10.57 for 3 coats of wax. When comparing the color change criteria, applying 1 coat of wax resulted in a “very distinct” category (3.0 - 6.0), while applying 2 to 3 coats of wax resulted in a “strong” category (6.0 - 12.0) (Table 5).
Table 5:Results for total color differences.

Table 6 presents the analysis of variance results for whiteness index (WI*) values. The number of coats factor was found to be significant in whiteness index (WI*) values in both directions (⊥ and ║) (Table 6).
Table 6:Analysis of variance results for whiteness index (WI*) values.

Table 7 displays the measurement results for whiteness index (WI*) values. Decreases were observed in WI* tests in both directions. The control samples exhibited the highest values (⊥: 19.56 and ║: 14.60). The lowest WI* results were found in the experimental samples treated with 2 coats of wax (⊥: 12.50 and ║: 6.98). Decrease percentages for applications of 1, 2, and 3 coats were found to be %31.19, %36.09, and %28.43 for WI* ⊥, respectively, and %34.79, %52.19, and %28.36 for WI* ║, respectively (Table 7).
Table 7:Measurement results for whiteness index (WI*) values.

In the literature on wax studies, it has been reported that applying different numbers of coats affects the whiteness index (WI*) values [ebony Africa (Diospyros crassiflora Hiern.) [9], lemon (Citrus limon (L.) Burm.) [8], magnolia (Magnolia grandiflora L.) [15], American black cherry (Prunus serotina) [30], American walnut (Juglans nigra L.) [12], plum (Prunus domestica L.) [16], olive (Olea europaea L.) [23], ebony Macassar (Diospyros celebica Bakh.) [26].
The analysis of variance results for glossiness values are presented in Table 8. In all grades and directions, the number of coats factor was found to be significant in glossiness values (Table 8). Table 9 presents the measurement results for glossiness (║ and ⊥, 20 o, 60 o, and 85 o) values. Increases were observed in glossiness values with the application of multiple coats in all grades and directions. The lowest glossiness values were found in the control samples (⊥20 o: 0.41, ⊥60 o: 2.38, ⊥85 o: 0.91 and ║20 o: 0.30, ║60 o: 2.63, and ║85 o: 1.70). The highest glossiness values were obtained on surfaces treated with 3 coats of wax (⊥20 °: 0.80, ⊥60 °: 4.78, ⊥85 °: 6.08 and ║20 °: 0.75, ║60 °: 5.44, and ║85 °: 9.24). The highest increase rates were observed with the application of 3 coats in all grades and directions wax (⊥20 °: 95.12%, ⊥60 °: 100.81%, ⊥85 °: 568.13% and ║20 °: 150.00%, ║60 °: 106.84%, and ║85 °: 443.53%) (Table 9).
Table 8:Analysis of variance results for glossiness values.

Table 9:Measurement results for glossiness (║ and ⊥, 20o, 60o, and 85o) values.

In the existing literature concerning wax studies, it has been noted that altering the number of applications influences the values of glossiness [magnolia (Magnolia grandiflora L.) [15], olive (Olea europaea L.) [23], ebony Africa (Diospyros crassiflora Hiern.) [9], lemon (Citrus limon (L.) Burm.) [8], American walnut (Juglans nigra L.) [12], American black cherry (Prunus serotina) [30], plum (Prunus domestica L.) [16], ebony Macassar (Diospyros celebica Bakh.) [26].
Conclusion
The ΔE* values were measured as 5.62 for 1 coat of wax, 11.96 for 2 coats of wax, and 10.57 for 3 coats of wax. Wax applications led to decreases in L* and ho values, while showing increases in a*, C*, and b* values. In this study, it has been observed that different results were obtained with the application of varying numbers of wax layers.
References
- Bozkurt AY, Göker Y (1996) Physical and Mechanical Wood Technology, Istanbul University Faculty of Forestry Publications, Publication No: 436, Istanbul, Turkey, pp. 1-374.
- Sönmez A (1995) Durability of paint-varnish layers on wooden surfaces exposed to outdoor effects. TSE, Standard Magazine 34(404): 57-59.
- Şanıvar N (2001) Woodworking Surface Treatments, National Education Printing House, Istanbul, Turkey.
- Bradbear N (2009) Bees and their role in forest livelihoods: a guide to the services provided by bees and the sustainable harvesting, processing and marketing of their products. Non-Wood Forest Products 19: 1-192.
- Liu M, Zhong H, Ma E, Liu R (2018) Resistance to fungal decay of paraffin wax emulsion/copper azole compound system treated wood. International Biodeterioration & Biodegradation 129: 61-66.
- Liu XY, Timar MC, Varodi AM (2019) A comparative study on the artificial UV and natural ageing of beeswax and Chinese wax and influence of wax finishing on the ageing of Chinese Ash (Fraxinus mandshurica) wood surfaces. Journal of Photochemistry and Photobiology B: Biology 201: 111607.
- Akcay C (2020) Determination of decay, larvae resistance, water uptake, color, and hardness properties of wood impregnated with honeybee wax. Bio Resources 15(4): 8339-8354.
- Çamlıbel O, Ayata Ü (2024a) Effects of different coating numbers on selected surface properties in wax coatings applied to lemon (Citrus limon (L.) burm.) surfaces, 5th International Conference on Health, Engineering and Applied Sciences, Roma.
- Çamlıbel O, Ayata Ü (2024b) Evaluating the effects of selected surface characteristics on ebony Africa (Diospyros crassiflora ) wood with different wax applications, Latin America 8th International Conference on Scientific Researches, Havana, Cuba, pp.730-737.
- Lesar B, Humar M (2010) Use of wax emulsions for improvement of wood durability and sorption properties. European Journal of Wood and Wood Products 69: 231-238.
- Zhang JW, Liu HH, Yang, L, Han TQ, Yin Q (2020) Effect of moderate temperature thermal modification combined with wax impregnation on wood properties. Applied Sciences 10(22): 8231.
- Ayata Ü (2024) Investigation of surface changes after coating of American walnut (Juglans nigra) wood with oil-modified beeswax. Pro Ligno 20(2): 3-9.
- Lozhechnikova A, Bellanger H, Michen B, Burgert I, Österberg M (2017) Surfactant-free carnauba wax dispersion and its use for layer-by-layer assembled protective surface coatings on wood. Applied Surface Science 396: 1273-1281.
- Chen C, Chen J, Zhang S, Cao J, Wang W (2020) Forming textured hydrophobic surface coatings via mixed wax emulsion impregnation and drying of poplar wood. Wood Science and Technology 54: 421-439.
- Ayata Ü, Bilginer EH, Çamlıbel O (2024a) Applications of natural and synthetic wax blends on wood surfaces of magnolia (Magnolia grandiflora ). Wood Industry and Engineering 6(1): 9-17.
- Ayata Ü, Peker H, Bilginer EH, Çamlıbel O, Gürleyen L (2024b) Effects of different coating layers on some surface properties of wax-applied plum (Prunus domestica ) wood. Journal of Engineering Faculty 2(1): 2-8.
- Yuqing L, Zhong H, Erni MA (2016) Stress relaxation of paraffin wax emulsion/copper azole compound system treated wood. Agricultural Science & Technology 17(5):1243-1267.
- Vidholdova Z, Slabejova G, Šmidriaková M (2021) Quality of oil-and wax-based surface finishes on thermally modified oak wood. Coatings 11(2): 143.
- Garai RM, Sánchez IC, García RT, Rodríguez Valverde MA, Cabrerizo Vílchez MA, et al. (2005) Study on the effect of raw material composition on water‐repellent capacity of paraffin wax emulsions on wood. Journal of Dispersion Science and Technology 26(1): 9-18.
- Liu J, Kong X, Wang C, Yang X (2023) Permeability of wood impregnated with polyethylene wax emulsion in vacuum. Polymer 281: 126123.
- Piao X, Zhao Z, Guo H, Wang Z, Jin C (2022) Improved properties of bamboo by thermal treatment with wood wax oil. Colloids and Surfaces A: Physicochemical and Engineering Aspects 643: 128807.
- Zhang D, Song K (2023) Effects of photoinitiators on curing performance of wood wax oil coating on wood. Coatings 14(1): 2.
- Peker H, Bilginer EH, Ayata Ü, Çamlıbel O, Gürleyen L (2024) The effects of wax application on certain surface properties of olive (Olea europaea ) wood. Journal of Marine and Engineering Technology, 4(1): 1-10.
- Avramidis G, Scholz G, Nothnick E, Militz H, Viöl W, Wolkenhauer A (2011) Improved bondability of wax-treated wood following plasma treatment. Wood Science and Technology 45: 359-368.
- Janesch J, Arminger B, Gindl-Altmutter W, Hansmann C (2020) Superhydrophobic coatings on wood made of plant oil and natural wax. Progress in Organic Coatings 148: 105891.
- Kaplan Ş, Çamlıbel O, Bilginer EH, Ayata Ü (2024) A study on wax application on ebony Macassar (Diospy roscelebica ) wood. Journal of Green Technology and Environment 2(1): 1-8.
- Zhang L, Yang X, Chen Z, Dong H, Tan Y, et al. (2022) Properties and durability of wood impregnated with high melting point polyethylene wax for outdoor use. Journal of Wood Chemistry and Technology 42(5): 342-351.
- El Hadidi N, Abdel-Monem H, Mohamed M, Hashem G (2020) Retreatment and conservation of a wooden panel previously treated with bees wax. Advanced Research in Conservation Science 1(2): 48-65.
- Wang J, Zhong H, Ma E, Cao J (2018) Properties of wood treated with compound systems of paraffin wax emulsion and copper azole. European Journal of Wood and Wood Products 76: 315-323.
- Ayata Ü, Çamlıbel O (2024) Effects of wax application on color, glossiness, and whiteness index values of American black cherry (Prunus serotina) wood. Les/Wood 73(1): 81-90.
- Moerman D (1998) Native American Ethnobotany Timber Press, ISBN: 0-88192-453-9, Oregon, USA.
- Anonymous (1955) Forest Products Laboratory (US), Wood Handbook; Basic Information on Wood as a Material of Construction with Data for Its Use in Design and Specification (No. 72). US Government Printing Office, USA.
- Shebania AN, van Reenena AJ, Meincken M (2009) The effect of wood extractives on the thermal stability of different wood species. Thermochimica Acta 481(1-2): 52-56.
- Hammond JJ, Donnelly ET, Harrod WF, Rayner NA, Özden F (1969) Woodworking technology, Vocational and Technical Education Books. In: İrfan Z, Ajans T (Eds.), Sanayi, Turkey, pp. 1-554.
- Zwinkels JC, Nöel M (1995) Specular gloss measurement services at the National Research Council of Canada, Surface Coatings International 78(12): 512-516.
- ISO 2813 (1994) Paints and varnishes - determination of specular gloss of non-metallic paint films at 20 degrees, 60 degrees and 85 degrees, International Organization for Standardization, Geneva, Switzerland.
- ISO 554 (1976) Standard atmospheres for conditioning and/or testing, International Standardization Organization, Geneva, Switzerland.
- ASTM E313-15e1 (2015) Standard practice for calculating yellowness and whiteness indices from instrumentally measured color coordinates, ASTM International, West Conshohocken, Pennsylvania, USA.
- ASTM D 2244-3 (2007) Standard practice for calculation or color tolerances and color, differences from instrumentally measured color coordinates, ASTM International, West Conshohocken, Pennsylvania, USA.
- Lange DR (1999) Fundamentals of Colourimetry - Application Report No. 10e, New York, USA.
- DIN 5033 (1979) German standards, color measurement. Color Standards Committee (FNF) in the DIN German Institute for Standardization eV, Beuth, Berlin March, Germany.
© 2024 Umit Ayata. This is an open access article distributed under the terms of the Creative Commons Attribution License , which permits unrestricted use, distribution, and build upon your work non-commercially.
Editor In Chief


.jpg)


Signup for Newsletter

Quick Links
 Editorial Board Registrations
 Submit your Article
 Refer a Friend
 Advertise With Us
Our Recent Edition

.jpg)


Top Editors


.jpg)


.bmp)
.jpg)
.png)
.jpg)


.jpg)


.png)

.png)


.png)


Financial Support

Sponsors

Latest e-Books

Latest Video

 a Creative Commons Attribution 4.0 International License. Based on a work at www.crimsonpublishers.com.
Best viewed in
a Creative Commons Attribution 4.0 International License. Based on a work at www.crimsonpublishers.com.
Best viewed in