
- About Us
- Information
-

The Author ensures that the research has been conducted responsibly and ethically with adherence to all relevant regulations. read more..
- For Authors
- For Reviewer
- Manuscript Guidelines
- Membership
- Publication Ethics
-
- Journals
- Reprints
- e-Books
- Videos
- Policies
- Contact Us
 COVID-19
- Submissions


Full Text
Journal of Biotechnology & Bioresearch
Appraisement of Genetic Variability and Character Association of Bitter Gourd (Momordica charantia L.) Land Races for Yield and Yield Contributing Characters in Bangladesh
Ziaul HT1, Hasan Khan M2*, Anjan Kumar D2, Eftekhar M2, Najmul Hasan G2, Sharmin Sultana1 and Mozahid1
1Department of Genetics and Plant breeding, Bangladesh
2Scientific Officer, Bangladesh
*Corresponding author:Hasan Khan M, Scientific Officer, Plant Breeder, Bangladesh
Submission: August 21, 2018;Published: January 22, 2019
Volume1 Issue4January,2018
Abstract
A field experiment was conducted with 20 genotypes of bitter gourd (Momordica charantia L.) at the experimental field of Sher-e-Bangla Agricultural University, Dhaka, to study the variability among the genotypes for yield and yield contributing characters, estimate genetic parameters, association among the characters and their contribution to yield during April 2015 to September 2015. There was a great deal of significant variation for all the characters among the genotypes. Considering genetic parameters high genotypic co-efficient of variation (GCV) was observed for fruit weight, yield per plant and fruit length whereas low genotypic co-efficient of variation (GCV) was observed for nodes per vine, days to first male and female flowering. In all the cases, it was found that phenotypic co-efficient of variation was greater than genotypic co-efficient of variation which indicated a wide variability among the genotypes and offered better scope of selection. The accession G9 and G13 were the lowest vine length of 3.90m while G8 was the maximum vine length for 4.83. The minimum and maximum branches per vine were required by the genotypes G3 and G4, respectively. The maximum nodes per vine (87.33) were recorded by the genotype G9 and the lowest nodes per vine (78.00) were recorded by G19. The earliest male flowering was recorded in G17 and G2 genotype showed the late flowering. The maximum fruit length was recorded in the genotype G7 and minimum fruit length in the genotype G1.
The maximum fruit diameter was recorded in the genotype G1 and the minimum fruit diameter in the genotype G4. The minimum fruit weight was recorded by the accession G4 and accession G16 showed the maximum fruit weight. The line G2 showed the minimum fruits per plant and the maximum fruits per plant were recorded in the accession G9. The highest fruit yield per plant was recorded by the accession G19 while accession G14 showed the lowest fruit yield per plant. High heritability (>60%) was observed for the characters like vine length, branches per vine, nodes per vine, fruit length, fruit weight, fruits per plant and fruit yield per plant. The high heritability coupled with high genetic advance in percent of mean observed in branches per vine, fruit length, fruit weight and fruit yield per plant suggested that effective selection may be done for these characters. Fruit yield per plant showed the highest positive direct effect (0.88) with branches per plant. Firstly, genotypes G19, G9, G12 and G4 could be included in the furthest study in view of fruit yield for releasing as bitter gourd verities. Secondly the maximum variability found for branches per vine, fruit length, fruit weight and fruit yield per plant. So, selection based on these characters could be effective for the improvement of bitter gourd yield.
Keywords: Bitter gourd (Momordica charantia); Variability; Yield; PCV; GCV; Heritability; Genetic advance
Introduction
Bitter gourd (Momordica charantia L.); is an important monoecious and cross-pollinated vegetable crop of the family Cucurbitaceae grown in Bangladesh. It is locally known as karala/ uchha. It is extensively cultivated throughout the country under two situations i.e. rainy season (July to August) and summer season (Febuary to March). According to [1]; bitter gourd is believed to have originated in the tropics of the old world and is widely distributed in China; Malaya; India; tropical Africa and certain other countries. In terms of nutritive value; bitter gourd ranks first among cucurbits; the most important nutritional contribution being vitamins and minerals especially iron; phosphorus and ascorbic acid. Fruit also contains two alkaloids momordicin and cucurbitacin; momordicin is the momordicosides glycosides of tetracyclic triterpinoides with cucurbitane skeleton [2]. Bitter gourd contains a reasonable amount of different nutrients such as proteins; carbohydrates; fats; minerals and vitamins A; B2; and C etc. [3]; reported very high amount of vit. C (95mg/100g) and protein (16.5%) found in some Indian bitter gourd variety. The fruits are bitter to taste due to the presence of substance called cucurbitacin. Bitter gourd is also reported to use against diseases like paralysis; indigestion and vomiting pain and diabetes [4].
Fruits and other part of bitter gourd are reported to have cooling; stomachic; appetitising; carminative; antipyrietic; antihelminthic; aphrodisiac and vermifuge properties [5]. Various medicinal uses with clinical properties of insulin have been isolated from this species [6]. Among the traditional vegetables bitter gourd occupied important position in export trade. The fruits are used as fried; stuffed; dried and pickled [7]. However; inspite of its importance; adoptability and export potential; research priority given to this crop is quite meagre especially on genetic improvement. Among the cucurbits; it is considered a prized vegetable because of its high nutritive values especially ascorbic acid and iron [8]. A compound known as charatin present in the bitter gourd is used in the treatment of diabetes to lower blood sugar levels [9]. During; 2011- 2012 bitter gourds were grown over an area of 9311.74 hectares and its annual production was 46000Mt [10].
During 2013; bitter gourds were grown over an area of 24000acres; it’s per acre yield 2177kg and annual production was 52000ton. In Bangladesh; vegetable production is not evenly distributed throughout the year and most of the vegetable are produced during winter [11]. Hence there is a severe deficiency of vegetables during summer season due to adverse climatic conditions [12-14]. The bitter gourd production can meet up the crisis. It grows more or less in every area of Bangladesh. Young shoots and leaves are extensively used as vegetable in the Philippines where the plants are found in the wild in waste places. The juice of the leaves and fruits of bitter gourd has been used as an anthelmintic; and is applied externally for malignant ulcers [15]. Leaves are also used traditionally in the treatment of breast cancer. Bitter gourd may contribute to the nutritional shortage of the people of Bangladesh.
Particularly; it can provide added proteins; minerals and vitamins to the diet. Although bitter gourd is an important vegetable crop; there is no recommended variety in Bangladesh and very little is known about its improvement practice. The considerable increases in bitter gourd production is no doubt remarkable; but the fact remains that the bitter gourd growers are surrounded with a number of problems; like the pests and diseases; high labour charge etc. Very few research works relating to diversity of bitter gourd have been conducted in Bangladesh. So; intensive research efforts are needed in several areas; particularly; selection of superior genotypes. There are a lot of variability among the existing bitter gourd germplasm of Bangladesh. An understanding of the nature and magnitude of the variability among the genetic stocks of bitter gourd is of prime importance for the breeder. A good knowledge of genetic wealth might also help in identifying desirable cultivars for commercial production. Because of its nature of high cross pollination; hardly any genetically pure strain is available to the growers.
Among the local cultivated varieties; a wide range of genetic variability exists in this crop which can be exploited for its improvement. The basic key to a breeder is to develop high yielding varieties through selection; either from the genotypes or from the segregates of a crop. Expression of different plant character is controlled by genetic and environmental factors. So; the study of genetic parameters is necessary for a successful breeding program which will provide valuable information on the mode of inheritance of different characters which would be useful in selecting plants desirable characters to develop new varieties of bitter gourd in the country. In a hybridization program knowledge of interrelationship among and between yield and yield components is necessary. Thus; determination of correlation between the characters is a matter of considerable importance in selection. Based on the information; the present study was undertaken to know the yield potentiality of genotypes and to screen out the suitable parental groups which are likely to provide superior segregates on hybridization.
Material and Methods
This chapter deals with the major information regarding materials and methods that were used in conducting the experiment. It consists of a short description of locations of the experimental site; characteristics of soil; climate; materials; layout and design of the experiment; land preparation; manuring and fertilizing; transplanting of seedlings; intercultural operations; harvesting; data recording procedure; economic and statistical analysis etc. The research work relating to determine the genetic diversity of bitter gourds was conducted at the Sher-e-Bangla Agricultural University Farm; Dhaka-1207 during April 2015 to September 2015. Soil of the experimental site belongs to the general soil type; Shallow Red Brown Terrace Soils under Tejgaon Series. Top soils were clay loam in texture; olive-gray with common fine to medium distinct dark yellowish brown mottles. Soil pH ranged from 6.0-6.6 and had organic matter 0.84%. Experimental area was flat having available irrigation and drainage system and above flood level. Twenty genotypes of bitter gourd were used for the present research work. The purity and germination percentage were leveled as around 100 and 80; respectively. The genetically pure and physically healthy seeds of these genotypes were collected from Plant Siddiq Bazar; Gulistan; Dhaka; Narayanganj local market; Dhaka; Agargaon local market; Agargaon; Dhaka; Kawran bazar; Dhaka. The name and origin of these genotypes are presented in.
The experiment was laid out Randomized Complete Block Design (RCBD) with three replications. The genotypes were distributed into every plot of each block of the prepared layout of the experiment. The individual plot was 3m×1m in size. The twenty genotypes of the experiment were assigned at random into plots of each replication. The distance maintained spacing row to row 50cm and plant to plant 2m. The distance maintained between two blocks was 1m. After final land preparation; pits of 5cm×50cm×45cm were prepared in each plot with a spacing of a spacing of 3m×1m. Pits were kept open in the sun for 7 days to kill harmful insect and microorganisms. To control field cricket 5mg Furadan was also mixed with the soils of each pit before making it ready for dibbling. The following doses of manure and fertilizers were applied to the plots for ridge gourd cultivation [16]. Total cowdung; half of TSP and one third MOP were applied in the field during final land preparation.
Remaining TSP and one third MOP and whole gypsum and zinc oxide and one third of urea were applied in pit one week prior to transplantation. Remaining urea and MOP were applied as top dressing in four installments at 20; 40; 60 and 75 days after transplanting. Several weeding and mulching were done as per requirement. At the very first stage weeding was done for ease of aeration and less competition seedling growth and mulch was provided after an irrigation to prevent crust formation and facilitate good aeration.
At the seedling stage red pumpkin beetle attacked tender leaves and also after the initial stage they attacked plants several times for this Marathon and Ripcord was sprayed in the field. In mature stage fruit fly caused severe damage to the fruit. For protection from fruit fly; MSGT (Mashed Sweet Gourd Trap) and Pheromone bait was used along with ripcord; sevin powder.
Fruits were picked on the basis of horticultural maturity; size; colour and age being determined for the purpose of consumption as the fruit grew rapidly and soon get beyond the marketable stage; frequent picking was done throughout the harvesting period. Data were recorded on Days to first male flowering; Days to first female flowering; Vine length (m); Number of nodes per vine; Branches per vine; Fruit length (cm); Fruit diameter (cm); Number of fruits per plant; Weight per fruit (g); Yield per plant (kg) parameters from the studied plants during the experiment. The details of data recording are given below on individual plant basis (Table 1 & Figure 1).
Figure 1:Field view of the experiment.

Table 1:Name and origin of twenty Bitter gourd genotypes used in the present study.

Statistical Analysis
Mean data of the characters were subjected to multivariate analysis. Univariate analysis of the individual character was done for all characters under study using the mean values [17] and was estimated using MSTAT-C computer programme. Duncan’s Multiple Range Test (DMRT) was performed for all the characters to test the differences between the means of the genotypes. Mean; range and co-efficient of variation (CV%) were also estimated using MSTAT-C.
Estimation of genotypic and phenotypic variances
Genotypic and phenotypic variances were estimated according to the formula given by [18]
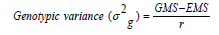
Where;
GMS = Genotypic mean sum of square
EMS = Error mean sum of square
r = number of replications
Phenotypic variance (s2ph) =s2g + EMS
Where;
s2g = Genotypic variance
EMS = Error mean sum of square
s2e = Error variancea
Estimation of genotypic and phenotypic co-efficient of variation
Genotypic and phenotypic co-efficient of variation were calculated by the formula suggested by [19]
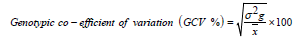
Where;
s2g = Genotypic variance
x = Population mean
Similarly the phenotypic co-efficient of variation was calculated from the following formula.
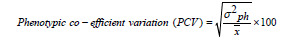
Where;
s2ph= Phenotypic variance
x = Population mean
Estimation of genotypic and phenotypic correlation coefficient
For calculating the genotypic and phenotypic correlation coefficient for all possible combinations the formula suggested by [20,21] were adopted. The genotypic co-variance component between two traits and have the phenotypic co-variance component were derived in the same way as for the corresponding variance components. The co-variance components were used to compute genotypic and phenotypic correlation between the pairs of characters as follows:
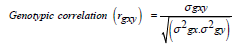
Where;
sgxy =Genotypic co-variance between the traits x and y
s2gx =Genotypic variance of the trait x
s2gy =Genotypic variance of the trait y
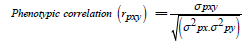
Where;
spxy =Phenotypic covariance between the traits x and y
s2px =Phenotypic variance of the trait x
s2py =Phenotypic variance of the trait y
Estimation of heritability
Broad sense heritability was estimated [22] by the following formula; suggested by [18]

Where;
h2b = Heritability in broad sense
s2g = Genotypic variance
s2ph = Phenotypic variance
Estimation of genetic advance
The expected genetic advance for different characters under selection was estimated using the formula suggested by [18,21].
Genetic advance (GA) = K. h2. sph

Where;
K = Selection intensity; the value which is 2.06 at 5% selection intensity
sph =Phenotypic standard deviation
h2b = Heritability in broad sense
s2g = Genotypic variance
s2ph = Phenotypic variance
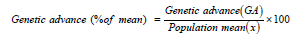
Estimation of genetic advance mean’s percentage
Genetic advance as percentage of mean was calculated from the following formula as proposed by [21]:
Result and Discussion
This chapter comprises the presentation and discussion of the findings obtained from the study. The data pertaining to 20 bitter gourd genotypes as well as yield and its contributing characters were computed and statistically analyzed and the results thus obtained are discussed below under the following heads:
Analysis of variance
The analysis of variance indicated significantly higher amount of variability among the genotypes for all the characters studied viz.; vine length; branch per vine; nodes per vine; days to first male flowering; days to first female flowering; fruit length; fruit diameter; fruit weight; fruits per plant and fruits yield per plant. The variation due to replication was non-significant for all the characters studied.
Genetic variability; heritability and genetic advance
The estimates of mean; range; genotypic and phenotypic coefficients of variation; heritability; genetic advance and genetic advance as per cent mean for all the characters were studied and the results. The mean performance of bitter gourd genotypes for various growth characters and yield components are presented in (Figure 2 & 3) (Table 2 & 3).
Figure 2:Genotypic and phenotypic variability in bitter gourd.

Figure 3:Heritability and genetic advance over mean in bitter gourd.

Table 2:Analysis of variance of different characters in Bitter Gourd.

** Correlation is significant at the 0.01 level. DFMF: Days to first male flowering, DFFF: Days to First Female Flowering, VL: Vine Length (M), BPV: Branches Per Vine, NPV: Nodes Per Vine, FL: Fruit Length (cm), FD: Fruit Diameter (cm), FPP: Fruits per plant, FW: Fruit weight (g), FYP: Fruits yield per plant (Kg)
Table 3:Estimation of genetic parameters in ten characters of 20 genotypes in Bitter Gourd.

** Correlation is significant at the 0.01 level. DFMF: Days to first male flowering, DFFF: Days to first female flowering, VL: Vine length (M), BPV: Branches per vine, NPV: Nodes per vine, FL: Fruit length (cm), FD: Fruit diameter(cm), FPP: Fruits per plant, FW: Fruit weight (gm), FYP: Fruits yield per plant (Kg), MS: mean sum of square, CV (%): Coefficient of variation, σ2p: Phenotypic variance, σ2g: Genotypic variance and σ2 e: Environmental variance.
Mean sum of square for days to first male flowering was highly significant (Table 2) indicating existence of considerable difference for this trait. The maximum days to first male flowering was found 60 and the minimum was recorded 50 with the mean value 53.9. Significant difference of genotypes for this character was found and that was almost similar with [23] in bitter gourd and [24] in snake gourd. Days to male flowering was earlier than days to female flowering and this finding supported the findings of [23,25] in bitter gourd. The genotype G17 was the earliest to flower (50.00 days) while G2 was late to flower (60.00 days). The PCV and GCV were 6.09 and 3.89 percent; respectively. The heritability estimates were moderate 40.70 percent with low genetic advance over percentage of mean 5.11 percent were observed for this trait. The maximum days to first female flowering was found 65.33 and the minimum was recorded 55 with the mean value 61.38. The value ranged from 55.00 to 65.33 days G12 and G1. The PCV and GCV were 6.26 and 4.33 percent with overall mean of 61.38 days.
The heritability estimates were moderate (47.78%) with low genetic advance over mean of 6.16 percent. The grand mean vine length recorded was 4.27m. It ranged from 3.90m to 4.83m. It was varied from 3.035 to 7.85 as reported by [26]. The analysis of variance revealed highly significant differences among the genotypes with respect to vine length. The maximum vine length (4.833m) was recorded by the genotype G8 and the lowest (3.9m) was recorded by both in G9 and G13. The PCV and GCV were 5.95 and 5.57 percent respectively. Narrow difference between GCV and PCV for this trait indicated the less environmental influence. The estimates of heritability were high (87.35) percent with an expected genetic advance in percent mean (10.72). High heritability indicated effectiveness of selection based on this trait and it supported by [27] findings. The number of nodes per vine were ranged from 78.00 to 87.33 with mean of 82.78 (Table 3).
The minimum numbers of nodes per plant were observed in genotype G19 while the maximum numbers of nodes per plant were found in the genotype G9. The coefficients of variability at phenotypic and genotypic level were 3.29 and 2.60 percent respectively. Narrow difference between GCV and PCV for this trait indicated the less environmental influence. The values for heritability were moderate 62.71with low genetic gain 4.25 percent. It ranged from 30.00 to 43.67 with a mean value of 37.82 (Table 3). The maximum numbers of branches were recorded in G4 and G3 genotypes showed the minimum number of branches. The PCV and GCV observed were 10.54 and 9.81 percent respectively. Narrow difference between GCV and PCV value for this trait indicated the less environmental influence. High heritability 86.58 percent coupled with high genetic advance over percentage of mean 18.80 percent were noticed. The mean fruit length noticed was 20.04cm with a range of 14.37 to 26.00cm. Significant variation also observed by [28] in Bitter gourd. The genotype G1 showed the minimum fruit length and the maximum fruit length was recorded in the accession G7. The values of 16.54 and 14.34 are noticed for PCV and GCV. Narrow difference between GCV and PCV for this trait indicated the less environmental influence. Similar minimum difference between GCV and PCV were reported by [29] in bottle gourd.
The heritability estimate was high 75.22 percent with high genetic advance over mean of 25.62 percent could be noted. Photograph showing variation in fruits among different genotypes of Bitter gourd. The grand mean of fruit diameter recorded was 13.23cm. It ranged from 11.30cm to 15.37cm (Table 3). The analysis of variance revealed highly significant differences among the genotypes with respect to fruit diameter. The maximum fruit diameter (15.37cm) was recorded by the genotype G1 and the lowest fruit diameter (11.30cm) was recorded by G4. The PCV and GCV were 10.30 and 5.32 percent respectively. The estimates of heritability were low at 26.61 percent with genetic advance over mean also low 5.65. A wide variation was found among the genotypes for the fruits per plant. It varied 16.67 to 26.00 significantly among the genotypes with an overall mean of 21.93. The entry G2 showed the lowest fruits per plant and the highest fruits per plant was recorded by the entry G9. The PCV and GCV were 13.66 and 11.36; respectively. Narrow difference between GCV and PCV for this trait indicated the less environmental influence. The high heritability estimates of 69.18 percent with moderate genetic advance over mean of 19.47 percent were noticed for fruits per plant (Table 4) (Figure 4 & 5).
Figure 4:Photograph showing variation in fruits among different genotypes of bitter gourd.

Figure 5:Photograph showing variation in fruits among different genotypes of Bitter gourd.

Table 4:Estimation of genetic parameters in ten characters of 20 genotypes in Bitter Gourd.

DFMF: Days to first male flowering, DFFF: Days to first female flowering, VL: Vine length (M), BPV: Branches per vine, NPV: Nodes per vine, FL: Fruit length (cm), FD: Fruit diameter (cm), FPP: Fruits per plant, FW: Fruit weight (g), FYP: Fruits yield per plant (Kg), PCV: Phenotypic coefficient of variation, GCV: Genotypic coefficient of variation, ECV: Environmental coefficient of variation.
Fruit weight ranged from 81.67 to 183.33g with a mean of 108.22g. The minimum fruit weight was recorded by the accession G4 and accession G16 showed the maximum fruit weight. This result was almost similar with [30] findings and they found the maximum fruit weight from Local (189g) in sponge gourd. The PCV and GCV obtained were 23.70 and 21.40 percent; respectively. Narrow difference between GCV and PCV for this trait indicated the less environmental influence. The values of high heritability (81.53%) along with high genetic advance as percent mean (39.81%) were observed for this trait (Table 4). High values of variability; PCV; GCV; heritability and genetic advance have recorded for this trait indicating that this character was controlled by additive gene effects and this finding were supported by [31,32] in Luffa acutangula in pumpkin. The mean fruit yield per plant noticed was 2.28kg with a range of 1.70 kg to 3.07 kg in the genotype G14 and G19; respectively. Moderate phenotypic coefficient of variability (17.46%) and genotype coefficient of variability (13.93%) along with high heritability (63.65%) and genetic advance as percent mean (22.91) were recorded (Table 4). High heritability coupled with high genetic advance was observed by [32] in pumpkin (Table 5).
Table 5:Mean performance of various growth parameter and yield components.

VL: Vine length (M), BPV: Branch per vine, NPV: Nodes per vine, DFMF: Days to first male flowering, DFFF: Days to first female flowering, FL: Fruit length (cm), FD: Fruit diameter (cm), FW: Fruit weight (g), FPP: Fruits per plant, FYP: Fruits yield per plant (Kg)
Correlation analysis
The study of yield components and their inter relationship along with yield and their direct and indirect contribution to yield is of immense importance. Yield is the resultant of combined effect of several component characters and environment. Understanding the interaction of characters among themselves and with environment has been of great use in the plant breeding. Correlation studies provide information on the nature and extent of association between only two pairs of metric characters. From this it would be possible to bring about genetic up gradation in one character by selection of the other of a pair; obviously; knowledge about character associations will surely help to identify the characters to make selection for higher yield with a view to determine the extent and nature of relationship prevailing among yield contributing characters. Hence; an attempt has been made to study the character association in the bitter gourd accessions at both the levels. Association of yield components with fruit yield at genotypic and phenotypic level was depicted in (Figure 5).
Fruit yield per plant Vs. yield components
A highly significant and positive association of fruit yield per plant at both the genotypic and phenotypic levels was observed with branches per vine (0.378** and 0.336**) and fruits per plant (0.346** and 0.143). These results were supported by [33-35]. Direct selection of genotype based on such characters in different. Therefore; selection for any of these highly associated characters with fruit yield per plant will indirectly help in selecting the plants with high yield. Hence; it is worthwhile to have genotypes with higher branches per plant; higher fruits per plant to get higher yields. These results suggested that the branches can advantageously be used as criteria for selection. Hence; selection for any of these traits would improve the other traits. Vine length (0.026 and 0.041) and fruit weight (0.117 and 0.118) had shown insignificant positive association with fruit yield per plant at both the levels and it was similar with the findings of [36,37]. Nodes per vine (-0.620** and -0.423**) and days to first female flowering (-0.539** and -0.103) had significant negative association and days to first male flowering (-0.232 and -0.271*); fruit length (-0.062 and -0.072) and fruit diameter (-0.231 and -0.023) had negative association with fruit yield per plant. Significantly and negatively correlated of days to first male and female flower appearance with yield was reported by [38].
Correlation among yield components
Days to first male flowering had positive and highly significant correlation with days to first female flowering (0.574**) and nodes per vine (0.410**) at genotypic level. It also exhibited positive association with fruit length (0.244 and 0.192) and vine length (0.039 and 0.020) at both genotypic and phenotypic levels. It had a negative and significant association with only fruits per plant (-0.606** and -0.350**) at both the levels. Days to first female flowering had a positive and highly significant correlation with nodes per vine (0.338**) and days to first male flowering (0.574**) at genotypic level. This character also showed significant and negative correlation with fruits per plant (-0.368** and -0.262*) at both levels and with fruit weight (-0.262*) at genotypic level. Vine length showed significant and positive correlation with fruit diameter (0.313*) at genotypic level. It showed positive association with other trait namely days to first female flowering (0.142 and 0.038); fruit length (0.137 0.163); fruit weight (0.171 and 0.181) and fruits per plant (0.166 and 0.181) at both the levels.
Figure 6:Genotypic & Phenotypic Correlation Coefficient for 9 yield contributing characters with yield of Bitter Gourd.

Nodes per vine had highly significant and positive correlation with days to first male flowering (0.410**) and days to first female flowering (0.338**) at genotypic level. It had positive correlation at both levels with fruit length (0.196 and 0.143) and fruit diameter (0.084 and 0.026) and vine length (0.013 and 0.038). An insignificant negative correlation of nodes per vine with Fruits per plant (-0.251 and -0.133) and branches per vine (-0.156 and -0.091) at both levels. The correlation of branches per vine with fruits per plant (0.243 and 0.276) was positive and non-significant at genotypic and phenotypic level [39]. It had insignificant and negatively correlation with days to first male flowering (-0.234); days to first female flowering (-0.173); fruit length (-0.150); fruit diameter (-0.182) and node per vine (-0.156) at both the genotypic level. Fruit length showed highly significant and positive correlation with fruit weight (0.828** 0.743**) at both levels and positive association with vine length (0.137 and 0.163); nodes per vine (0.196 and 0.143) and days to first male flowering (0.244 and 0.192) at genotypic and phenotypic levels (Table 6 & 7) (Figure 6).
Table 6:Genotypic correlation coefficients among different pairs of yield and yield contributing characters for different genotype of bitter gourd.

**: Significant at 1%., *: Significant at 5%. DFMF: Days to first male flowering, DFFF: Days to first female flowering, VL: Vine length (M), BPV: Branches per vine, NPV: Nodes per vine, FL: Fruit length (cm), FD: Fruit diameter (cm), FPP: Fruits per plant, FW: Fruit weight (g), FYP: Fruits yield per plant (Kg).
Table 7:Phenotypic correlation coefficients among different pairs of yield and yield contributing characters for different genotype of bitter gourd.

**: Significant at 1%., *: Significant at 5%. FMF: Days to first male flowering, DFFF: Days to first female flowering, VL: Vine length (M), BPV: Branches per vine, NPV: Nodes per vine, FL: Fruit length (cm), FD: Fruit diameter(cm), FPP: Fruits per plant, FW: Fruit weight (g), FYP: Fruits yield per plant (Kg).
It was negative association with fruit diameter (-0.237 and -0.196); branches per vine (-0.150 and -0.176) and days to first female flowering (-0.142 and -0.162) at both genotypic and phenotypic levels (Table 6 & 7). Fruit diameter had significant and positive association with vine length (0.313*) at genotypic level (Table 6) and it had insignificant and positive association with fruit weight (0.220 and 0.219) at both levels and with fruits per plant (0.158) and days to first female flowering (0.153) at genotypic level [40]. Fruits per plant had positive association with vine length (0.166 and 0.181); branches per vine (0.243 and 0.276) and fruit weight (0.124 and 0.153) at both levels. It showed significant and negative correlation with days to first male flowering (-0.606** and -0.350**) and days to first female flowering (-0.368** and -0.262*) at both the genotypic and phenotypic levels. Fruit weight showed highly significant and positive association with fruit length (0.828** and 0.743**) at both the genotypic and phenotypic levels [41].
Conclusion
The high heritability coupled with high genetic advance in percent of mean observed in branches per vine; fruit length; fruit weight and fruit yield per plant. Hence; yield improvement in bitter gourd would be achieved through selection of these characters. The characters of branches per vine and fruits per plant showed significant and positive correlation with fruit yield per plant at both genotypic and phenotypic levels. This result suggested that fruit yield per plant can be increased by improving these characters. The branches per vine; fruit length and fruit diameter showed positive direct effect on yield. So, yield improvement was associated with these characters. The genotypes G19; G9; G12 and G4 could be included in the furthest study in view of fruit yield for releasing as bitter gourd verities. The maximum variability found for branches per vine; fruit length; fruit weight and fruit yield per plant. So, selection based on these characters could be effective for the improvement of bitter gourd yield.
References
- Chakravatry HL (1959) Monograph on Indian Cucurbitaceae records. Bot Survey India 17(1): 86-90.
- Chandra V, Subhash CM (1990) Sub cellular distribution of momordicine- II in Momordicacharantia leaves. Indian J Exp Biol. 28(2): 185-186.
- Rajasekaran LR, Shanmugavalu KG (1984) MDU1 bitter gourd. South Indian Hort 31(1): 47-48.
- Meir P, yaniv Z (1985) An in vitro study on effect of (Momordica charantia L.) on glucose uptake and glucose metabolism in rats. Plants Medica 1: 12-16.
- Blatter E, Caius JF, Mahaskar KS (1935) Indian medicinal plants. (2nd edn), M/S Bishan Singh, Dehradun, India, pp. 1130-1132.
- Baldwa VS, Bhandari CM, Pangaria A, Goyal RK (1977) Clinical trial in patients with diabetes mellitus of an insulin like compound obtained from plant source. Ups J Med Sci 82(1): 39-41.
- Morton JF (1967) The balsam pear an edible medicinal and toxic plant. Economic Botany 21(1): 57-68.
- Behera GW (2004) Quantitative inheritance in grasses. Proc 6th Intl Grassland Cong, 1: 277-283.
- Shetty KS, Rao MR (2005) Nutritive value of Indian food. Indian Council of Medical Research, National Institute of Nutrition, Hyderabad. South Indian Hort, India, 32(2): 97-100.
- BBS (2012) Year book of agricultural statistics of Bangladesh, (2013). Bangladesh Bureau of Statistics (BBS), Ministry of Planning. Govt. of the People’s Republic of Bangladesh, p.29.
- Quashem (2003) A comparative study on the growth, sex expression and yield of four cultivars of Cucurbita moschata. J Asiatic Soc Bangladesh Sci 21(2): 227-232.
- Chowdhury ML, Mandal G (1993) Correlation and path analysis in cucumber (Cucumis sativus L.). Haryana J Hort Sci 16(3-4): 269-273.
- Ali M, Mian AK, Mamun EA (1993) Improvement of some cucurbits: In: breeding high female bitter less cucumber. Proc Workshop Res, IPSA, Gazipur.
- Rashid MM (1999) Sabgi biggan. Rashid Publishing House, Dhaka, Bangladesh, p. 303.
- Oliver Bever (1982) Medicinal plants in tropical West Africa I. Plants acting on the cardiovascular system. Journal of Ethnopharmacology 5(1): 1-72.
- Anonymous (1991) Basat barite sabji Utpadan. BARI, Gazipur, Bangladesh, p. 239.
- Singh RK, Chaudhury BD (1985) Biometrical methods of quantitative genetic analysis. Haryana J Hort Sci 12(2): 151-156.
- Johnson HW, Robinson HF, Comstock RE (1955) Estimates of genetic and environmental variability in soybeans. Agron J 47: 314-408.
- Burton GW (1952) Quantitative inheritance in Grasses. Proc 6th Int, Grassland Cong, 1: 277-283.
- Miller PJ, Williams JC, Robinson HF, Comstock RE (1958) Estimation of genotypic and environmental variance and co-variance in upland cotton and their implications in selection. Agron J 50: 126-131.
- Hanson CH, Robinson HF, Comstock RE (1956) Biometrical studies of yield in Segregation population of Korean Lespedza. Agron J 48: 268- 272.
- Lush JL (1943) Animal Breeding Plans. Iowa State Press, Ames, Iowa, P. 437.
- Rahman MM, Dey SK, Wazuddin M (1990) Yield, yield components and plant characters of several bitter gourd, ribbed gourd, bottle gourd and sweet gourd genotypes. BAU Res Prog 4: 117-127.
- Banik BR (2003) Inheritance pattern in snake gourd (Trichosanthes anguina L.). Bangabandhu Sheikh Mujibur Rahman Agricultural University, Gazipur, Bangladesh, pp. 1-60.
- Rahman MM, Dey SK, Wazuddin M (1991) Study of yield, yield components and vine characters of some cucurbit genotypes. BAU Res Prog 5: 75-86.
- Varghese P (1991) Heterosis in snake gourd (Trichosanthes andguina L.). MS Thesis, Kerala Agricultural University. Kerala, India,s pp. 37-60.
- Saha RR, Mitra BN, Hossain AE, Jamaluddin M, Mosiul H (1992) Genetic variability, character association and path co-efficient analysis in pumpkin (Cucurbita moschata L). Bangladesh Hort J 20(1): 59-62.
- Mangal JL, Dixit J, Pandita ML, Sidhu AS (1981) Genetic variability and correlation studies in bitter gourd (Momordica charantia L.). Indian J Hort 38(2): 94-95.
- Rahman AK, Das MK, Haque MM (1986) Variability, correlation and path co-efficient analysis in bottle gourd (Lagenaria vulgaris L.). Bangladesh J Agril 11(3): 13-19.
- Zaman AKM, Masud QM, Rashid MA (2004) Regional yield trial of sponge gourd. HRC Annual Report. Horticulture Research Centre, BARI, Joydebpur, Gazipur, India, p. 39.
- Chowdhury D, Sharma KC (2002) Studies on variability, heritability, genetic advance and correlation in ridge gourd (Luffa acutangula Roxb). Hort J 5(3): 53-58.
- Rumaran S, Walterajan S, Suraj ST (1997) Genetic variability in pumpkin. South Indian Hort J 45 (1&2): 10-12.
- Badade DS, Warade SD, Gaikwad SK (2001) Genetic divergence in Bottle gourd. J Maharashtra Agril Univ 26(2): 137-139.
- Sarkar SK, Marity TK, Som NG (1999) Correlation and path coefficient studies in pointed gourd (Trichosanthes dioica Roxb.). Indian J Hort 56(3): 252-255.
- Kumaran SS, Natarajan S, Thamburoj S (1998) Correlation and path analysis studies in pumpkin (Cucurbita moschata poir.). South Indian Hort 46(3): 138-142.
- Li JW, Sun SR, Rer YH (1997) Study on genetic correlation and path analysis of the main agronomic characters of cucumber. Acta Agril Univ Henanensis 31(3): 244-247.
- Vijay OP (1987) Genetic variability, correlation and path analysis in muskmelon (Cucumis melon L.). Indian J Hort 44(3&4): 233-238.
- Deway DR, Lu KN (1959) A correlation and path coefficient analysis of components of crested wheat grass seed production. Agron J 51: 515- 518.
- Oliver B (1960) Medicinal plants of Nigeria. Nigerian College of Arts, Sci and Technology, Ibadan, Nigeria. Abstract in Economic Bot 38(3): 350- 357.
- Robinson RW, Deeker WD (1997) Cucurbits. University Press, Cambridge London, UK, pp. 14-115.
- BBS (2012) Year book of agricultural statistics of Bangladesh, (2013). Bangladesh Bureau of Statistics (BBS), Ministry of Planning. Govt. of the People’s Republic of Bangladesh, p. 41.
© 2018 Hasan Khan M. This is an open access article distributed under the terms of the Creative Commons Attribution License , which permits unrestricted use, distribution, and build upon your work non-commercially.
Editor In Chief


.jpg)


Signup for Newsletter

Quick Links
 Editorial Board Registrations
 Submit your Article
 Refer a Friend
 Advertise With Us
Our Recent Edition

.jpg)


Top Editors


.jpg)


.bmp)
.jpg)
.png)
.jpg)


.jpg)


.png)

.png)


.png)


Financial Support

Sponsors

Latest e-Books

Latest Video

 a Creative Commons Attribution 4.0 International License. Based on a work at www.crimsonpublishers.com.
Best viewed in
a Creative Commons Attribution 4.0 International License. Based on a work at www.crimsonpublishers.com.
Best viewed in