
- About Us
- Information
-

The Author ensures that the research has been conducted responsibly and ethically with adherence to all relevant regulations. read more..
- For Authors
- For Reviewer
- Manuscript Guidelines
- Membership
- Publication Ethics
-
- Journals
- Reprints
- e-Books
- Videos
- Policies
- Contact Us
 COVID-19
- Submissions


Full Text
Evolutions in Mechanical Engineering
Thermohydraulic Safety Analysis of a Research Reactor by Transport in Porous Media Technique
Mohammad Yaghoub Abdollahzadeh Jamalabadi*
Faculty of Marine Engineering, Chabahar Maritime University, Iran
*Corresponding author:Mohammad Yaghoub Abdollahzadeh Jamalabadi, Faculty of Marine Engineering, Chabahar Maritime University, Iran
Submission: July 17, 2025;Published: July 30, 2025

ISSN 2640-9690 Volume6 Issue2
Abstract
The use of porous media to simplify the thermohydraulic of a nuclear reactor is the topic of recent research. As a case study, the rector of 200kW installed at Missouri University of Science and Technology is modeled in this paper. To help this objective, a fundamental CFD examination was completed to supplement the neutronics investigation on the present reactor. Characteristics of thermal energy removal from a typical research reactor are modeled by numerical thermal transport in porous media. The neutron flux is modeled by the nodal expansion method. For the thermo-hydraulic part, a three-dimensional governing equation is solved by an iterative method to find the steady-state solution of fluid flow and temperature in loss of coolant condition where the heat produced in the reactor core is removed by free convection. The profiles of heat flux for various power levels are benchmarked. Pressure, temperature and velocity contours in the power passage were assessed at 300kW and 500kW power levels. To reduce the computational cost, a porous media approach for the whole geometry was utilized. The numerical results agree with the experimental results. The developed model can be used for safety and reliability analysis for various loss of coolant accidents.
Keywords: Natural convection; Porous media; Two-phase flow; Loss of coolant; Nodal expansion method
Nomenclature: Cp: Specific Heat; k: Thermal Conductivity; K: Permeability of the Porous Medium; q: Heat Flux; Da: Darcy Number; Nu: Nusselt Number; Pr: Prandtl Number u; v: Velocity Vector; P: Pressure; T: Temperature; x, y: Cartesian Coordinates; X, Y: Dimensionless Cartesian Coordinates
Introduction
Heat and mass transfer through porous medium has many applications in science and industry [1,2]. The arranging and planning of the previously mentioned advances depend on numerical displaying. Precise logical arrangements are utilized for the subjective translation of the aftereffects of research facility core flooding and the estimation of the model coefficients. The correlation of the fixation and immersion waves furnished by the logical models with the achievement of colloids and water during core floods or field tests yields a progressively significant comprehension of the vehicle forms. The logical models are additionally generally utilized in three-dimensional repository recreations utilizing streamlined and front-following procedures [3,4]. The accurate count of the power inside that reactor core during transient as fast as in consistent stat is an important problem, from the purpose of structure and security analysis. In practical issues, this Is achieved by comprehending the time subordinate or static hardly any gathering neutron dissemination equations. Solving the reasonable reactor center issues with all its’ geometric and material heterogeneous will be an Intractable issue. Consequently, in the initial step, one divides these values into various areas where the heterogeneity is homogenized utilizing nearby vehicle hypothesis estimations, and normal hardly any gathering dissemination hypothesis, parameters are generated. These homogenized districts are for most of the work gatherings or groups. The subsequent stage Is to fathom the neutron dispersion condition for the given reactor geometry. A wide assortment of numerical techniques as limited contrast, limited component technique and nodal strategies have been created to tackle dispersion conditions depicting reactors with enormous homogeneous districts, limited. Contrast strategy is a characteristic and the most direct technique to explain dispersion conditions.
The above applications have persuaded various examinations on the specific answers for one-dimensional, two-stage multicomponent streams in permeable media. They incorporate self-comparative answers for the persistent infusion of steady creation liquids into arrangements, relating to Riemann issues for protection law frameworks [5-9]. In natural convection analysis of a research nuclear reactor, the objective of CFD (Computational Fluid Dynamics) is to study the flow patterns and heat transfer within the reactor. It helps researchers understand how heat is dissipated and how the coolant circulates naturally without the need for external pumps or fans. This information is crucial for reactor design and safety considerations.
Non-self-comparable answers for the infusion of various arrangement slugs are obtained by the communication of nonstraight hyperbolic waves [10,11]. As of late acquired semisystematic arrangements that represent the slender weight and dissemination depend on the necessary portrayal of the immersion field and fundamentally expand the class of 1-D streams that take into consideration logical displaying [12]. The phenomenological model given by Shadloo MS [13] is planned for normal molecule and pore sizes. Populace balance models represent probabilistic molecule and pore size conveyances [14-21]. The specific arrangement can be acquired for a mono-sized suspension stream in rock with a given pore-size appropriation [22]. The arrangement takes into consideration the averaging of the stream, yielding the speculation of the model [14] that represents the pore volume, distance for limited-size particles and the fragmentary streams by means of the available and unavailable pieces of the permeable space [23]. The stochastic models for single-stage colloidalsuspension streams incorporate the molecule direction figuring [21,24] and arbitrary walk conditions [25-27].
One of the applications of the porous media is the use of a Sodium-Cooled Reactor (SFR). In SFR liquid sodium spills onto the floor may incite the bursting of the steel liner [28]. Along these lines, sodium sodium-strong reaction occurs by direct contact of liquid sodium with assistant concrete. Basic marvels of SCR for prosperity assessment of SFR are hydrogen release, imperatives release by exothermic warmth age and strong evacuation by invention disintegration. SCR involves two reaction stages. The first absence of hydration of concrete and hydrogen release by the reaction of created water seethe with Na as early on stage and the second expulsion of concrete by reactions between strong syntheses and Na blends as helper arrange [29]. In view of porous estimation, it was revealed that the reaction occurs as a snappy reaction straightforwardly after NaOH mellowing at 583K [30]. As needs be, it was ordinary that 2 reaction is prevalent in the time range of the assistant period if the basic proportion of NaOH has been made during the basic stage reaction [31]. Meta sodium silicate was perceived as the huge solid aftereffect of the reaction from the XRD assessment. Considering the stage chart of the reaction system, the likely overall reaction pathway of NaOHSiO2 reaction was discussed [32]. In this paper, a coupled neutronic and CFD analysis is done to model a reactor core through the loss of coolant. Characteristics of thermal energy removal from a typical research reactor are modeled by numerical thermal transport in a porous medium. The established method can be used for safety and reliability analysis for various loss of coolant accidents.
Modeling
The movement of the air pockets is coupled to the progression of the foundation liquid. The foundation liquid is a fluid with a gas on top as shown in Figure 1. The air pockets are expelled after entering the gas stage. A Eulerian VOF strategy saving mass and force through the Navier Stokes conditions is conveyed to figure out the progression of the constant foundation stages. The coupling with the Lagrangian bubbles is accomplished through a source term in the energy condition representing bubble drag. Figure 1 shows the porous medium Cross-section of the reactor.
Figure 1:Porous medium cross-section of reactor.

Neutronic
Figure 2 presents the definition of nodal expansion method on the boundary of a Cartesian 2D Cell. Figure 3 presents the core configuration which its cross-sections of the reactor are given in Table 1. The Cartesian two-dimensional and two-group neutron flux diffusion equations, along with the delayed neutron equations, are used to model and analyze the behavior of neutron flux in nuclear systems. They help us understand how neutrons move and interact within a reactor. These equations take into account factors like neutron diffusion, neutron generation and the effects of delayed neutrons. The Cartesian two-dimensional and twogroup of neutron flux diffusion and delayed neutron equations is presented as:
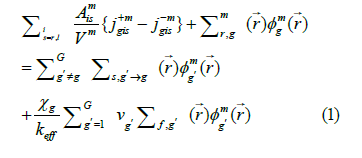
where φmg is the neutron flux, Aism is boundary area of cell, Vm is
volume of cell, j+mgis is the directed current averaged and average net
leakage currents along transverse directions respectively, is the neutron macroscopic removal cross section (absorption
and out scatters plus, if considered, the leakage through the nonmodeled
dimensions)for each group, Σs,g′→g is the neutron
macroscopic scatters cross section, vg,Σf,g' is the neutron fission
cross section, keff is the effective multiplication factor, χg for each
group is defined as:
is the neutron macroscopic removal cross section (absorption
and out scatters plus, if considered, the leakage through the nonmodeled
dimensions)for each group, Σs,g′→g is the neutron
macroscopic scatters cross section, vg,Σf,g' is the neutron fission
cross section, keff is the effective multiplication factor, χg for each
group is defined as:
Figure 2:Definition of nodal expansion method on the boundary of a cartesian 2D cell.

Figure 3:Highly Enriched Uranium (HEU) core: 1 be source, 4 Control rod (C), 14 Fuel elements (F) and 1 half fuel element.

Table 1:Cross-sections of reactor in cm.

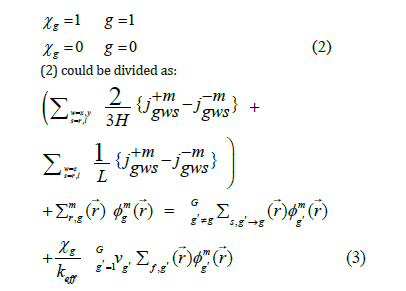
where H and L are dimension of cell. In regular center count, homogenization mistake is caused because of the conservation of just response rate. The brokenness factor which is the proportion of heterogeneous motion to homogeneous motion of the hub, is acquainted with saving both response rate and surface arrived at the midpoint of current at the same time and along these lines stay away from this homogenization blunder. These components are remembered for the connection between active and approaching incomplete flows through one surface of a hub and approaching incomplete current through a similar surface of a neigh boring hub. These elements are to be determined by some cross-section code, before dissemination count. Successful augmentation factor is determined by doing a number of internal and external emphases. In internal emphasis, keeping the parting source consistent, neutron motion is determined from halfway flows which are gotten external emphasis, parting source (F) is refreshed with these motion esteems. The removal cross-sections, Σr , are summation of absorption, Σa and scattering, Σa , as:
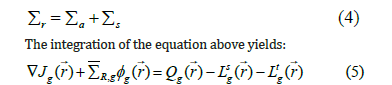
where Σmr,g is the neutron macroscopic removal cross section (absorption and out scatters plus, if considered, the leakage through the non-modeled dimensions) for each group, Q is source term for group g, Lsg and Ltg are leakage terms.
Heat and mass transfer
A sub-channel control volume in a reactor core is a node cell of an assembly. Control volume presentation could be used for mass conservation, axial transverse momentum equations and energy equations. Figure 4 presents the control volume for porous body analysis. When considering the axial flow rate of a selected subchannel control volume, we’re looking at the mass transport within that specific volume. It involves analyzing how the fluid or material is flowing along the axial direction in that particular region. This is important for understanding the distribution of mass and how it affects the overall system behavior. Mass transport for the axial flow rate of the selected sub-channel control volume is:
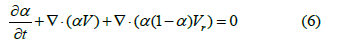
where α is the void volume fraction, and V is velocity. The subchannel control volume for continuity is shown in Figure 5.
Figure 4:Control volumes for porous body analysis.

Figure 5:Subchannel control volume for continuity.

Momentum transport:
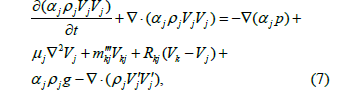
where ρj is the volume density of phase j, p is pressure, μ is the viscosity and mkj′′′ is mass generation, R is the velocity constants for entrained flow. The subchannel control volume for momentum balance is shown in Figure 6.
Figure 6:Subchannel control volume for momentum balance.

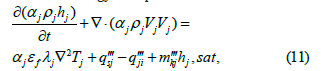
Energy transport:
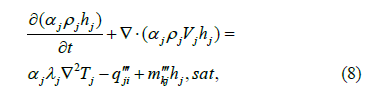
where hj is entalpy of phase j,λj is thermal conductionof phase j,qji′′′ is heat sources from fission,hj, sat, is saturation enthalpy of phase j. Heat transfer is a discipline of thermal engineering that concerns the generation, use, conversion and exchange of thermal energy (heat) between physical systems. Heat transfer is classified into various mechanisms, such as thermal conduction, thermal convection, thermal radiation and transfer of energy by phase changes. Engineers also consider the transfer of mass of differing chemical species (mass transfer in the form of advection), either cold or hot, to achieve heat transfer. While these mechanisms have distinct characteristics, they often occur simultaneously in the same system. Subchannel control volume for energy (enthalpy) balance is shown in Figure 7. The above equation can be re-written for a porous medium as:
Figure 7:Subchannel control volume for energy.

Mass transport:
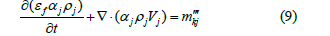
where εf is the porosity. Momentum transport that moves the system towards mechanical equilibrium:
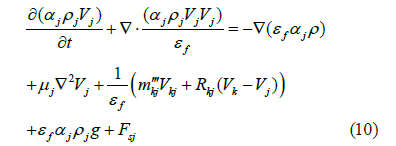
where g is gravity vector and F is body forces comes from porous matrix. Convection heat transfer is energy transport due to bulk fluid motion. Convection heat transfer through gases and liquids from a solid boundary result from the fluid motion along the surface. Since Energy transport in fluid:
Conduction is the process by which heat energy is transmitted through collisions between neighbouring atoms or molecules. Conduction occurs more readily in solids and liquids, where the particles are closer together than in gases, where particles are further apart. Since Energy transport in solid:
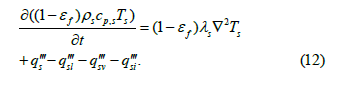
where q is source term is solid.
Numerical Modeling
For the CFD analysis of a nuclear reactor, the mesh sizing can vary depending on the specific requirements of the simulation. It is important to have a well-refined mesh near areas of interest, such as the reactor core or coolant channels, to capture the flow and heat transfer accurately. Typically, a combination of fine and coarse mesh elements is used to balance computational resources and accuracy. The exact mesh sizing would be determined through careful consideration of the reactor geometry, flow conditions and desired level of detail in the analysis. At this moment will first rapidly portray the nodal advancement technique and a short time later give the authentic methodology for the course of action of coming about conditions as executed in the code made here. We will consider just static issues as the code has been done and tested for static issues. Finally, results for various benchmarks will be shown. moreover, differentiated and the available reference results. The above showing thought has been applied to a movement of gas releases from 50m significance. The computational grid was created from a coarse uniform framework which was refined on different occasions towards the point of convergence of the peak as depicted by Olsen and Skjetne [13] with a center objective of 8cm.
Likewise, the stream in the release zone isn’t settled. Because of this the air pocket size close to the release zone didn’t rely upon the stream desires, anyway on a definite fly model [27]. For assessments on length scales, it should be seen that the Kolmogorov length scale moves between 3mm and 5cm in the peak, the sub-grid wild length scale is between 5cm and 1m inside the tuft, and up to 50m in the water outside the peak and the close by mean air pocket size is around 35mm. Table 2 presents a grid convergence study. The used mesh has a total number of 23,876 elements. The following Table demonstrates the application of the above procedures in conducting a grid convergence study. The objective of the CFD analysis was to determine the maximum temperature in the system. The flow field is computed on four grids, each using finer than the previous grid. The number of grid elements in the table below indicates the grid information and the resulting temperature reported and computed from the solutions final. Each solution was properly converged with respect to iterations.
Table 2:Grid convergence study.

Results
Our outcomes unmistakably show that power versus time isn’t steady, restricted to the supposition of MIM. The reactor displays two phases with time. Stage 1, preceding the full advancement of the fixation field in the streaming system: increments as the blending line between the streaming and stale locales is expanding. Stage 2, after the full advancement of the focus field in the streaming immersion, diminishes slowly because of the draining fixation inclination over the interface between the streaming and stale locales. Thus, the ever-diminishing drags out the blending that demonstrates the overestimation of the mass conversion standard in the MIM model.
Figure 8 shows the thermal flux at the reactor versus length. The variable rate coefficient was additionally detailed in the test results, in spite of the fact that the examinations didn’t catch the long-haul conduct of the mass trade because of the brief term of the analyses. Our outcomes bolster the trial study and obviously show that conversion standard shifts with time and immersion.
Figure 8:Validation of results by comparing the heat flux profile at various nuclear power levels.

Figure 9 shows the Cross-sectional temperature profile through the porous region. Our outcomes suggest that the current mass trade models don’t catch the long-haul conduct of blending in the two-stage stream. This comprehension has direct ramifications for altered Saltiness Water Flooding (MSWF) systems. While the infused water can supplant the development of saline solution inhabitants in the streaming locales at a brief timeframe scale, the stale districts will stay filled by the arrangement of salt water for a longer time.
Figure 9:Cross-sectional temperature profile through the porous region.

Figure 10 shows the Cross-sectional velocity profile through the porous region. The high saltiness water in the stale districts will be bit by bit weakened with the infused altered saltiness water, which is constrained by the mass swapping scale. As our outcomes appear, the mass swapping scale coefficient diminishes with time, which can drain the MSWF execution at any longer time scale. Besides, since the measure of dormant immersion shifts with all-out immersion, it is conjectured that the presentation of wettability adjustment would fundamentally change at various immersions. The results of the calculations showed that the maximum temperature in both calculations is sufficiently less than 100 °C, which indicates that without changing the current flow rate of the core, the heat produced can be well removed without two-phase distributions.
Figure 10:Cross-sectional velocity magnitude and vector through the porous region.

As shown in Figure 10 the maximum velocity inside the domain is less than 1m/s which is less than the critical miller velocity rate in the channels between the fuel plates (12m/s). Right now, a clear and thorough meaning of the perceptible fine weight is proposed, which follows normally from the use of the strategy for volume averaging to interface properties in multiphase frameworks. The connection between the naturally visible slender weight and the normal properties of the medium is given by the plainly visible energy balance for the liquid interfaces, in a structure that can be deciphered as a summed-up Young-Laplace condition at the full scale. Figure 11 shows the cross-sectional pressure profile through the porous region. This area incorporates results from the persistent vitality heterogeneous center, the adapted 3-D center, and an adapted 2-D form of the center. All outcomes are from center models using center evenness; that is, they model a 1/12 spiral segment and, for the 3-D designs, a 1/2 hub segment. Eigenvalue results are given for all center setups with their comparing vulnerability. Parting thickness results are additionally displayed. Due to the enormous number of pins in the center, it is unreasonable to list esteems for every single individual pin; in this way, square-level splitting thickness results are given for all squares in each center. Information is exhibited in tables utilizing the square numbering plan introduced in Figure 8. Pressure shown in Figure 11 is in a stratified regime which prevents any further vortex in the system.
Figure 11:Cross-sectional pressure profile through the porous region.

Application of the CFD analysis shows the maximum velocity inside the domain is less than 1m/s which is less than the critical miller velocity rate in the channels between the fuel plates (12m/s). Figure 12 shows the cross-sectional temperature profile through the porous region. Figure 12 contains the square found in the middle value of parting thickness esteems for the entirety of the squares in the heterogeneous center. These qualities have been standardized with the end goal that the normal square in the center has a parting thickness estimation of 1. For the case with all poles out, the vulnerability in the splitting thickness is extended. Pin splitting thickness results for the completely heterogeneous ceaseless vitality centers are excluded, as the peruse may compute these dependent on the determination itemized in the past segment. In the accompanying area, parting thickness esteems are given at the pin level to the adapted multigroup centers, as these are relied upon to be valuable for benchmarking multigroup transport techniques. The results of the calculations showed that the maximum fluid temperature in both calculations is sufficiently less than 100 ℃, which indicates that without changing the current flow rate of the core, the heat produced can be well removed without two-phase distributions.
Figure 12:Cross-sectional temperature profile through the porous region at 500kW..

The calculations demonstrate the natural convection in the system is enough to guarantee of safety for the studied research reactor. As shown maximum temperature reaches about 40 and 60 rice in cases of loading with 300kW and 500kW power without considering shut down of the reactor. The results are valid shutdown ranging from 0.1s up to 109s. Albeit two-stage liquid stream in permeable media has been a set-up investigative field for a considerable length of time, its hypothetical foundation is as yet inadequate. Specifically, while an all-inclusive meaning of fine weight exists at the miniaturized scale, its upscaling to the full scale is still rather obscure. Figure 13 shows the cross-sectional velocity profile through the porous region. Figure 13 shows the consistent state temperature circulations along vertical focus lines at x = 0m and an even line along the x-pivot at y = 0m. As can be found in Figure 13, the vertical temperature appropriations at the hub position of 1.8m, 1.2m and 0.0m are fundamentally the same as one another, showing the stream is almost two-dimensional. The most extreme temperature happens at the upper right locale of the tank as appeared in Figure 13. Application of the CFD analysis shows the maximum velocity inside the domain is less than 1m/s which is less than the critical miller velocity rate in the channels between the fuel plates (12m/s).
Figure 13:Cross-sectional velocity magnitude and vector through the porous region at 500kW.

Figure 14:Cross-sectional pressure profile through the porous region at 500kW.

In the CFD analysis of natural convection in a research nuclear reactor, the criteria include studying the flow velocity, temperature distribution, and pressure drop within the reactor. CFD simulations are used to analyze the behavior of the coolant, the heat transfer mechanisms, and the overall thermal performance of the reactor. This helps to ensure the reactor operates safely and efficiently. Figure 14 shows the cross-sectional pressure profile through the porous region. Figure 14 shows the consistent state temperature disseminations along vertical focus lines at x = 0m and a level line along the x-pivot at y = 0m. Figure 14 shows that the vertical temperature dispersions display fundamental uniqueness along the y-hub. This implies the stream design along the hub bearing is less uniform, that is, more three-dimensional than that of Case. The more grounded planes at the channel spouts framed a progressively lively stream blending in the cylinder pack locale. The comparable impact is additionally appeared in the flat temperature profile as appeared in Figure 14. Pressure distribution shows a stratified regime which is preventing any further vortex in the system.
Conclusion
Adaptability and flexibility were introduced to the research reactor traditional design, allowing for greater support of a wide variety of advanced research and investigation. The porous media approach is applied in a common nuclear power plant. Characteristics of thermal energy removal from a typical research reactor are modeled by numerical thermal transport in porous media. The neutron flux is modeled by the nodal expansion method. The nodal extension technique explains the dissemination condition. In CFD, a convergence study refers to the process of determining when the solution has reached a stable and accurate state. It involves iteratively solving the governing equations of fluid flow until the solution no longer changes significantly with each iteration. The convergence criteria are typically based on certain parameters, such as residual values or solution error, which indicate the level of accuracy achieved in the simulation. The goal is to obtain a converged solution that provides reliable and consistent results.
To acquire the coupling between the hubs the nearby motion inside every hub is communicated by utilization of a polynomial development. Regarding the thermal-hydraulic evaluation for heat removal in the reactor core, a representational 2D model was simulated. By applying maximum generated heat with an assumption of high temperature, the simulated model did not exceed safety limits. At full operation power of 50kW the natural convection was sufficient for removing the generated heat. The extension is one-dimensional, so inside every hub such three developments happen. To compute the development coefficients, it is essential that the polynomial extension is an answer for the one-dimensional dispersion condition. At the point when the one-dimensional dispersion condition is built up a term with the transversal spillage happens, and this term is extended after similar polynomials. The subsequent condition framework with the development coefficients as the questions are tackled with a weighted remaining system. For the thermo-hydraulic part, a threedimensional governing equation is solved by an iterative method to find the steady-state solution of fluid flow and temperature in loss of coolant condition where the core is cooled by natural convection. The profiles of heat flux for various power levels are benchmarked. Pressure, temperature, and velocity contours in the hot channel were assessed at 500kW and 300kW power levels. To reduce the computational cost, a porous media approach for the whole geometry was utilized. The developed model can be used for safety and reliability analysis for various loss of coolant accidents. Finally, the integral 2D neutronic and thermohydraulic modeling was done to analyze a re-search nuclear reactor. The model shows that temperature values are under the critical values through loss of coolant accident. As well a porous model was used to reduce the computational time.
The main results are:
A. The calculations demonstrate the natural convection in the
system is enough to guarantee of safety for the studied research
reactor. As shown maximum temperature reaches about 40
and 60 rice in cases of loading with 300kW and 500kW power
without considering shut down of the reactor. The results are
valid shutdown ranging from 0.1s up to 109s.
B. Application of the CFD analysis shows the maximum velocity
inside the domain is less than 1m/s which is less than the
critical miller velocity rate in the channels between the fuel
plates (12m/s).
C. The results of the calculations showed that the maximum
water temperature in both calculations is sufficiently less than
100 ℃, which indicates that without changing the current
flow rate of the core, the heat produced can be well removed
without two-phase distributions.
D. Pressure distribution shows a stratified regime which is
preventing any further vortex in the system.
In conclusion, the conceptual design of the reactor has demonstrated its power enhancement capabilities while maintaining safety limits, which is of high importance in terms of enhancing reactor utilization for a larger window of time. Nevertheless, the proposed analysis requires further thermalhydraulic evaluations and should be the subject of future studies to demonstrate its safety and feasibility further. The high-power configuration should be further evaluated to ensure its performance and safety. Comprehensive thermal-hydraulic analysis should be conducted to evaluate the safety of the proposed configuration. Additionally, a sensitivity analysis should be conducted to identify any potential weaknesses in the proposed design.
References
- Sipaun S, Usman S (2015) Prediction of missouri S&T reactor’s natural convection with porous media approximation. Nuclear Engineering and Design 285: 241-248.
- Siavashi M, Bahrami HR, Aminian E, Saffari H (2019) Numerical analysis on forced convection enhancement in an annulus using porous ribs and nanoparticle addition to base fluid. Journal of Central South University 26(5): 1089-1098.
- Asadi A, Kadijani ON, Doranehgard MH, Bozorg MV, Xiong Q, et al. (2020) Numerical study on the application of biodiesel and bioethanol in a multiple injection diesel engine. Renewable Energy 150: 1019-1029.
- Emami RY, Siavashi M, Moghaddam GS (2018) The effect of inclination angle and hot wall configuration on Cu-water nanofluid natural convection inside a porous square cavity. Advanced Powder Technology 29(3): 519-536.
- Norouzi AM, Siavashi M, Soheili AR, Oskouei MK (2018) Experimental investigation of effects of grain size, inlet pressure and flow rate of air and argon on pressure drop through a packed bed of granular activated carbon. International Communications in Heat and Mass Transfer 96: 20-26.
- Ramezanpour M, Siavashi M (2018) Application of SiO2-water nanofluid to enhance oil recovery. Journal of Thermal Analysis and Calorimetry 135(1): 565-580.
- Shadloo MS (2019) Numerical simulation of compressible flows by lattice Boltzmann method. Numerical Heat Transfer, Part A: Applications 75(3): 167-182.
- Almasi F, Shadloo MS, Hadjadj A, Ozbulut M, Tofighi N, et al. (2021) Numerical simulations of multi-phase electro-hydrodynamics flows using a simple incompressible smoothed particle hydrodynamics method. Computers & Mathematics with Applications 81: 772-785.
- Hopp-Hirschler M, Shadloo MS, Nieken U (2019) Viscous fingering phenomena in the early stage of polymer membrane formation. Journal of Fluid Mechanics 864: 97-140.
- Hopp-Hirschler M, Shadloo MS, Nieken U (2018) A smoothed particle hydrodynamics approach for thermo-capillary flows. Computers & Fluids 176: 1-19.
- Sadeghi R, Shadloo MS, Hooman K (2016) Numerical investigation of the natural convection film boiling around elliptical tubes. Numerical Heat Transfer, Part A: Applications 70(7): 707-722.
- Shenoy DV, Shadloo MS, Peixinho J, Hadjadj A (2019) Direct numerical simulations of laminar and transitional flows in diverging pipes. International Journal of Numerical Methods for Heat & Fluid Flow 30(1): 75-92.
- Shadloo MS, Hadjadj A (2017) Laminar-turbulent transition in supersonic boundary layers with surface heat transfer: A numerical study. Numerical Heat Transfer, Part A: Applications 72(1): 40-53.
- Sharma S, Shadloo MS, Hadjadj A, Kloker MJ (2019) Control of oblique-type breakdown in a supersonic boundary layer employing streaks. Journal of Fluid Mechanics 873: 1072-1089.
- Méndez M, Shadloo MS, Hadjadj A, Ducoin A (2018) Boundary layer transition over a concave surface caused by centrifugal instabilities. Computers & Fluids 171: 135-153.
- Piquet B, Zebiri A, Hadjadj MS, Shadloo A (2019) Parallel high- order compressible flows solver with a domain decomposition method in the generalized curvilinear coordinates system. International Journal of Numerical Methods for Heat and Fluid Flow 30(1): 2-38.
- Mortazavi SM, Maleki A (2019) A review of solar compound parabolic collector in water desalination systems. International Journal of Modelling and Simulation 40(5): 339-354.
- Rashidi MM, Nasiri M, Shadloo MS, Yang Z (2016) Entropy generation in a circular tube heat exchanger using nanofluids: Effects of different modeling approaches. Heat Transfer Engineering 38(9): 853-866.
- Nasiri H, Jamalabadi MY, Sadeghi R, Safaei MR, Nguyen TK, et al. (2018) A smoothed particle hydrodynamics approach for numerical simulation of nano-fluid flows. Journal of Thermal Analysis and Calorimetry 135(3): 1733-1741.
- Zhang W, Maleki A, Khajeh MG, Zhang Y, Mortazavi SM, et al. (2019) A novel framework for integrated energy optimization of a cement plant: An industrial case study. Sustainable Energy Technologies and Assessments 35: 245-256.
- Zhang W, Maleki A, Rosen MA (2019) A heuristic-based approach for optimizing a small independent solar and wind hybrid power scheme incorporating load forecasting. Journal of Cleaner Production 241: 117920.
- Komeilibirjandi A, Raffiee AH, Maleki A, Nazari MA, Shadloo MS (2019) Thermal conductivity prediction of nanofluids containing CuO nanoparticles by using correlation and artificial neural network. Journal of Thermal Analysis and Calorimetry 139: 2679-2689.
- Li J, Mohammadi A, Maleki A (2019) Techno-economic analysis of new integrated system of humid air turbine, organic Rankine cycle and parabolic trough collector. Journal of Thermal Analysis and Calorimetry 139: 2691-2703.
- Tian C, Maleki A, Motie S, Yavarinasab A, Afrand M (2019) Generation expansion planning by considering wind resource in a competitive environment. Journal of Thermal Analysis and Calorimetry 139: 2847-2857.
- Shahrestani MI, Maleki A, Shadloo MS, Tlili I (2020) Numerical investigation of forced convective heat transfer and performance evaluation criterion of Al2O3/water nanofluid flow inside an axisymmetric microchannel. Symmetry 12(1): 120.
- Goshayeshi HR, Goodarzi M, Safaei MR, Dahari M (2016) Experimental study on the effect of inclination angle on heat transfer enhancement of a ferrofluid in a closed loop oscillating heat pipe under magnetic field. Experimental Thermal and Fluid Science 74: 265-270.
- Goshayeshi HR, Safaei MR, Goodarzi M, Dahari M (2016) Particle size and type effects on heat transfer enhancement of Ferro-nanofluids in a pulsating heat pipe. Powder Technology. 301: 1218-1226.
- Rapagna S, Tempesti E, Foscolo PU, Parodi E (1992) Continuous fast pyrolysis of biomass at high temperature in a fluidized bed reactor. Journal of Thermal Analysis. 38(12): 2621-2629.
- Imayoshi S, Sato Y, Shiga A (1987) The economical parameter survey program for long-term transient temperature distribution and stress analysis around the sodium level of the liquid metal fast breeder reactor. Journal of Thermal Analysis 32(3): 873-882.
- Kikuchi S, Koga N, Yamazaki A (2019) Comparative study on the thermal behavior of structural concretes of sodium-cooled fast reactor. Journal of Thermal Analysis and Calorimetry 137(4): 1211-1224.
- Yang HC, Lee SY, Choi YC, Yang IH, Chung DY (2016) Thermokinetic analysis of spent ion-exchange resins for the optimization of carbonization reactor condition. Journal of Thermal Analysis and Calorimetry 127(1): 587-595.
- Kikuchi S, Koga N (2017) Thermal behavior of sodium hydroxide-structural concrete composition of sodium-cooled fast reactor. Journal of Thermal Analysis and Calorimetry 131(1): 301-308.
© 2025 Mohammad Yaghoub Abdollahzadeh Jamalabadi. This is an open access article distributed under the terms of the Creative Commons Attribution License , which permits unrestricted use, distribution, and build upon your work non-commercially.
Editor In Chief


.jpg)


Signup for Newsletter

Quick Links
 Editorial Board Registrations
 Submit your Article
 Refer a Friend
 Advertise With Us
Our Recent Edition

.jpg)


Top Editors


.jpg)


.bmp)
.jpg)
.png)
.jpg)


.jpg)


.png)

.png)


.png)


Financial Support

Sponsors

Latest e-Books

Latest Video

 a Creative Commons Attribution 4.0 International License. Based on a work at www.crimsonpublishers.com.
Best viewed in
a Creative Commons Attribution 4.0 International License. Based on a work at www.crimsonpublishers.com.
Best viewed in