
- About Us
- Information
-

The Author ensures that the research has been conducted responsibly and ethically with adherence to all relevant regulations. read more..
- For Authors
- For Reviewer
- Manuscript Guidelines
- Membership
- Publication Ethics
-
- Journals
- Reprints
- e-Books
- Videos
- Policies
- Contact Us
 COVID-19
- Submissions


Full Text
Evolutions in Mechanical Engineering
The Analysis of Operation Conditions on Pump Performance
Lelis Gonzaga Fraga1*, Evangelino Candido Gaio1, Domingos de Sousa Freitas1, Carlos Alberto Pereira Costa2 and Miguel Augusto Freitas Abreu2
1Faculty of Engineering, Science and Technology Universidade Nacional Timor-Lorosa’e, Dili Timor-Leste
2Department of Mechanical Engineering, Engineering School, University of Minho, Portugal
*Corresponding author:Lelis Gonzaga Fraga, Faculty of Engineering, Science and Technology Universidade Nacional Timor-Lorosa’e, Dili Timor-Leste
Submission: May 02, 2025;Published: May 19, 2025

ISSN 2640-9690 Volume6 Issue1
Abstract
Pump is an important machine to transfer the fluid from one place to another. The experiment on the centrifugal pump (Gilkes Pump) on the laboratory based is presented in this paper. The objective of this paper is to analyze the characteristic of the pump in order to provide the information about how to operate the pump on the optimum conditions. Two different speeds include 1500 and 1700rpm at various head (1-8m) and flow rate were applied. From this experiment the performance of the pump was evaluated. The results show that the higher pump efficiency was obtained at 5.5m head with flow rate of 0.10m3.min-1 and 5.4m head with flow rate of 0.15m3.min-1 operated at two different speeds with the efficiency was 84 and 96.81% respectively. The statistical data show that there is a significant relationship between parameters observed in this experiment.
Keywords:Centrifugal pump; Head; Flow rate; Speed; Pump efficiency
Introduction
Pump is one important of fluid machinery and it is almost operated every day. With this machine the fluid can be transferred from one place to another with less effort from people. To have a good operation on the pump, then the understanding on the pump characteristic is necessary. The utilization of the pump is various such as jet pump which is used to supply water in a high head hydropower plant by introducing high pressure water from penstock to entrain the suction fluid from tail water [1]. There are several factors that should be known on the pump operation such as cavitation. This cavitation has effect on pump such as performance reductions, vibration, noise and material damage [2]. In water jet pump, the cavitation occurs because of the high velocities and shear flows. In addition, the cavitation occurs in different location such as:
A.In the vortex structure downstream.
B.Near the nozzle outlet at a position corresponding to the vortex location.
C.Near the nozzle outlet and also between the vortex pair downstream.
Pump efficiency is an important parameter to identify the working condition of the pump. During the normal operation, pump’s efficiency usually degrades due to wear by as much as 10-25% before it is replaced [3]. In addition, efficiencies of 50 to 60% or lower are quite common in older pumping stations. Koor et al. [3] are also stated that a pump operating beyond its best operation point will experience increased noise and vibration, also running a pump continuously at such extreme regime will reduce pump’s life time considerably. The rate load of the pump on the efficiency at different capacity of the pump has been investigated by Kaya et al. [4]. This study stated that the preferred optimum operating region of pump efficiency is between 60% and 90% of the rated load for motors and the ideal value is when the motor is operated in its full load. In addition, the replacements of the existing low efficiency pumps and maintenance of the pumps whose efficiencies start to decline at certain range are contributing to the main energy saving. There is different value of efficiency referred to centrifugal pump and AC motor. The small capacity of the centrifugal pump has an efficiency of 50%-70% and the large capacity is 75%-90%. Meanwhile the large capacity of AC motor can reach the efficiency of 97% [5]. The objective of this experiment is to evaluate the pump characteristic in order to determine the optimum operation conditions of the pump. The theoretical calculation and the statistical analysis were also conducted to describe the pump performance.
Studies on the pump speed have been conducted in previous studies [6,7]. The parameters of the impeller speed and diameter are proportional to the total head produced by the pump [8]. Therefore, in order to obtain a higher head, the rotational speed or the impeller diameter can be increased. Han et al. [6] conducted a numerical and experimental study using a well submersible pump and applied a high-speed of 6000rpm. This study shows that the flow slip inside the impeller at high-speed, the large impeller outlet angle will cause the power of the impeller to increase linearly with the flow rate, thus reducing the pump efficiency. In a study on highspeed (18,000rpm) pump-jet propellers conducted by Gan et al. [7] based on the modified SST turbulence model and the Zwart cavitation model, a three-dimensional numerical simulation of unsteady internal cavitation flow was carried out by comparing the impeller. This study presents an understanding of the cavitation performance of high-speed pump-jet propellers and provides a good theoretical basis and practical significance for the high-speed and miniaturization processes of high-speed pump-jet propellers. Meanwhile, the experimental and numerical studies on the unsteady characteristics of the leakage vortex structure of the tip of a low-speed pumpjet propeller blade at 1450 rpm revealed the evolution mechanism and influencing factors of the transient vortex morphology Shen et al. [9] cited by Gan et al. [7].
Material and Methods
Research methods
The experimental set up used in this study is presented in Figure 1 [10]. The experiment was conducted at the laboratory of energy and fluid University of Minho in Guimarães Portugal. The centrifugal pump (Gilkes pump) was used in this experiment. This pump is a tutor pump with index for pump performance at 1450 and 2900rpm [11]. The maximum flow rate is approximately 0.3m3. min-1, and the maximum head is 30mH2O. In this study, two speed (include 1500 and 1700rpm) at various head and flow rate were applied (0.9-8.1m and 0.02-0.233m3.min-1). The tachometer meter was used to measure the rational speed. The speed was obtained by adjusted the power button. Once obtained the value of speed, then the electrical current and voltage was also recorded in order to calculate the input power of the pump. The manometer was used to measure the head (mH2O). The mass flow of water was measured by flow meter scale. The water is pumped from bottom reservoir to upper reservoir during the experiment period.
Figure 1:(a) Pump unit, (b) Experimental schematic [10]. Description: 1. Pump, 2. Electrical motor, 3. Volt meter, 4. Ampere meter, 5. Power button, 6. Bottom tank, 7. Water outlet (V type), 8. Flow rate scale, 9. Upper tank, 10. Water stabilizer, 11. Diffuser (water inlet), 12. Regulator valve, 13. Pressure manometer and 14. Tachometer

Calculations for pump power
After determined the input power of the pump and measured the flow rate and pump head, then the efficiency of the pump can be calculated. Basically, calculation for the input power and pump efficiency as presented in Eq. 1 [12] and Eq. 2 [13] respectively.
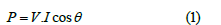
From equation 1, P is power (W), V is voltage (Volt), I is electrical current (A) and cos θ is the power factor.
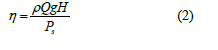
where η is efficiency (%), ρ is density (kg/m3), Q is flow rate (m3/s), H is pump head (m) g is gravitational (m/s2), and Ps is shaft power (W).
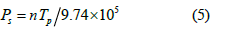
In order to obtained Ps, by determined the torque, or turning moment, for a pump and may be estimated from the power curve as in Eq. 3 [13].
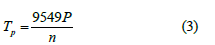
where Tp is pump torque (N.m), P is power (kW) and n is speed (rpm). Meantime, the torque of the shaft is calculated as in Eq. 4 [14]:
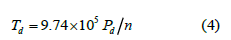
where Td is torque design (kg.mm) and Pd is power design (shaft power or Pd = Ps), (KW). Introducing Eq. 3 and Eq. 4 (assume Td = Tp), then Ps can be obtained as follow (Eq. 5).
Result and Discussion
Experiment results
In this section presents the experimental results regarding to head, flow rate and efficiency. The data applied in this experiment including electrical potential of 122 volt, electrical current 0.9 ampere is referred to pump speed at 1500rpm and tested at various head is ranged from 0.9 up to 6.9mH2O. In addition, the electrical potential of 140 volt, electrical current 1.0 ampere is referred to pump speed at 1700rpm and tested at various head is ranged from 0.9 up to 8.1mH2O. The experimental data is calculated and presented in Table 1.
Table 1:Experimental data summary.

The relationship between head and flow rate: Figure 2 presents the relationship between head and flow rate at different speed. It shows that at higher head; the flow rate is lower. Meanwhile, at a higher speed the flow rate is higher compared with the lower speed. This is because, at higher speed more energy was consumptive, which is pumped more water out.
Figure 2:Incidence diagram of diesel oil in general weather.

The relationship between flow rate, head and efficiency: Figure 3 presents the relationship between flow rate, head and efficiency. The figure shows that the relationship of the parameters has the same behaviour. As can be explained in Figure 3(b), the relationship between head and efficiency is almost linear before 4m head, this may indicate that the losses during this period is very small or almost zero. Then at higher head, the lines are not linear that maybe due to higher losses mostly caused by friction. The higher efficiency was obtained at the head of 5.4m, which is about 96.81% at higher speed, which is correspond with the result obtained by Kaya et al. [4], which stated optimum pump efficiency is when the motor is operated in its full load.
Figure 3:Incidence diagram of diesel oil in general weather.

Statistical analysis
The statically analysis was conducted with SPSS 14.0. The partial correlation was applied to identify the significant influence of factors on the response variables.
The statistical analysis for speed of 1500rpm: The statistical analysis for speed of 1500rpm shows that there is a significant relationship between head and flow rate and also head and efficiency with the significant value (α) < 0.05 for the control variable is head. The same condition is obtained for the control variable flow rate. The correlation between parameters is about 0.94 for both conditions, which is indicated a positive relationship [15].
The Statistical analysis for speed of 1700rpm: The statistical analysis for speed of 1700rpm depicts that there is a significant relationship between head and flow rate and also head and efficiency with the significant value (α) < 0.05 for the control variable is head. The same condition is obtained for the control variable flow rate. The correlation between parameters is about 0.96 and 0.97 for both conditions, which is indicated a positive relationship [15].
Conclusion and Future Works
Form this laboratory-based experiment, several conclusions are presented here. Higher pump efficiency is about 96.81% and it was obtained at higher speed (1700rpm), at 5.4m head and 0.15m3. min-1 flow rate. In order to operate the pump in an optimum condition, the parameters including head, flow rate and speed need to be considered to maintain the higher pump efficiency. The statistical data also proved that, the parameters observed in this study have a significant relationship with the significant value (α) < 0.05. The future works will apply other parameters to optimize the pump’s performance that may also apply to other types of pumps. In addition, the simulation may also be considered to validate the experimental data.
References
- Wang J, Xu S, Cheng H, Ji B, Zhang J, et al. (2018) Experimental investigation of cavity length pulsation characteristics of jet pumps during limited operation stage. Energy 163: 61-73.
- Long X, Wang J, Zhang J, Ji B (2018) Experimental investigation of the cavitation characteristics of jet pump cavitation reactors with special emphasis on negative flow ratios. Exp Therm Fluid Sci 96: 33-42.
- Koor M, Vassiljev A, Koppel T (2016) Optimization of pump efficiencies with different pumps characteristics working in parallel mode. Adv Eng Softw 101: 69-76.
- Kaya D, Yagmur EA, Yigit KS, Kilic FC, Eren AS, et al. (2008) Energy efficiency in pumps. Energy Convers Manag 49(6): 1662-1673.
- (2023) Pump efficiency.
- Han C, Liu J, Yang Y, Chen X (2023) Influence of blade exit angle on the performance and internal flow pattern of a high-speed electric submersible pump. Water 15(15): 2774.
- Gan G, Shi W, Yi J, Fu Q, Zhu R, Duan Y (2023) The transient characteristics of the cavitation evolution of the shroud of high-speed pump-jet propellers under different operating conditions. Water 15(17): 3073.
- (2023) Centrifugal pump selection, sizing, and interpretation of performance.
- Shen X, Zhao X, Xu B, Zhang D, Yang G, et al. (2022) Unsteady characteristics of tip leakage vortex structure and dynamics in an axial flow pump. Ocean Eng 266: 112850.
- Nunes A, Loarinhas P, Ferreira E (2007) Thermal and fluid machines, determination of the characteristic curves of a centrifugal pump (GILKES).
- (2019) MEBA, Gilkes tutor operating and maintenance. Gilber Gilkes & Gordon LTD, Kendal, England.
- (2023) Fundamental theory of pump.
- Karassik IJ, Krutzsch W, Fraser WH, Messina JP (1976) Pump handbook.
- Sularso, Suga K (2004) Design of machine element. (2nd edn), PT. Pradnya Paramita, Jakarta, Indonesia.
- (2023) Pengertian one tailed dan two tailed hipotesis penelitian.
© 2025 Lelis Gonzaga Fraga. This is an open access article distributed under the terms of the Creative Commons Attribution License , which permits unrestricted use, distribution, and build upon your work non-commercially.
Editor In Chief


.jpg)


Signup for Newsletter

Quick Links
 Editorial Board Registrations
 Submit your Article
 Refer a Friend
 Advertise With Us
Our Recent Edition

.jpg)


Top Editors


.jpg)


.bmp)
.jpg)
.png)
.jpg)


.jpg)


.png)

.png)


.png)


Financial Support

Sponsors

Latest e-Books

Latest Video

 a Creative Commons Attribution 4.0 International License. Based on a work at www.crimsonpublishers.com.
Best viewed in
a Creative Commons Attribution 4.0 International License. Based on a work at www.crimsonpublishers.com.
Best viewed in