- Submissions

Full Text
Examines in Marine Biology & Oceanography
Metabolomic Profiling of Marine Microalgae using Silylation-Driven GC-Triple Quadrupole Mass Spectrometry
Murali Krishna Paidi1-3*, Kanchan Siddhaprasad Udata1,2 and Subir Kumar Mandal1,2*
1Academy of Scientific and Innovative Research (AcSIR), India
2CSIR-Central Salt and Marine Chemicals Research Institute, Council of Scientific and Industrial Research (CSIR), India
3Center for Systems Biology and Molecular Medicine, Yenepoya (Deemed to be University), India
*Corresponding author: Murali Krishna Paidi, Academy of Scientific and Innovative Research (AcSIR), Ghaziabad-201002, India; CSIR-Central Salt and Marine Chemicals Research Institute, Council of Scientific and Industrial Research (CSIR), GB Marg, Bhavnagar - 364 002, Gujarat, India; Center for Systems Biology and Molecular Medicine, Yenepoya (Deemed to be University), Deralakatte 575018, Mangalore, India Subir Kumar Mandal, Academy of Scientific and Innovative Research (AcSIR), Ghaziabad-201002, India; CSIR-Central Salt and Marine Chemicals Research Institute, Council of Scientific and Industrial Research (CSIR), GB Marg, Bhavnagar - 364 002, Gujarat, India
Submission: August 13, 2025;Published: October 28, 2025

ISSN 2578-031X Volume7 Issue 5
Abstract
Marine microalgae, as primary producers, are a significant source of diverse bioactive compounds. To explore this, the endogenous small molecules (metabolites) of four species Chaetoceros curvisetus, Thalassiosira lundiana, Thalassiosira andamanica, and Graesiella emersonii were profiled using Gas Chromatography-Triple Quadrupole Mass Spectrometry (GC-TQMS). Crude aqueous and organic algal extracts were vacuum-dried and subjected to chemical derivatization using silylating agents such as N,O-Bis(trymethylsilyl)trifluroacetamide (BSTFA) and N-Methyl-N-trimethylsilytrifluoroacetamide (MSTFA) to improve GC-MS detection of polar compounds before molecular mass profiling. The results showed no significant difference in essential amino acid production (Isoleucine, Leucine, Phenylalanine, and Threonine) among G. emersonii, C. curvisetus, and T. lundiana (p<0.05, n=3). However, T. andamanica displayed greater concentrations of ergosterol, lactic acid, palmitic acid, and oleic acid, Conversely, T. lundiana showed elevated concentrations of the omega-3 PUFAs DHA and EPA. Whereas G. emersonii contained greater amounts of α-linolenic and stearic acids. This study highlights that the diatom Thalassiosira species are a major source of omega-3 PUFAs, underscoring their considerable value for nutraceutical and pharmaceutical applications.
Keywords:β-Carotene; Silylation; Fucoxanthin; Heatmap analysis; Metabolomics; Microalgae; Mass spectrometer
Introduction
Microalgae are a diverse group of photoautotrophic eukaryotes that can thrive in both marine and freshwater environments. They are multitasking organisms that perform multiple tasks simultaneously, including bioremediation, carbon sequestration, and oxygen production. They synthesis various biomolecules through photosynthetic which are used as active ingredients in the food industry, nutraceutical, pharmaceutical, and livestock production [1-4]. The green microalgae Graesiella emersonii also called Chlorella emersonii (basyonym) [5,6]. G. emersonii is typically fresh water green algae, but it can inhabitant brackish water. Moreover, G emersonii is a major resource for valuable pigments, lipids, pharmaceutical compounds and biodiesel [7]. Diatoms (Bacillariophyceae) are abundant, evolutionary complex, single-celled photosynthetic eukaryotes found in nearly all water bodies worldwide [8]. They constitute approximately 20% of the total primary biomass production during seasonal phytoplankton blooming [9]. In algal biotechnology, diatoms holds special interest due to their abundance and productivity of various value-added bioactive compounds [10]. Diatoms are major source of natural bioactive xanthophylls such as fucoxanthin, Dianoxanthin, and Diadinoxanthin [11], omega-3 polyunsaturated fatty acids [12,13], terpenoids [14], inorganic salts (i.e., silica) and various vitamins. Compounds derived from diatoms have distinct biological activities, including cytotoxic, antibiotic, antioxidant, antifungal, anti-inflammatory, anthelminthic effects, and also act as anticancer agents. Omega-3 PUFAs (n-3) are essential fatty acids synthesized by marine plankton such as diatoms and green algae and are deposited at a high percentage in marine fish.
Microalgae (Chlorophyta and Bacillariophyta) represent a treasure trove of bioactive compounds, holding immense potential for applications in pharmaceuticals, nutraceuticles and biofuels. However, accurate profiling og their complex metabolites compositions often presents challenge for traditional analytical methods, particularly due to the prevalence of polar compounds. Transesterification, is a conventional a three-step chemical reaction that specifically converts triglycerides into fatty acid methyl esters (FAME) and glycerol, typically in the presence of methanolic alkaline catalysts [15]. In this process polar small compounds degradation accured. To overcome this, a promising alternative is silylation, a single-step reaction that converts both triglycerides and polar compounds into their extremely volatile trimethylsilyl (TMS) derivatives using silylation agents such as N,O-Bis(trymethylsilyl)trifluroacetamide (BSTFA) and N-Methyl- N-trimethylsilytrifluoroacetamide (MSTFA). By reducing polarity, increasing volatility and molecular mass of compounds. Silylationassisted GC-MS allows for more precise profiling of microalgae metabolites, unlocking their full biochemical potential.
In this study, we evaluated the macro and micromolecule composition of four abundant microalgae Chaetoceros curvisetus, Thalassiosira lundiana, Thalassiosira andamanica (Bacillariophta) and Graesiella emersonii (Chlorophyta) using UV visible spectrophotometer and gas chromatogram triple quadrupole mass spectrophotometer (GC-TQMS). Prior to GC analysis, the endogenous small molecules (i.e. amino acids, sugars, organic compounds, plyoles and fatty acids) were derivatized to improve GC detection by reducing the polarity, increasing mass and volatility. This comprehensive metabolomics study differentiates the biochemical characteristics of microalgae and enhances their nutritional significance.
Material and Methods
Unialgal cultivation and determination of biomass production
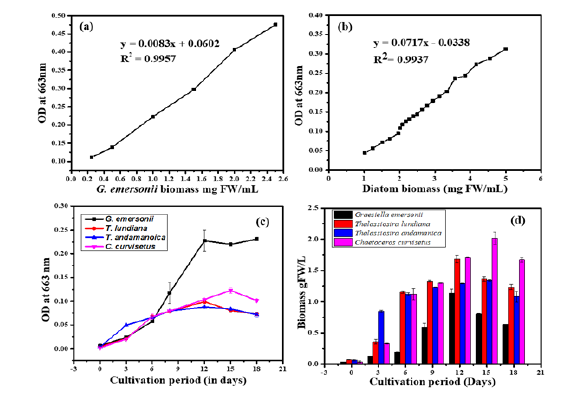
The marine diatoms T. lundiana CSIRCSMCRI 001 (MH553154.1), T. andamanica CSIRCSMCRI 002 (MN328730.1), C. curvisetus CSIRCSMCRI 003 (MN328731) and one green algae G. emersonii CSIRCSMCRI 006 were grown in 3L culture flasks consists phosphate (145μM) and carbonate (357μM) enriched f/2 media (1.5 L) for 18 days. The cultures were maintained at laboratory conditions at constant light (80-100μmolm-2s-1) temperature (25±1 °C), and salinity (30ppt). To determine the microalgae growth, about 2mL of culture samples were collected from the experimental flasks over three days until the end of cultivation. Cell density of cultures were determined by UV-VIS spectroscopy Epoch2 (BioTek, USA). A standard biomass calibration curve was constructed to determine the production of biomass using slope values of y=0.0083x+0.0602, R2=0.9957 for G. emersonii and y=0.0717x+0.0338, R2=0.9937 for diatoms (Figure 1a & 1b). At the end of cultivation, the cultures were harvested using a high-speed benchtop centrifuge at 8000rmp per 10 min (Centrifuge 5804R, Eppendorf, US).
Figure 1:Real time spectral absorbance of marine microalgae and cell growth measurement (a&b) Calibration curves of G. emersonii and diatoms biomass (T. lundiana, T. andamanica and C. curvisetus) (c&d) Growth curve and Biomass production of microalgae.
Proximate Analysis of Microalgal Biomass
Pigment extraction and quantification
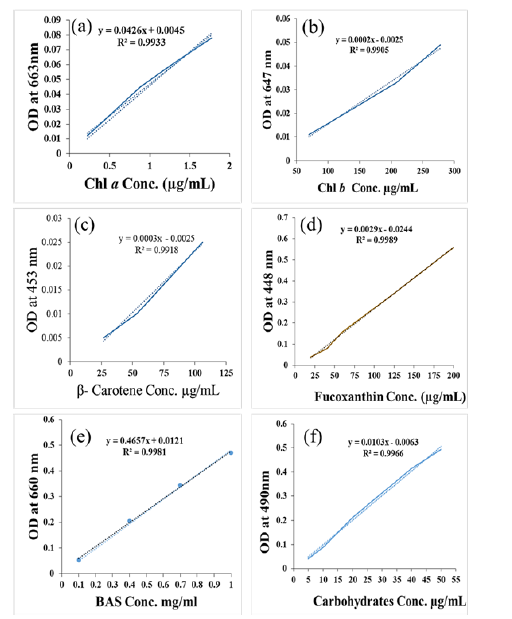
To extract total pigments content, 100mg of dry biomass samples were homogenized in Eppendorf tube (1.5mL) using a micro pestle with the addition of 500μl of 95% methanol. The homogenized samples were vertex at 3000rpm for 50 min. Then the lysate was centrifuged at 12000rpm per 10 min at 4 ℃. The supernatant was collected and stored at -20 ℃ until further analysis. For quantitative determination of pigments, the crude pigments extract samples absorbance was recorded from 300 to 800nm using UV-VIS spectroscopy Epoch2 (BioTek, USA). A calibration curve of standard pigments Chlorophylls a (y=0.0426x+0.0045, R2=0.9933), Chlorophylls b (y=0.0002x–0.0025, R2=0.9905) fucoxanthin (y=0.0003x-0.0025, R2=0.9918) and β-Carotene (y=0.00029x-0.00244, R2=0.99895) were generated. The unknown concentration of pigment in the crude extracts was measured from calibration curves (Figure S1a-S1d)..
Figure S1:Calibration curve of pigments (a) Chl a, (b) Chl b, (c) β-Carotene, (d) Fucoxanthin, (e) Bovine Serum Albumin (BSA) protein, and (f) Carbohydrates standards.
Extraction of total protein and protein assay
To extract total protein content, 100mg of dry biomass samples were homogenized in Eppendorf tubes (1.5mL) using a micro pestle with the addition of 500μl of saline buffer containing 0.1M sodium hydroxide (NaOH) and 3.5% of Sodium chloride (NaCl). The homogenized samples were boiled at 60 ℃ for 90 min [16]. Then the lysate was centrifuged at 4 ℃ per 10min. at 12000rpm, then the supernatant was collected and stored at -20 ℃ until further analysis.
Protein assay: Total protein content was determined by the Lowry method [17] with some modification. Briefly, 100μL protein extract samples were taken into 2mL tubes contain 250μL of M.Q. Then 0.3mL of reagent A (consist of 7mM Na-K tartrate, 0.81M sodium carbonate in 0.5N NaOH) and 100μL of reagent B (70mM Na-K tartrate, 40mM of copper sulfate) were added. Tubes were thoroughly mixed and incubated at RT for 10 min. After that 250μL of reagent C (Folin-Cioclteau or Folin-Phenol reagent and M.Q in 1:1v/v) was added and thoroughly mixed then incubate at RT for 30 min. The reduction of Folin-Cioclteau regent and development of blue-green color was observed. Intensity of color was measured at 660nm using Visible spectrophotometer (Epoch2, BioTeck, US). The same reaction steps were carried out with known concentrations of bovine serum albumin (BSA, Sigma Aldrich) to construct a calibration curve (y= 0.4657x+0.0121, R2=0.9981) (Figure S1c).
Carbohydrate extraction and quantification
For carbohydrate extraction, 100mg of dry biomass was minced in liquid nitrogen. Then the biomass powder was taken into 15mL tubes and 500μL of conc. H2SO4 was added. The acid digested was carried at 40 ºC in a water bath for 30min. after that 7ml distilled water was added and incubated at 121 ℃ for 20 min. for complete digestion of biomass. The lysate solution was cooled at room temperature and neutralized with 6N NaOH and centrifuged at 10000rpm for 10 min. The resulting supernatant was collected and stored at 4 ℃ until further analysis.
Carbohydrate assay: To determine the content of carbohydrates, 20μl of extracts were taken in a centrifuge tube and diluted 10 times with double distilled water. The carbohydrate estimation was carried out by the Phenol H2SO4 method (20μL sample+200μL 5% phenol+1mL conc. H2SO4). Absorbance was taken at 490nm after incubating the solution at room temperature for 30 min [18]. At the same time, a standard curve (y=0.0103x+0.0063, R2=0.9966) of Glucose was generated with the known concentration of 99.9 % pure glucose solutions (Figure S1d) in distilled water to quantify carbohydrate content in unknown samples.
Extraction of metabolites
To extract metabolites, 100mg of algal dry biomass samples were placed in 15mL centrifuge tubes containing 5ml of 80% methanol. The tubes were vertex at 4000rpm per 2 min. and then boiled in a water bath at 60 °C for 1h. After cooling to room temperature, a double volume of chloroform was added to each tube. The tubes were vertex again and centrifuged at 12000rpm at RT for 15 min. The upper aqueous phase (a mixture of CH3OH and H2O mix) and lower organic phases (Chloroform) were collected separately into new tubes, and this procedure was repeated twice. The resulting supernatants were pooled and both methanolic and organic phase extracts were vacuum dried. The residual metabolites powder samples were stored at 4 °C until GC-MS profiling.
Chemical derivatization and sample preparation for GCMS
Non-target mass profiling was carried out using advanced gas chromatography triple quadrupole mass spectrometry (GCMS-TQ8040, Shimadzu Corporation, Kyoto, Japan) equipped with an auto-sampler. Prior to GC analysis, the polar metabolites from the methanolic phase (Aqueous layer) were derivatized with 94μL of N,O-Bis(trymethylsilyl)trifluroacetamide (BSTFA). Similarly, the nonpolar metabolites from the organic phase (chloroform layer) were derivatized with 94μL of N-Methyl-Ntrimethylsilytrifluoroacetamide (MSTFA) in 1.5mL tubes. Before the silylation reaction, two internal standards, 2μL of Linoleic acid (10mg/ml) and 2μL of Ribitol (10mg/mL) (Sigma-Aldrich) were added to the samples. The silylation reaction was carried out at 65 °C for 30 min. Thereafter, the derivatized samples were wrapped and stored at 4 °C until GC analysis..
Untargeted metabolites mass profiling using GC-MS
The injection volume was kept content at 1μL for all samples, and the Gas Chromatography (GC) was run at a constant flow rate of 1mL/min. for 40 min in a standardized thermal program [19]. Briefly, initially the GC oven temperature was set at 80 °C for 5 min, then it was gradually increased to 180 °C at a rate of 5 °C/ min. After that the oven temperature was further increased to 280 °C at a rate of 10 °C/min and hold at this final temperature for 5 min. The mass of each metabolite was scanned from 40– 1080amu using EI scan mode at 70eV. Finally, the resulting Total Ionic Chromatograms (TIC) were processed using GC-MS Post-run analysis software (Shimadzu) and NIST 14 similarity library search engine was employed with a similarity index greater that 90% for the identification of metabolites.
Data processing and hierarchical clustering heatmap analysis
All experimental triplicate results for C. curvisetus, T. lundiana, T. andamanica, and G. emersonii were processed in MS Excel 2020 to determine mean and standard errors. To generate a hierarchical cluster heatmap, the triplicate data were normalized using the median (n=3). The normalized data were used to construct a clustered heatmap in auto-scale mode, mean cantered and divided by the standard deviation of each variable using Pearson’s T-test at P>0.05. Then the microalgal metabolite composition and quantitative expression were presented on a gradient scale from +1 (Red) to -1 (Blue) using the default colour scale bar in web-based MetaboAnalyst 5.0 data analysis software [20]. The quantitative triplicate data of metabolites were subjected to Principal Compound Analysis (PCA) to determine the correlation in production (P<0.05) of different metabolites among the experimental algae using Origin licensed version 2017 (CSMCRI, Bhavnagar, India).
Results and Discussion
Cell growth and biomass production of microalgae
Real-time spectral absorbance of microalgae: The real-time spectral absorbance of live microalgal cultures (live cultures) reflects cell density over time (Figure 1c). The spectral absorbance of G. emersonii differed from that of diatoms cultures in the 350nm to 525nm range, although both exhibited a similar absorption pattern at 663nm. In batch cultivation, G. emersonii showed maximum absorbance at 663nm. It was gradually increased from 0.006 on day 0 to 0.22 by day 12. Further it was declined to 0.16 (on 15th day) and 0.13 (18th day). In contrast, the spectral absorbance of diatoms (brown microalgae) was comparatively lesser than that of G. emersonii cultures at 663nm (Figure 1c). Among the three diatom species, C. curvesetus showed maximum absorbance (0.125 at 665nm) on day 15th compared to T. lundana and T. andamanica. Thereafter, it decreased on the 18th day. From these observations, indicated that chlorophyll biosynthesis was higher in the Chlorophyta species (i.e. G. emersonii) compared to the Bacillariophyceae species (Diatoms).
Biomass production: The highest biomass production of C. curvisetus was noticed on day 15 reaching 2.1g FW/L. Whereas, T. lundiana (1.75g FW/L), T. andamanica (1.32g FW/L) and G. emersonii, (1.2g FW/L) achieved their maximum biomass on day 12. During the early exponential growth phase (days 0-3), T. andamnaica has the highest biomass production higher (0.8g FW/L) than other species. However, during the exponential growth phase days (6–9), there was no difference in biomass production among T. lundiana, T. andmanica and C. curvisetus. By the end of the cultivation period (day 18), biomass production was followed this order: C. curvisetus>T. lundiana>T. andmanica>G. emersonii (Figure 1d). From these observations, G. emersonii (green microalgae) has the highest potential for chlorophyll production, it contributes a lower share of total biomass production compared to Bacillariophyceae.
Pigments signature of microalgae
The absorption of a pigment is characterized by its unique absorptions wavelength (λmax). Figure 2a represent the spectral response of standard chlorophylls. Chl a has two absorption regions 380nm to 450nm and 645nm to 685nm (λmax=663nm). Whereas, Chl b has two major peaks from 400 to 480nm and 625nm to 665nm (λmax =647nm) in 100% methanol (Figure 2a). Similarly, the standards for fucoxanthin and β-Carotene have single broad absorption from 350nm to 550nm (λmax=448nm) and 360 to 520nm (λmax=452nm) (Figure 2b). The absorption peaks of chlorophylls in the 380nm to 480nm region overlap with absorption of fucoxanthin and β-carotene. Due to this, the λmax values of Chl a (λmax=663nm) and Chl b (λmax=647nm) were considered to construct calibration curves (Figure S1). The methanolic crude extracts of all microalgae have sharp narrow absorption peak in the 645nm to 675nm region with λmax=663nm. However, the crude extracts of T. andamanica and G. emersonii have highest absorption in the 645nm to 675nm region compared to T. lundiana and C. curvisetus (Figure 2c). Chl a production was higher in T. andamanica (0.29mg/g DW) followed by G. emersonii (0.25mg/g DW), T. lundiana (0.045mg/g DW) and C. curvisetus (0.04mg/g DW). Similarly, the production of β-carotene was following the order: T. andamanica (12.52mg/g DW)> G. emersonii (10.56mg/g DW)> T. lundiana (10.16mg/g DW)> C. curvisetus (2.25mg/g DW) (Figure 2d).
Figure 2:Spectral absorbance of pigments (a&b) Pigment standards Chl a λmax=663nm and Chl b λmax=647nm in 100% methanol, Fucoxanthin λmax=448nm and β-Carotene λmax=453nm, (c) Pigments crude extracts spectral absorbance, and (d) Pigments concentrations in microalgae.
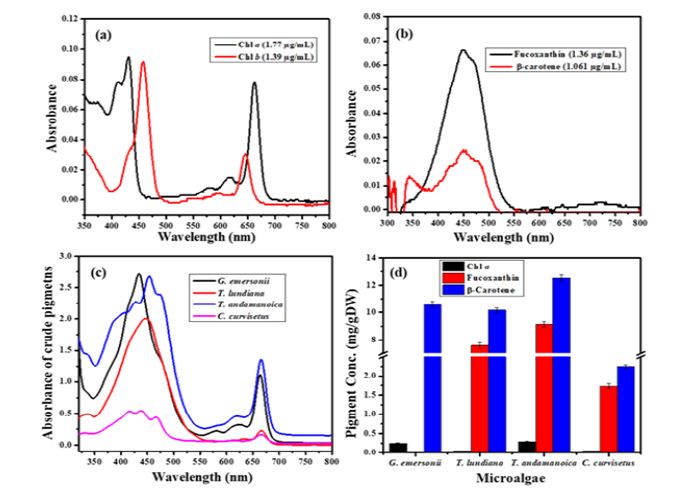
From spectral absorbance of pigments crude extracts, it was confirmed that fucoxanthin production was absent in G. emersonii (Figure 2c). Among the diatoms, T. andamnaica produced the highest amount of fucoxanthin (9.8mg/g DW), followed by T. lundiana (7.9mg/g DW) and C. curvisetus (2.15mg/g DW) (Figure 2d). These results indicate that the brown algae T. anadmanica have a greater capacity for producing Chl a, fucoxanthin and β-carotene compared to other algae. However, β-carotene is the only major considerable pigment produced in the green algae G. emersonii. The synthesis of both pigments chlorophyll and fucoxanthin in brown algae form a Light-Harvesting Pigments Complex (LHC). Which are essential accessory molecular complex for photosynthetic that facilitate light energy absorption. The Fucoxanthin Chlorophyll a/c Pigment (FCP) complex is a light-harvesting system that captures low light intensity for photosynthesis [21]. Fucoxanthin, a power full antioxidant, protects algal cells from oxidative damage caused by Reactive Oxygen Species (ROS) under environmental stress. Moreover, fucoxanthin possesses therapeutic properties, including anti-inflammatory [22], antioxidant, anti-diabetic, anti-obesity, anti-hypertensive and anticancer [23]. It has been utilized as a chemopreventive agent for hepatic cancer and inhibiting the human Leukemia HL-60 cells proliferation [24,25]. Furthermore, dietary supplementation of fucoxanthin (0.02%) has been shown to reduces body fat accumulation in diabetic mice [26-28].
Macronutrients of microalgae
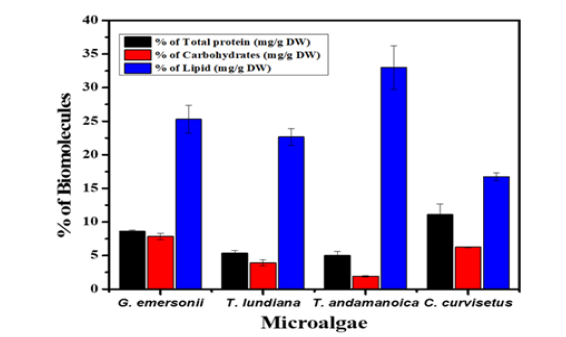
Macronutrients are essential dietary supplements consists proteins, carbohydrates and fats (lipids). Microalgae are primary producers in an aquatic ecosystem. They can synthesis macronutrients in photosynthesis, which are transferred to higher organisms through the food chain. The percentage of total protein content was following the order C. curvisetus (12.2%) > G. emersonii (8.5%) > T. lnudina (6.2%) > T. andamanica (4.2%). Whereas, carbohydrates content was higher in the case of G. emersonii (9.2%) followed by C. curvisetus (8.5%), T. lundiana (3.9%) and T. andamanica (2.5%). Total lipid content was higher in the case T. lundiana (32.9%) compared to G. emersonii (25.2%), T. andamanica (22.6%) and C. curvisetus (16.7%) (Figure 3). From macronutrients analysis, the species C. curvisetus cultures were suitable for protein and carbohydrate production as compared to lipids. Whereas T. lundiana, G. emersonii, and T. andamanica species have high potential for production of natural lipids. Natural fats or lipids are lightweight biomolecules but they are major energy storage molecules.
Figure 3:Macronutrients composition of experimental microalgae. Data presented in the percentage of nutrients in one-gram dry biomass.
Endogenous small molecules composition of microalgae
In metabolomics analysis, chromatography techniques coupled with mass spectrometry (i.e. GC-MS or LC-MS/MS) are the ultimate approach to detecting and identify metabolites or conducting biochemical profiling. However, Liquid Chromatography (LC) has limitations, including column specificity, mobile phase selection, and the required larger sample volumes (10μL to 100μL). In contrast, Gas Chromatography (GC) has more advantages, such as required smaller sample (0.1 to 1μL). Even though, the identification of polar compounds, such as amino acids, sugars and organic compounds, remains challenging for gas chromatography. In present investigation, GC detection was improved by reducing the polarity of endogenous small compounds using silylating agents. In silylation reaction, the mass of small molecules increased while their polarity decreased with the addition of Trimethylsilyl (TMS) groups (Figure S2a-S2f). A total 171 metabolites were identified by GC-TQMS and categorized into amino acids, fatty acids, hydrocarbons, organic compounds, sugars and sterol derivatives (Table S1).
Figure S2:Mass spectra of polar compounds (a&b) amino acids, (c&d) fatty acids, (e&f) sugar molecules. The molecular mass of metabolite has been increased with addition Tetramethylsilyl (TMS) in silylation reaction.
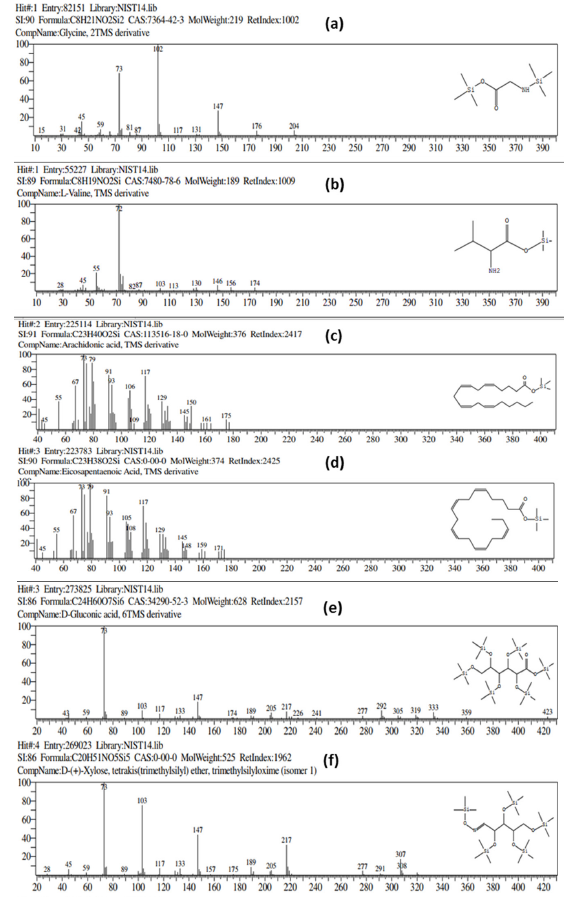
Table S1:Note: ND – metabolite not detected in respective organism

A – Amino acids derivative HC – Hydrocarbon derivative FA – Fatty acids derivatives OC – Organic compound derivatives S – Sugar derivatives, and ST- Sterol derivatives The symbol “Σ” represent the sum of metabolite classes TMS (trimethylsilyl) derivative – indicates the addition of extra mass (TMS=73.19g/mol) to the metabolite.
Amino acids composition
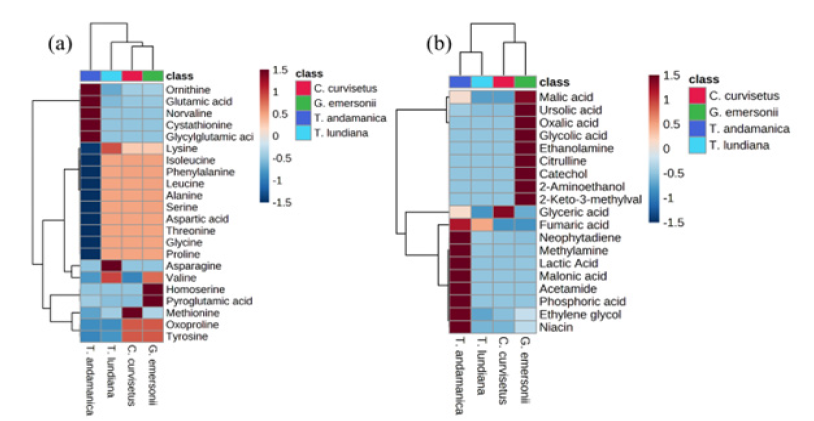
Amino acids are organic compounds consists both amino and carboxylic acid groups. They serve several biological functions, most notably acting as monomer units in protein synthesis. Amino acid and their derivatives are precursor in several metabolic reactions. They play key role in the biosynthesis of biomolecules such as lipids, nucleic acids, hormones and also act as signaling molecules. Currently, 22 different amino acids and derivatives have been identified in microalgae. Out of them, the amino acids ornithine (0.149.36±0.01mg/gDW), glutamic acid (0.316±0.058mg/ gDW) were quantitatively higher in T. andamanica than in other organisms (Figure 4a). Additionally, amino acids derivatives such as cystathionine (2.662±0.006mg/g DW), glycyglutamic acid (0.245±0.011.41mg/gDW), and norvaline (0.013±0.001mg/gDW) were also higher in T. andamanica (Table S1). Similarly, G. emersonii exhibited higher production of homoserine (0.059±0.009mg/ gDW) and pyroglutamic acid or oxyproline (0.644±0.001mg/ gDW). Whereas, the highest amount of methionine production (0.046±0.01mg/g DW) was found in C. curvisetus. Correspondingly, asparagine (0.727±0.044mg/gDW) production was higher in T. lundiana than in other algae.
Heatmap analysis revealed no significant difference in the production of alanine, aspartic acid, glycine, isoleucine, leucine, phenylalanine, proline, serine, and threonine in G. emersonii, C. curvisetus and T. lundiana (Figure 4a). From this observation, these amino acids may be essential to balance the intracellular cellular polarity and play key role in metabolic reaction. For example, alanine is involved in energy metabolism, managing nitrogen flow and acts as temporary nitrogen storage form. The up taking rate of Dissolved Form of Free Amino Acids (DFAA) increases under nitrogen depleted conditions in marine microalgae, enhancing their tolerance to nitrogen starvation [29]. Aspartic acid participates in the biosynthesis of nucleotides for DNA and RNA. It also plays important role in citric acid cycle and serves as a precursor for different other amino acids, including methionine and lysine [30]. In marine diatoms glycine and serine are participated in the synthesis of N-containing compounds such as glutamate through the glyoxylate pool. Additionally, glycine is a precursor for porphyrins, purines and is essential for the synthesis of glutathione [31]. Isoleucine and proline are stress markers they involved in the protein folding and enhance stress resistance during nutrient depletions [32].
Organic compounds composition
Organic Compounds (OCs) are small compounds containing carbon, hydrogen, oxygen and nitrogen elements. OCs are essential precursors for various metabolites’ biosynthesis and also necessary for life. In the present study, 19 different organic compound derivatives were identified frm in the experimental algal extracts (Table S1). Three organic compounds such as lactic acid (44.062±1.642mg/gDW), neophytadiene (13.929±5.311mg/g DW) and phosphoric acid (11.765±0.926mg/g DW) were quantitatively higher in T. andamanica compared to other algal species. Whereas the highest amount of glyceric acid (17.726±3.08mg/ gDW) accumulation was noticed in C. curvisetus than other algae. Heatmap analysis of organic acids revealed that organic compounds production significantly decreased in both C. curvisetus and T. lundiana species, except for the production of glyceric acid and fumaric acids. The accumulation of methylamine, lactic acid, malonic acid, acetamide, phosphoric acid, ethylene glycol and niacin were closely related in T. anadmanica and forming single cluster (Figure 4b). Lactic acid is formed from pyruvate in anaerobic condition. Lactic acid has been used as a natural disinfectant in food industries and curing agent. Accumulation of lactic acid increases the acid load in the cytosol, which induces cellular acidification under low oxygen stress in Arabidopsis thaliana in response to hypoxia stress [33]. Cellular acidification (low pH) promotes plant survival under hypoxia conditions and also enhance the endoproteases activity [34].
Figure 4:Heatmap analysis of amino acids (a) and organic compounds (b) composition of microalgae. Right side colure scale bare (+1.5 to -1.5) represent the up and down regulation of metabolites production in respective microalgae. Left side cluster indicate the quantitative closeness of metabolites.
Fatty acids composition
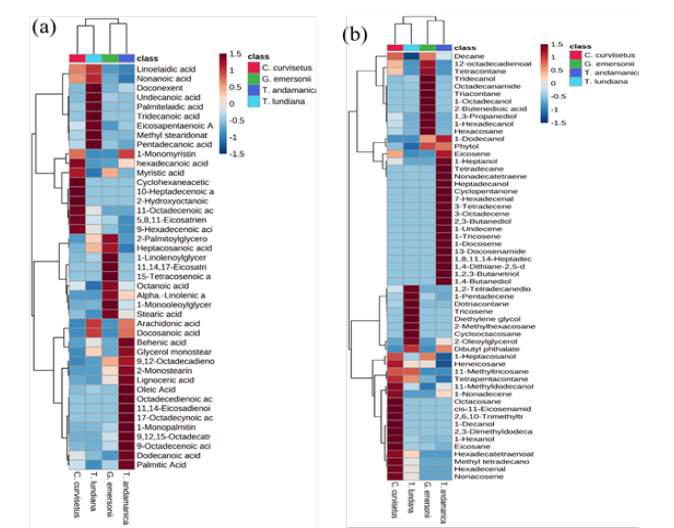
Fats are light weight non-polar molecules that play an important role in the biosynthesis of phospholipids and store energy. Microalgae are the major source of diverse fatty acids. In the present study, 43 different fatty acids are identified in the experimental algae (Table S1). Out of them, the fatty acids 1-monopalmitic acid (21.859±0.386mg/gDW), 9,12-octadecedienoic acid (11.13±2.82mg/gDW), 9-Octadecenoic acid (11.104±0.686 mg/ gDW), Doconexent (DHA–17.618±1.431mg/ g DW), glycerol monostearic acid (10.89±3.26mg/g DW), oleic acid (11.59±3.22mg/ gDW), palmitic acid (20.25±0.19mg/gDW), and 9-octadecanoic acid (11.11±0.69mg/gDW) production were higher in case of T. andamanica than other algae. Whereas the production of alphalinolenic acid (ALA-19.231±2.957mg/gDW) and stearic acid (16.116±0.136mg/g DW) were higher in the case of green algae G. emersonii as compared to diatoms. In the case of T. lundiana, two SFAs pentadecanoic acid (2.98±0.33mg/gDW) and undecanoic acid (4.01±0.24mg/gDW) and one monounsaturated fatty acid palmitelaidic acid (3.99±1.92mg/gDW) accumulation was higher compared to in other algae. The highest amount of eicosapentaenoic acid (EPA–3.551 ±0.251mg/g DW) was found in C. curvisetus compared to other algae. Diatom T. andamanica was capable of producing higher amount of total fatty acids (130.857±11.758mg/ gDW) with variety fatty acids as compared to T. lundiana, C. curvisetus and the green algae G. emersonii. From heatmap analysis, the accumulation of 9,12,15-Octadecatrienoic acid, dodecanoic acid, 11,14-eicosadienoic acid, 1-monopalmitin, palmitic acid oleic acid, octadecedienoic acids and 17-octadecynoic acid were significantly higher and forming single cluster (Figure 5a). This indicate that the biosynthesis of these fatty acids may be essential and they play key role in lipid metabolism of T. andamanica.
Recently, the Thalassiosira species have been explored as a primary source of various bioactive compounds such as n-3, n-6, and Monounsaturated Fatty Acids (MUFAs) [35-37], volatile fatty acid [38], glycerolipids [39] and phytosterols [40,41]. Especially, Eicosapentaenoic Acid (EPA) and Docosahexaenoic Acid (DHA) are n-3 PUFAs, they are essential bioactive substances that are used in various nutritional formulas to promote human health and prevention or treatment of coronary heart diseases, hypertension, ocular diseases, arthritis, and cystic fibrosis [42,43]. Addition EP and DHA are the primary precursors to anti-inflammatory eicosanoids biosynthesis [44]. Omega-3 PUFAs have strong anti-inflammatory potential, and are critical in combating Insulin Resistance (IR) [45]. DHA and EPA not only suppress IR but also acts as Angiotensin- Converting Enzyme Inhibitors (ACE-I) or Angiotensin Receptor Blockers (ARB), reducing albuminuria and Coronary Artery Disease (CAD) in T2DM individuals [46]. Furthermore, supplementation with DHA (1000mg) and EPA (200mg) has proven effective in alleviating painful neuropathy and reducing oxidative stress [47].
Hydrocarbons composition
Hydrocarbons are hydrophobic compounds consists hydrogen and carbon. Unlike proteins, phospholipids, fatty acids and carbohydrates, hydrocarbons don not have phosphorous, nitrogen and carboxylic groups. Bio-hydrocarbons (i.e., Alkane and alkenes) have high energy and can be substituted for petroleum derived fuels. Recently, biosynthesis of three types of bio-hydrocarbons namely alkanes, terminal alkenes (1-alkenes) and internal alkenes has been discovered from fatty acids [48]. Alkane and alkenes are alternative to fossil fuels. In this study, 57 different hydrocarbon compounds were detected. Out of them, the alkanes eicosene (1.902±0.299mg/ gDW), nonadecatetraene (2.242±0.04mg/gDW) and tetradecane (3.335±0.541mg/gDW) were dominant in T. andamanica compared to other algae.
Similarly, the alkenes derivatives (i.e. terminal and internal alkenes) 1,4-butanediol (4.421±0.265mg/gDW), 2,3-butanediol (2.132±0.681mg/gDW), 3-octadecene (4.889±1.477mg/gDW), 1-docosene (2.101±0.044mg/g DW), 1-tricosene (2.335±0.201mg/ gDW), and 1,8,11,14-heptadecatetraene (5.921±0.053mg/gDW) accumulation was found in T. andamanica. Whereas eicosane (2.904±0.172mg/gDW) and 1-decanol (1.638± 0.024mg/gDW) were quantitatively higher in C. curvisetus than other algae (Table S1). The heatmap analysis of hydrocarbon indicates that the accumulation of 1,4-butanediol, 1-docosene, eicosene, 1-heptanol, heptadecanol, cyclopentanone, nonadecatetraene, tetradecane, 1-undecene, 1-tricosene were closely related in T. andamanica (Figure 5b). From these observations, intracellular hydrocarbons are may be synthesized from fatty acids in microalgae. Previously, the biosynthesis pathway of bio-hydrocarbons (alkanes) from fatty acids was discovered in Synechococcus elengatus PCC 7942 [49]. Moreover, the discovery of an algae specific photoenzyme (glucosemethanol- choline oxidoreductase) in Chlorella varibilis NC 64A confirmed the biosynthesis pathway of alkanes in microalgae. The photoenzyme converts free fatty acids to n-alkanes or alkenes in response to blue light [50]. In vivo experimental study confirmed that Synechoccus sp. PCC 7022 mutants lacking hydrocarbon biosynthesis pathways induced thylakoid membrane curvature, optimal growth, cell division and enlarging the cell size compared to wild type [51]. Hydrocarbons act as antidesiccant and water proofing agents in insects [52]. These studies strongly support the accumulation of bio-hydrocarbons in the experimental microalgae may be supporting the cell growth, cell size and membrane fluidity.
Figure 5:Heatmap analysis of fatty acids (a) and hydrocarbons (b) composition of microalgae. Right side colure scale bare (+1.5 to -1.5) represent the up and down regulation of metabolites production in respective microalgae. Left side cluster indicate the quantitative closeness of metabolites.
Sugar and sterol composition
Sugar and sugar derivatives are major reservoirs of carbon and energy. The catabolic reaction of sugars and their derivatives produce direct energy in the form of ATP, NADPH, FAD and GTP. Microalgae can synthesize diverse sugar molecules through the photosynthesis mechanism and excess sugar molecules can store as monosaccharaides or disaccharides or polysaccharides. Microalgae can excrete the sugar molecule as Extracellular Polysaccharides (EPS) which protect the organism from external infection causing agents. In this study, we have 26 different sugars derivatives in the experimental microalgae (Table S1). Out of them, galactopyranose (1661±0.126mg/gDW) and ribonic acid (0.762±0.023mg/ gDW) were higher in T. lundiana than other algae. However, the accumulation of glucopyranoside (0.921±0.023mg/gDW), maltose (2.903± 0.154mg/gDW), myo-inositol (0.986±0.002mg/gDW), trehalose (1.534±0.179mg/gDW), and turanose (1.72± 0.458mg/ gDW) were higher in T. andmanica compared to other algae. In the case of G. emersonii, highest amount of glyceryl-glycoside (0.627±0.047mg/gDW) was noticed. The correlative heatmap of sugars indicates that the diatoms T. andamanica and T. lundiana are major sources for variety of sugar derivatives as compared to C. curvisetus and G. emersonii. However, there was no significant difference in the production of glycerly-glycoside, mannobiose, threonic acid, inositol and lactose in C. curvisetus and G. emersonii (Figure 6).
Figure 6:Heatmap analysis of sugar and sterol composition of microalgae. Right side colored scale bare (+1.5 to -1.5) represent the up and down regulation of sugar and sterol derivatives in respective microalgae. Left side cluster indicate the quantitative closeness of metabolites.
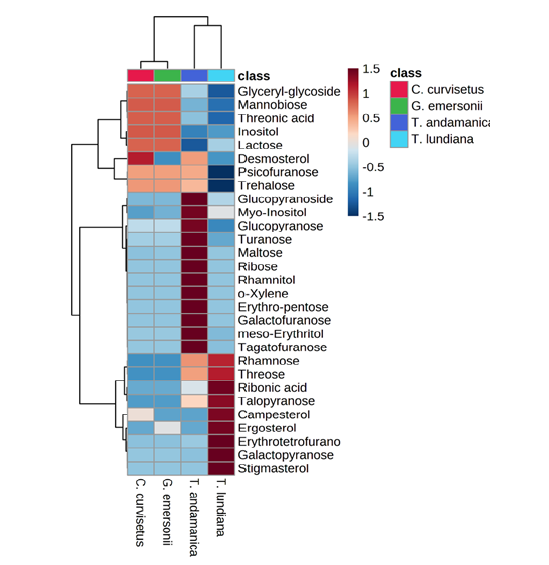
Sterol and sterol derivatives are a class of triterpenoid molecules, involved in the regulation of the biological process of cells and act as pillars to sustain the domain structure of cell membranes [40,53]. There are four sterol derivatives such as campesterol, desmosterol, ergosterol, and stigmasterol were identified in the present study (Table S1). The highest amount of campesterol (0.55±0.377mg/ gDW), ergosterol (15.568±0.741mg/gDW) and stigmasterol (0.3±0.001mg/gDW) were noticed in the case of T. lundidana than G. emersonii, T. andamanica and C. curvisetus species. The heatmap depict that the accumulation of campesterol and ergosterol were closely related, but stigmasterol accumulation is unique in T. lundiana (Figure 6). From these observations, the T. lundidana might be resistant to higher salinity and thermal stress conditions than others. Many research findings reported that sterol accumulation can improve the cellular integrity, and fluidity and enhances the permeability of lipid bilayer [54]. Previously, the Shoubaky research team has found the accumulation of diverse sterol components in two brown algae. According to them, campesterol was detected in both species, but they observed significant differences in quantity i.e. Padina pavonica (3.14%) and Hormophysa triquetra (0.4%) [55,56].
Principal Component Analysis (PCA)
PCA, is a dimensionality reduction method used to simplify large datasets. In this study, quantitative biological triplicate data sets (n=3) of four microalgal metabolites were analyzed using PCA to evaluate algal production efficiency based on Euclidean distance or similarity (at P>0.05 level). The analysis revealed distinct accumulation pattern of palmitelaidic acid (3.988±0.916mg/gDW) and ergosterol (15.568±0.741mg/gDW) in T. lundiana compared to other metabolites and algal species. Sterol are essential for cell membrane integrity, fluidity and serves as primary precursors for Vitamin D and bile acids [56,36]. Similarly, lactic acid (44.062±1.642mg/gDW) in T. andamanica, glyceric acid (17.726±3.08mg/gDW) in C. curvisetus, and alphalinolenic acid (19.232±2.957) in G. emersonii were quantitatively distinct. However, no significant differences were observed in the production of doconexent (17.618±4.314mg/gDW) in T. lundiana, glyceric acid (17.726±3.08mg/gDW) in C. cuervisetus, and stearic acid (16.116±0.136mg/gDW) in G. emersonii. Furthermore, palmitic acid (20.244±0.187mg/gDW) and 1-monopalmitin (21.859±0.386mg/gDW) accumulations showed no significant different in T. andamanica, but were significantly different compared to other metabolites and algae. Correspondingly, the production of neophytadiene (13.929±5.311mg/gDW), linoleic acid (11.126±0.814mg/gDW) glycerol monostearate (10.889±0.254mg/ gDW) and phosphoric acid (11.765±0.926) in T. andamanica was not significantly different within the species but was significantly different (p<0.05, n=3) compared to other metabolites and algae (Figure 7).
Figure 7:Principal component analysis of metabolites production in four different microalgae. The species specific metabolites represented with different symbols i.e. ●- G. emersonii, ◊- T. lundiana ■- T. andamanica, and □ - C. curvisetus. List of metabolites were presented in Table S1.
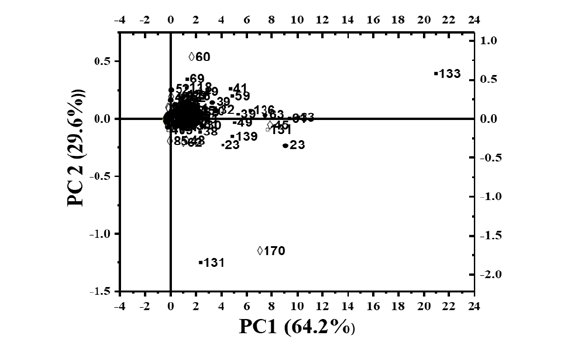
From this comprehensive anlaysis, thalassiosira (Diatoms) species were found to accumulate glycerol, lactic acid, and Omega-3 PUFAs derivatives. These compounds are widely utilized as food ingredients in the food industry and as bioactive agents in pharmaceutical and nutraceutical sectors [57-59]. Overall, the PCA analysis revealed species-specific metabolite accumulation, highlighting significant metabolic diversity among microalgae species.
Conclusion
Untargeted metabolomics revealed the chemical composition of four microalgae: C. curvisetus , G. emersonii, T. lundiana, and T. andamanica. Among them, T. andamanica exhibited the highest β-carotene (12.25mg/gDW), and fucoxanthin (9.8mg/gDW). Lipid accumulation followed the order: T. andamanica>G. emersonii>T. lundiana > C. curvisetus. Meanwhile, C. curvisetus has the highest protein content (11.09%) and G. emersonii contained the highest amount carbohydrate (7.83%). From metabolomics profiling, the essential fatty acids like EPA and DHA abundant in T. lundiana compared to the others algae. Principal Component Analysis (PCA) revealed significant differences in the production of lactic acid in T. andamanica, glyceric acid in C. curvisetus, and alpha-linolenic acid in G. emersonii (at p<0.05, n=3). Silylation was critical in improving GC-MS detection by reducing the polarity of small molecules, enabling the identification of 171 metabolites, which were categorized into amino acids, fatty acids, hydrocarbons, sugars and sterols. This method streamlined detection, outperforming traditional transesterification. From this comprised study, the Bacillariophyceae species (i.e. T. lundiana and T. andamanica) proved to be richer source of essential fatty acids, organic acids, hydrocarbons and sugar derivatives than G. emresonii.
Acknowledgement
MKP acknowledge CSIR-HRDG-EMRI, New Delhi, India for financial support as SRF (131170/2K19/1). The authors acknowledge CSIR-CSMCRI Analytical Division. This is a CSIRCSMCRI contribution No: 139/2022.
Authors Contribution
M.K.P and S.K.M developed the concept. The first two authors M.K.P and K.S.U are contributed equally to carrying the experimental work, data analysis and writing the manuscript with all figures. S.K.M has scrutinized the final MS. All authors approved the final version of the manuscript.
References
- Sood A, Uniyal PL, Prasanna R, Ahluwalia AS (2012) Phytoremediation potential of aquatic macrophyte, Azolla. Ambio 41(2): 122-137.
- Richards RG, Mullins BJ (2013) Using microalgae for combined lipid production and heavy metal removal from leachate. Ecol Modell 249: 59-67.
- Franchino M, Comino E, Bona F, Riggio VA (2013) Growth of three microalgae strains and nutrient removal from an agro-zootechnical digestate. Chemosphere 92(6): 738-744.
- Ali H, Khan E, Sajad MA (2013) Phytoremediation of heavy metals-concepts and applications. Chemosphere 91(7): 869-881.
- Shihira I, Krauss RW (1965) Chlorella, Physiology and taxonomy of forty-one isolates. Maryl Univ USA, pp. 1-97.
- Nozaki H, Katagiri M, Nakagawa M (1995) Taxonomic re-examination of the two strains labeled “Chlorella” in the microbial culture collection at the National Institute for Environmental Studies (NIES-Collection). Microbiol Cult Coll 11: 11-18.
- Kang NS, Cho K, An SM, Kim ES, Ki H, et al. (2022) Taxonomic and biochemical characterization of microalga Graesiella emersonii GEGS21 for its potential to become feedstock for biofuels and bioproducts. Energies 15(22): 8725.
- Pesant S, Not F, Picheral M, Kandels-Lewis S, Bescot NL, et al. (2015) Open science resources for the discovery and analysis of Tara Oceans data. Sci Data 2: 1-16.
- Vargas C, Audic S, Henry N, Decelle J, Mahé F, et al. (2015) Eukaryotic plankton diversity in the sunlit ocean. Science 348(6237).
- Lavaud J (2007) Fast regulation of photosynthesis in diatoms: Mechanisms, evolution and ecophysiology. Funct Plant Sci Biotechonology 1:267-287.
- Paidi MK, Attupuram A, Udata KS, Mandal SK (2023) Acetone diethyl ether-based biorefinery process for co-extraction of fucoxanthin, chlorophyll, DHA, and EPA from the diatom Thalassiosira lundiana. Algal Res 74: 103215.
- Krishna PM, Polisetti V, Damarla K, Mandal SK, Kumar A, et al. (2021) Improved biorefinery pathways of marine diatoms using a water miscible ionic liquid and its colloidal solution: Efficient lipid extraction and in situ synthesis of fluorescent carbon dots for bio-imaging applications. RSC Adv 11(35): 21207-21215.
- Singh K, Krishna PM, Kulshrestha A, Bharmoria P, Mandal SK, et al. (2022) Deep eutectic solvents based biorefining of value-added chemicals from the diatom Thalassiosira andamanica at room temperature. Sep Purif Technol 298: 121636.
- Marella TK, Tiwari A (2020) Marine diatom Thalassiosira weissflogii based biorefinery for co-production of eicosapentaenoic acid and fucoxanthin. Bioresour Technol 307: 123245.
- Levitan O, Dinamarca J, Hochman G, Falkowski PG (2014) Diatoms: A fossil fuel of the future. Trends Biotechnol 32(3): 117-124.
- Mæhre HK, Dalheim L, Edvinsen GK, Elvevoll EO, Jensen I (2018) Protein determination-method matters. Foods 7(1): 5.
- Lowry OH, Rosebrough NJ, Farr AL, Randall RJ (1951) Protein measurement with the Folin phenol reagent. J Biol Chem 193(1): 265-275.
- Dubois M, Gilles KA, Hamilton JK, Rebers PA, Smith F (1956) Colorimetric method for determination of sugars and related substances. Anal Chem 28(3): 350-356.
- Paidi MK, Agarwal P, More P, Agarwal PK (2017) Chemical derivatization of metabolite mass profiling of the recretohalophyte aeluropus lagopoides revealing salt stress tolerance mechanism. Mar Biotechnol 19(3): 207-218.
- Pang Z, Chong J, Zhou G, Lima MDA, Chang L, et al (2021) MetaboAnalyst 5.0: narrowing the gap between raw spectra and functional insights. Nucleic Acids Res 49(W1): W388-W396.
- Xia S, Wang K, Wan L, Li A, Hu Q, et al. (2013) Production, characterization, and antioxidant activity of fucoxanthin from the marine diatom odontella aurita. Mar Drugs 11(7): 2667-2681.
- Aslanbay Guler B, Deniz I, Demirel Z, Yesil-Celiktas O, Imamoglu E (2020) A novel subcritical fucoxanthin extraction with a biorefinery approach. Biochem Eng J 153: 107403.
- Shannon E, Abu-Ghannam N (2018) Enzymatic extraction of fucoxanthin from brown seaweeds. Int J Food Sci Technol 53(9): 2195-2204.
- Leu S, Boussiba S (2014) Advances in the production of high-value products by microalgae. Ind Biotechnol 10(3): 169-183.
- Kil-Nam K, Heo SJ, Kang SM, Ginnae Ahn, Jeon Y, et al. (2010) Fucoxanthin induces apoptosis in human leukemia HL-60 cells through a ROS-mediated Bcl-xL pathway. Toxicol Vitr 24(6): 1648-1654.
- Jeon SM, Kim HJ, Woo MN, Lee MK, Shin YC, et al. (2010) Fucoxanthin-rich seaweed extract suppresses body weight gain and improves lipid metabolism in high-fat-fed C57BL/6J mice. Biotechnol J 5(9): 961-969.
- Park HJ, Lee MK, Park YB, Shin YC, Choi MS (2011) Beneficial effects of Undaria pinnatifida ethanol extract on diet-induced-insulin resistance in C57BL/6J mice. Food Chem Toxicol 49(4): 727-733.
- Peng J, Yuan JP, Wu CF, Wang JH (2011) Fucoxanthin, a marine carotenoid present in brown seaweeds and diatoms: Metabolism and bioactivities relevant to human health. Mar Drugs 9(10): 1806-1828.
- Flynn K, Butler I (1986) Nitrogen sources for the growth of marine microalgae: Role of dissolved free amino acids. Mar Ecol Prog Ser 34: 281-304.
- Fang J, Qian J, Shi W, Mou H, Chen X, et al. (2023) Role of amino acid functional group in alga-amino acid-Zn ternary complexes. J Environ Chem Eng 11(6): 111350.
- Bromke MA (2013) Amino acid biosynthesis pathways in diatoms. Metabolites 3(2): 294-311.
- Liang X, Zhang L, Natarajan SK, Becker DF (2013) Proline mechanisms of stress survival. Antioxid Redox Signal 19(9): 998-1011.
- Beamer ZG, Routray P, Choi WG, Spangler MK, Lokdarshi A, et al. (2021) Aquaporin family lactic acid channel NIP2;1 promotes plant survival under low oxygen stress in Arabidopsis. Plant Physiol 187(4): 2262-2278.
- Thattai M (2017) Organelle acidification: An ancient cellular leak detector. BMC Biol 15(1): 51.
- Tonon T, Harvey D, Qing R, Li Y, Tony R, et al. (2004) Identification of a fatty acid Δ11-desaturase from the microalga Thalassiosira pseudonana. FEBS Lett 563(1-3): 28-34.
- Adarme-Vega TC, Lim DKY, Timmins M, Vernen F, Yan Li, et al. (2012) Microalgal biofactories: A promising approach towards sustainable omega-3 fatty acid production. Microb Cell Fact 11: 96.
- Mimouni V, Ulmann L, Pasquet V, Mathieu M, Picot L, et al. (2012) The potential of microalgae for the production of bioactive molecules of pharmaceutical interest. Curr Pharm Biotechnol 13(15): 2733-2750.
- Achyuthan KE, Harper JC, Manginell RP, Moorman MW (2017) Volatile metabolites emission by in vivo microalgae-an overlooked opportunity? Metabolites 7(3): 39.
- D’Ippolito G, Sardo A, Paris D, Vella FM, Adelfi MG, et al. (2015) Potential of lipid metabolism in marine diatoms for biofuel production. Biotechnol Biofuels 8: 28.
- Rampen SW, Abbas BA, Schouten S, Damsté JSS (2010) A comprehensive study of sterols in marine diatoms (Bacillariophyta): Implications for their use as tracers for diatom productivity. Limnol Oceanogr 55(1): 91-105.
- Yi Z, Xu M, Di X, Brynjolfsson S, Fu W (2017) Exploring valuable lipids in diatoms. Front Mar Sci 4: 1-10.
- Tonon T, Harvey D, Larson TR, Graham IA (2002) Long chain polyunsaturated fatty acid production and partitioning to triacylglycerols in four microalgae. Phytochemistry 61(1): 15-24.
- Schmidt K (2016) Thermal adaptation of Thalassiosira pseudonana using experimental evolution approaches. University of East Anglia, UK, pp. 1-234.
- Galloway AWE, Winder M (2015) Partitioning the relative importance of phylogeny and environmental conditions on phytoplankton fatty acids. PLoS One 10(6): e0130053.
- Abbott KA, Burrows TL, Acharya S, Thota RN, Garg ML (2020) DHA-enriched fish oil reduces insulin resistance in overweight and obese adults. Prostaglandins Leukot Essent Fat Acids 159: 102154.
- Elajami TK, Alfaddagh A, Lakshminarayan D, Soliman M, Chandnani M, et al. (2017) Eicosapentaenoic and docosahexaenoic acids attenuate progression of albuminuria in patients with type 2 diabetes mellitus and coronary artery disease. J Am Heart Assoc 6(7): e004740.
- Durán AM, Beeson WL, Firek A, Cordero-MacIntyre Z, León MD (2022) Dietary Omega-3 polyunsaturated fatty-acid supplementation upregulates protective cellular pathways in patients with type 2 diabetes exhibiting improvement in painful diabetic neuropathy. Nutrients 14(4): 1-23.
- Liu K, Li S (2020) Biosynthesis of fatty acid-derived hydrocarbons: Perspectives on enzymology and enzyme engineering. Curr Opin Biotechnol 62: 7-14.
- Schirmer A, Rude MA, Li X, Popova E, Cardayre SB (2010) Microbial biosynthesis of alkanes. Science 329(5991): 559-562.
- Sorigué D, Légeret B, Cuiné S, Blangy S, Moulin S, et al (2017) An algal photoenzyme converts fatty acids to hydrocarbons. Science 357(6354): 903-907.
- Lea-Smith DJ, Ortiz-Suarez ML, Lenn T, Nürnberg DJ, Baers LL, et al. (2016) Hydrocarbons are essential for optimal cell size, division, and growth of Cyanobacteria. Plant Physiol 172(3): 1928-1940.
- Howard RW, Blomquist GJ (2005) Ecological, behavioral, and biochemical aspects of insect hydrocarbons. Annu Rev Entomol 50: 371-393.
- Dufourc EJ (2008) Sterols and membrane dynamics. J Chem Biol 1(1-4): 63-77.
- Jaramillo-Madrid AC, Abbriano R, Ashworth J, Fabris M, Pernice M, et al. (2020) Overexpression of key sterol pathway enzymes in two model marine diatoms alters sterol profiles in Phaeodactylum tricornutum. Pharmaceuticals 13(12): 481.
- El Shoubaky GA, Salem EA (2014) Terpenes and sterols composition of marine brown algae Padina pavonica (Dictyotales) and Hormophysa triquetra (Fucales). Int J Pharmacogn Phytochem Res 6(4): 894-900.
- Abdelkarim OH, Wijffels RH, Barbosa MJ (2025) Exploiting microalgal diversity for sterol production. Frontiers in Plant Science 16: 1616863.
- Sivaramakrishnan R, Kanwal S, Incharoensakdi A, Nirmal N, Srimongkol P (2025) Exploring the nutraceutical and functional food potential of microalgae: Implications for health and sustainability. Journal of Agriculture and Food Research 22: 102148.
- Chandra P, Enespa Singh R, Arora PK (2020) Microbial lipases and their industrial applications: A comprehensive review. Microbial cell factories 19(1): 169.
- Kuppusamy P, Soundharrajan I, Srigopalram S, Yusoff MM, Maniam GP, et al. (2017) Potential pharmaceutical and biomedical applications of Diatoms microalgae-An overview. Ind J Geo Mar Sci 46(4): 663-667.
© 2025 Murali Krishna Paidi*,Subir Kumar Mandal. This is an open access article distributed under the terms of the Creative Commons Attribution License , which permits unrestricted use, distribution, and build upon your work non-commercially.
 a Creative Commons Attribution 4.0 International License. Based on a work at www.crimsonpublishers.com.
Best viewed in


.jpg)


 Editorial Board Registrations
 Submit your Article
 Refer a Friend
 Advertise With Us
.jpg)


.jpg)


.bmp)
.jpg)
.png)
.jpg)


.jpg)


.png)

.png)


.png)


