- Submissions

Full Text
Examines in Marine Biology & Oceanography
Study of the Sea Surface and Suspended Particles Using a Scanning Laser Wave Recorder
Sterlyadkin VV* and Kulikovsky KV
MIREA — Russian Technological University, Russia
*Corresponding author: Sterlyadkin Viktor V, MIREA — Russian Technological University, 119454 Moscow, Vernadsky Ave., 78, Russia
Submission: November 04, 2024;Published: November 11, 2024

ISSN 2578-031X Volume7 Issue 3
Opinion
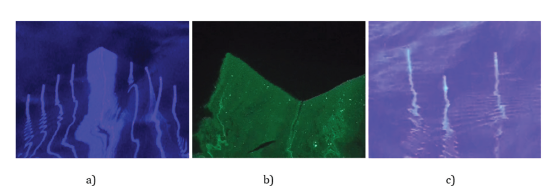
The works [1-6] propose methods for measuring the parameters of sea waves based on a wave recorder, which scans the sea surface with a laser beam and records the scattered radiation on a video camera. The laser beam, falling from top to bottom, is almost not scattered in the air and begins to scatter in the sea water on the organic and inorganic inhomogeneities contained in it. The upper boundary of the laser beams or laser «curtain» on the video frames corresponds to the water-air interface. Taking into account the calibration, the position of the boundary on the video frames is recalculated into the elevations of the sea surface at all illuminated points on the interface. Figure 1 shows various options for scanning the sea surface. Scanning along a given trajectory with stops at individual points, Figure 1a, allows, with the frequency of the video camera (up to 90Hz), to obtain elevations on each beam and a profile near the turning point. This allows calculating the frequency spectra of waves, two-dimensional distributions of surface slopes on triangles of different scales. Figure 1b shows an example of continuous scanning of the surface in two orthogonal directions to obtain a wave profile and a spatial spectrum [2]. In order to increase the signal/noise ratio under bright daylight conditions, we used the three-point measurement mode, Figure 1c.
Figure 1:Video frames obtained in different laser scanning modes of the scanner: a) Scanning with stops at individual points, b) Continuous scanning; c) Daytime measurements at three points.

By synchronizing the start of the laser beam sweep with the start of each frame exposure, it is possible to obtain “instantaneous” wave profiles reduced to a single moment in time with an accuracy of up to 10-4s [1,5,6]. The error in recording the sea surface profile depended on the size of the focused beam (~1mm) and the resolution of the video camera matrix, and in our measurements was 0.5-0.2mm. This made it possible to record capillary waves on the sea surface from a distance of 5-7 meters and study their characteristics.
Note that information about the sea surface is contained not only in the position of the upper points of the laser beams, but also in the distortions of the laser beams that are recorded by the video camera. In [4], it is shown that the deviation of the beams in the image from a straight line is associated with the slopes of the sea surface at the points through which the beam image exits the surface and enters the video camera lens. The high sensitivity of the laser beam to surface slopes allows for precision measurements of capillary waves. Thus, Figure 1a & 1c show high-frequency distortions of the laser line shape associated with the appearance of a capillary wave on the surface. Analysis of these distortions allows us to measure the direction of propagation of the capillary wave, its shape, wave vector and amplitude. It turned out that, based on the shape of distortions in natural conditions, it is possible to register capillary oscillations with an amplitude of up to 50μm from a distance of 6 meters [4]. We were unable to find analogs of such measurements.
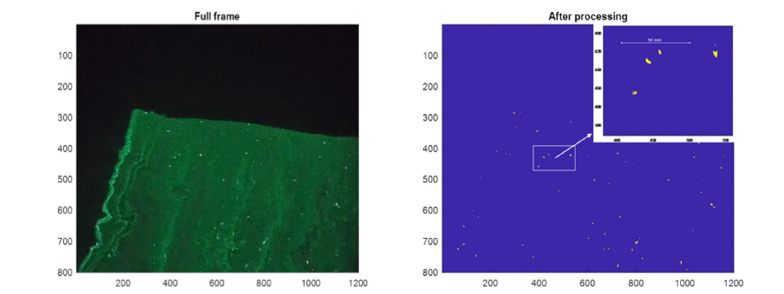
An interesting application of a scanning laser wave recorder is associated with registering the concentration of suspended particles in seawater. Figure 2a shows a typical video frame in which a green laser forms a light curtain in seawater. This frame clearly shows irregularities of various sizes that scatter the laser radiation incident on them. The best selection of such irregularities occurred in the red channel of the video image. The intensity of the background illumination of the image is apparently responsible for the fine fraction of suspended particles. Subtraction of background illumination allows us to obtain an array of larger inhomogeneities, Figure 2b. Analysis of such an image will allow us to obtain the distribution of scatterers by size and their concentration, since the volume of the illuminated area is easily calculated from the thickness of the laser beam and the area of the illuminated section. Interpretation of the obtained data is beyond the scope of our research, however, the proposed measurement method may be of interest to ecologists and biologists.
Figure 2:A light “curtain” formed in sea water allows one to calculate the concentration and size distribution of suspended particles. a) Original image; b) Distribution of diffusers in space after subtracting background illumination.

The advantage of the proposed methods is the remote nature of the measurements, which do not distort the properties of the surface and can be carried out in almost any weather, even in strong winds and the presence of currents. The possibility of conducting measurements both at night and during the day in the presence of background illumination is shown. The direct nature of the measurement of sea surface profiles and elevations allows us to recommend the proposed methods as a reference when compared with other indirect methods of measuring sea wave parameters.
Acknowledgement
The work was carried out with the financial support of the Russian Science Foundation grant RSF No. 23-17-00189.
References
- Sterlyadkin VV, Kulikovsky KV, Kuzmin AV, Sharkov EA, Likhacheva MV (2021) Scanning laser wave recorder with registration of “instantaneous” sea surface profiles. J Atmos Oceanic Technol 38(8): pp. 1415-1424.
- Sterlyadkin VV, Kulikovskii KV, Badulin SI (2024) Field measurements of sea surface shape and one-dimensional spatial wave spectrum. Modern problems of distant sensing of the Earth from space 21(1): 270-285.
- Sterlyadkin VV, Kulikovsky KV (2022) Measurement of capillary waves with a laser wave recorder. Russ Technol J 10(5): 100-110.
- Sterlyadkin VV (2024) The problem of reconstructing the profile of the sea surface from the video image of laser beams. Oceanology 64: 342-352.
- Sterlyadkin VV (2021) Scanning optical wavegraph. Patent RU 2746186.
- Sterlyadkin VV (2021) Scanning laser wavegraph with registration of the “instantaneous” surface shape. Patent RU 2749727.
© 2024 Sterlyadkin VV. This is an open access article distributed under the terms of the Creative Commons Attribution License , which permits unrestricted use, distribution, and build upon your work non-commercially.
 a Creative Commons Attribution 4.0 International License. Based on a work at www.crimsonpublishers.com.
Best viewed in


.jpg)


 Editorial Board Registrations
 Submit your Article
 Refer a Friend
 Advertise With Us
.jpg)


.jpg)


.bmp)
.jpg)
.png)
.jpg)


.jpg)


.png)

.png)


.png)


