- Submissions

Full Text
Environmental Analysis & Ecology Studies
Mapping Carbon Stock from Landcover Dynamics within the Southern Slope of Mount Bamboutos, Cameroon
Abel Tsolocto1*, Jean-Marie Fotsing2 and Théophile Zognou3
1 University of TELUQ, Montreal, Canada
2 University of New Caledonia
3 Sangha Trinational: Transboundary World Heritage site, Congo and Central African Republic, Cameroon
*Corresponding author:Abel Tsolocto, University of TELUQ, Montreal, Cameroon
Submission: September 17, 2025; Published: October 21, 2025

ISSN 2578-0336 Volume13 Issue 2
Abstract
The southern slope of Mount Bamboutos, Cameroon, a critical tropical montane ecosystem, faces escalating landcover degradation, threatening carbon stocks and biodiversity. This study integrates remote sensing (Landsat/SPOT imagery: 1992-2023) with dendrometric inventories from 30 plots (20mx20m) to quantify landcover changes and associated carbon stock variations. Results show a 23.62% decline in dense montane forest over three decades, with modified agroforestry and grassland/cropland expanding by 28.04% and 56.50%, respectively. Agroforestry systems dominated by Eucalyptus grandis and Persea americana exhibited the highest aboveground carbon density (2.15kg/m²), despite lower biodiversity (Shannon H′=1.70). Dense forests demonstrated the greatest species richness (H′=3.67) but lower carbon density (0.38kg/m²), while grassland/cropland stored minimal carbon (0.20kg/m²). Tree structural parameters (DBH, height, density) strongly predicted carbon stock (R=0.738, p<0.001). Projections suggest cropland/grassland may exceed 50% coverage by 2050, further reducing carbon sequestration capacity. The findings underscore the need for integrated REDD+initiatives, forest restoration, and sustainable agroforestry practices to safeguard ecosystem services. Spatially explicit carbon maps and targeted strategies are proposed to inform climate mitigation policies in Cameroon’s montane landscapes.
Keywords:Carbon stock dynamics; Landcover change; Mount Bamboutos; Agroforestry; REDD+; Remote sensing; Biodiversity conservation; Aboveground biomass; Cameroon highlands; Climate mitigation
Introduction
Background to the study
The global rise of atmospheric Carbon Dioxide (CO2) concentration has intensified concerns about climate change, environmental degradation, and the role of terrestrial ecosystems in mitigating these effects. Forests covering approximately 30% of the world’s land area store about 80 billion tonnes of carbon in live biomass and organic matter, making them the largest terrestrial carbon sinks [1,2]. Among these, tropical montane forests, such as those on Mount Bamboutos in Cameroon, possess high carbon sequestration potentials, often exceeding those of lowland tropical rainforests, and also harbor rich biodiversity and critical ecosystem services [3,4].
Carbon fluxes, representing the exchange of carbon between ecosystems, atmosphere, oceans, and soils, are influenced by anthropogenic activities including deforestation, land use changes, and fossil fuel combustion, which disturb the natural carbon balance by reducing carbon stocks and increasing greenhouse gas emissions [5-7]. In Africa, forest cover has been progressively declining since 1990, driven primarily by agricultural expansion and population pressures, posing risks to climate regulation, soil stability, and biodiversity conservation [8,9].Cameroon, recognized for its ecological diversity and extensive forest resources, notably including montane ecosystems like Mount Bamboutos, faces significant forest degradation challenges from land conversion and unsustainable land use [3,10].
Land use and land cover change (LULCC) are identified as critical drivers affecting terrestrial carbon stocks and ecosystem integrity [2,11]. Monitoring these changes with remote sensing and Geographic Information Systems (GIS) allows for the temporal and spatial assessment of land degradation and forest loss, crucial for diverse landscapes including complex montane terrains such as the Southern slope of Mount Bamboutos [12,13]. These technologies enable accurate mapping of canopy cover, biomass estimation, and evaluation of carbon sequestration to inform policy and restoration efforts.
The Southern slope of Mount Bamboutos features diverse land cover types: dense montane forests, modified montane forests/ agroforestry systems, and grassland/cropland mosaics. These differ distinctly in tree species composition, diversity, biomass density, and carbon sequestration capacities [14]. Dense montane forests harbor the highest species richness and diversity, while modified montane forest/agroforestry supports the highest carbon stock per hectare. Grassland and cropland, though exhibiting lower carbon stocks, have expanded significantly due to demographic pressures and economic activities [14]. Socio-political instability in recent years has further complicated land management, causing population displacement, forest regeneration in abandoned areas, and shifts in land use patterns.
Carbon financing mechanisms such as REDD+ (Reducing Emissions from Deforestation and forest Degradation) have emerged globally as effective incentives for forest conservation and climate mitigation but remain underdeveloped in this landscape [15,16]. Despite known benefits of agroforestry and forest conservation, a lack of targeted carbon policy frameworks limits the integration of these approaches in local development and restoration strategies [10,14].Given the observed decline in dense montane forest cover by approximately 23.62% from 1992 to 2023, concurrent with expansion of agroforestry and cropland, and predicted future increases in non-forest landcover by 2050, urgent action is necessary to safeguard ecosystem integrity and carbon storage capacity [7,14]. Remote sensing combined with field-based biomass and carbon quantification provides reliable data to guide restoration, conservation, and policy interventions to mitigate climate change impacts in this and similar tropical montane ecosystems.
Problem statement
The montane forests of Western Cameroon, particularly the Southern slope of Mount Bamboutos, are undergoing rapid degradation due to escalating demographic pressures and agricultural expansion that threaten biodiversity, ecosystem services, and important carbon sinks. Compounding these pressures, sociopolitical unrest has displaced populations, triggering complex land use shifts that include forest regeneration in some abandoned zones and grassland and cropland expansion in others. Despite its ecological significance, there is no comprehensive spatial assessment articulating detailed relationships between landcover dynamics and carbon stock within this region to inform sustainable management and conservation planning. Current observations indicate a shrinking dense montane forest area, increased agroforestry and cropland extents, and fluctuating settlement patterns, but the resultant impacts on carbon stocks remain understudied and poorly quantified. The absence of local carbon policy frameworks and REDD+ initiatives further constrains opportunities to harness carbon finance mechanisms that could incentivize conservation and restoration. Thus, establishing accurate baselines on landcover change and associated carbon sequestration is essential for guiding proactive policy-making, ecosystem rehabilitation, and socio-economic development.
Research questions
A. What is the pattern of land cover dynamics on the Southern
slope of Mount Bamboutos over the past three decades?
B. How much carbon stock is associated with different land cover
types in this landscape?
C. What restoration and REDD+ strategies can feasibly enhance
carbon sequestration and ecosystem resilience here?
Research objectives
A. Analyze the spatial and temporal dynamics of land cover
changes between 1992 and 2023 on the Southern slope of
Mount Bamboutos.
B. Quantify carbon stocks across dominant land cover types using
dendrometric measures of tree species diversity, biomass, and
structure.
C. Propose restoration and REDD+ strategies tailored to the
ecological and socio-economic context of the area.
Literature Review
This section presents a comprehensive review of critical concepts and related studies relevant to this research on Mapping Carbon Stock from Landcover Dynamics within the Southern Slope of Mount Bamboutos, Cameroon. The review is organized under conceptual review, analytical framework, empirical studies, theoretical framework, and identified gaps.
Conceptual review and analytical framework
Landcover and land use change using remote sensing: Land is defined as the surface area where human activities occur, shaped by both biophysical features and socio-economic forces. Land cover refers to the physical attributes of the earth’s surface such as forests, grasslands, croplands, or buildings, whereas land use describes human activities applied to land cover such as agriculture or settlements [17,18]. Land cover changes significantly due to population growth, economic activities, and environmental factors. Monitoring these changes is essential for managing natural resources and mitigating ecological degradation. Remote sensing offers an effective tool for this purpose by enabling repeated, synoptic observations over large areas at different time intervals [19]. Various change detection techniques have been developed, including image differencing, post-classification comparison, and advanced modeling, with post-classification comparison being among the most flexible for multi-temporal analysis [20,21].
Supervised classification techniques, employing known “training samples,” have provided high accuracy in land use classification, with many studies (e.g., Rawat et al. [22] Tewabe et al. [23]) reporting above 80% classification accuracy using maximum likelihood algorithms. The challenge in land use change detection lies in temporal, spatial, and spectral resolution variations that must be accounted for when interpreting multi-date satellite images [24].
Land covers change analysis: Land cover considers the biophysical state of the surface [25], while land use reflects human intervention. Changes in land cover and land use, driven by factors such as urban expansion, agricultural intensification, and deforestation, impact ecosystem services including carbon storage. Land cover mapping and change detection inform sustainable land management decisions and serve as a basis for ecosystem restoration efforts [26]. Understanding spatial and temporal patterns of land cover is particularly critical in ecologically sensitive areas such as the montane landscape of Mount Bamboutos.
Review of aboveground carbon stock
Carbon sequestration is the process by which CO2 is absorbed from the atmosphere into plant biomass and soils through photosynthesis and stored over time [27]. Forest ecosystems are the largest terrestrial carbon pools, storing approximately 80- 90% of the global aboveground carbon and playing a vital role in climate change mitigation [28] (Brown et al., 2002). Afforestation, reforestation, and sustainable agroforestry have been widely recognized as practical strategies for increasing carbon stock in tropical regions [29]. Land use changes such as deforestation contribute significantly (~25%) to global greenhouse gas emissions [27].
Estimating carbon stock typically involves quantifying aboveground biomass through tree species identification, Diameter at Breast Height (DBH) measurements, and applying allometric equations validated for specific forest types [30]. Carbon pools include aboveground biomass, belowground biomass, soil organic carbon, and dead organic matter, though the latter two are sometimes excluded due to estimation complexities. Remote sensing and Geographic Information Systems (GIS) have become indispensable tools for estimating forest carbon stocks over large areas, allowing spatially explicit assessment and monitoring [31]. Landsat satellite series, particularly Thematic Mapper (TM) imagery with 30m spatial resolution, is extensively used for this purpose due to its consistent global coverage and spectral capabilities.
Tree species diversity and carbon sequestration: Biodiversity, particularly species richness and evenness within forest communities, influences ecosystem functions including carbon sequestration [32]. Diverse forests tend to have higher productivity and carbon storage capacities than less diverse ones [33]. The Shannon-Weiner diversity index and Simpson dominance index are commonly applied metrics to quantify species diversity and dominance patterns in ecological studies [34].
The role of forest carbon stock on climate change mitigation
Forests contribute to climate regulation by absorbing CO2 from the atmosphere, mitigating global warming [35]. The net ecosystem productivity (NEP) of forests depends on photosynthetic uptake and respiration losses [36]. Disturbances like deforestation convert forests from carbon sinks to sources, while regeneration and afforestation reverse the trend [37]. REDD+ (Reducing Emissions from Deforestation and Forest Degradation) frameworks emphasize forest conservation and sustainable management as pathways for climate action with socio-economic benefits. Forest carbon trading mechanisms, such as carbon credits under Kyoto Protocol, offer financial incentives for sequestration activities, potentially improving livelihoods for rural communities [15].
Forest cover and related changes in Cameroon
Cameroon, often described as “Africa in miniature,” covers about 48% forest area, comprising dense lowland and montane forests. However, deforestation and forest degradation due to agriculture, logging, and population pressures threaten this resource [38]. The montane forests of the western highlands, including Mount Bamboutos, are particularly fragile ecosystems with high biodiversity and carbon storage potential yet face increasing land use pressures. Forest cover data between 1990 and 2010 in Cameroon indicates steady declines due to anthropogenic activities affecting carbon sequestration potential [39]. Effective forest management including community-based initiatives and REDD+projects are seen as vital for reversing these trends [40].
Theoretical framework
The Theory of Sustainable Forest Management (SFM) guides this study, stressing the maintenance of forest resources to fulfil ecological, economic, and social needs for present and future generations [41]. The framework integrates forest area size, biodiversity, health, productivity, and socio-economic governance to evaluate and promote sustainable landscape management [42,43].
Gaps and contribution
Existing literature on carbon stock estimation has relied predominantly on labor-intensive allometric approaches and localized studies with limited spatial coverage. Remote sensingbased carbon stock mapping remains underutilized in the Mount Bamboutos region. This study fills these gaps by applying geospatial technologies and field inventory data to produce carbon stock maps, analyze land use dynamics over three decades, and propose restoration and REDD+ implementation strategies tailored to the landscape’s ecological context.
Study Area and Methodology
Study area
Geographical location:
a. The study focuses on the southern slope of Mount Bamboutos
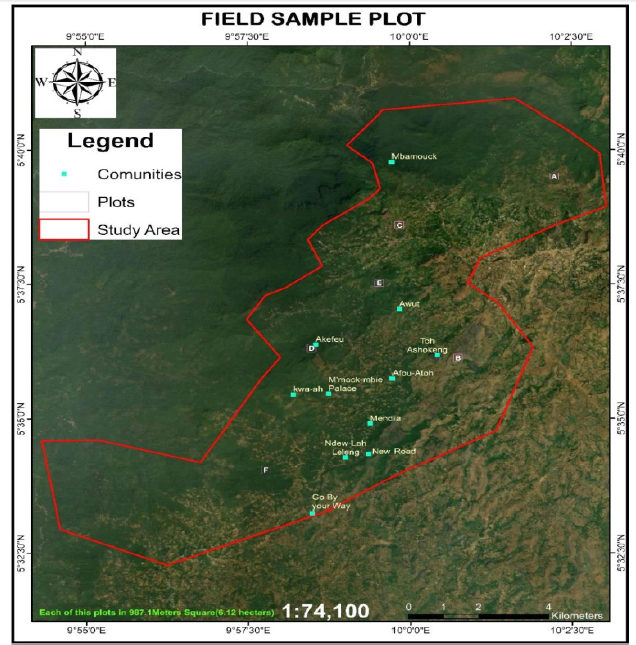
Caldera in Cameroon (Figure 1).
b. Coordinates: Between latitudes 5˚44’ and 5˚36’N and
longitudes 9˚55’ and 10˚07’E.
c. Elevation ranges from 800m to 2700m above sea level.
d. The area includes part of Lebialem Division (Alou and Wabane)
and extends into the Bamileke Southwest slope.
e. The southern slope is a transitional zone between the dense
forests of Southwest Cameroon and montane forest/grassland
ecosystems.
f. It hosts the Tofala Hills Wildlife Sanctuary (created in 2014).
g. Key communities studied: M’mockmbie, Fossimondi, Fossong
Leleng, Tsenkeng, and Fossongu Nwangong.
Figure 1:Field sampling plot locations and study area in Southwest Cameroon.
Physical setting:
a. Climate: High rainfall averaging around 7,000mm annually,
highest in August; temperature ranges, cooler at higher
elevations.
b. Topography: Very rugged with steep hills, valleys, and a long
escarpment creating the Mount Bamboutos caldera. Volcanic
soils from basalt and trachyte dominate.
c. Hydrology: The southern slope forms part of the Manyu
Watershed, which drains into the Cameroon Cross River.
d. Soil: Fertile volcanic soils on the hillsides; lateritic and
ferruginous soils at lower elevations; some areas suffer
erosion.
e. Vegetation: Mix of montane forest, modified montane forest/
agroforestry, grassland/cropland, and degraded gallery forests.
Fruit trees dominate lower lands, eucalyptus plantations
common at higher altitudes.
Human setting:
a. Population density highest in piedmont areas (150-300
persons/km²).
b. Agriculture and agroforestry are dominant economic activities.
c. Crop types include coffee (Arabica and Robusta), kola nut,
bananas, and various food crops.
d. Features mixed cropping with forested and agroforestry
systems.
e. The area has been impacted by socio-political factors
(e.g., anglophone crisis) affecting land use and population
distribution.
Methodology
Research design:
I. Cross-sectional mixed methods design combining exploratory
and survey approaches.
II. Research involved correlational design linking landcover
dynamics with carbon stock estimations.
III. Data sources: remote sensing satellite imagery and field
surveys.
Data collection and sampling:
I. Remote sensing data: Landsat and SPOT satellite images from
1992, 2013, and 2023 for landcover change detection.
II. Field inventory involved sampling trees in plots to estimate
above-ground biomass and carbon sequestration.
III. Sampling involved 30 arbitrary plots (20m x 20m) set within
the three dominant landcover types: Dense Montane Forest,
Modified Montane Forest/Agroforestry, and Grassland/
Cropland.
IV. Trees with diameter at breast height (DBH)≥10cm were
measured for species identification, DBH, and height.
Instruments used:
I. Garmin GPS for coordinates and mapping trees.
II. Measuring tapes and calipers for DBH.
III. Cameras with geotagging for photographic documentation.
IV. Data sheets for recording field data.
Data processing and analysis:
I. Remote sensing analysis done using ENVI, ArcGIS 10.8, QGIS,
and ERDAS software.
II. Supervised classification with Maximum Likelihood Algorithm
for landcover classification.
III. Change detection by post-classification comparison method to
analyze landcover changes over 31 years.
IV. 12 vegetation indices from satellite data computed for biomass
estimation.
V. Above-Ground Tree Biomass (AGTB) calculated using an
allometric equation adapted from Chave et al. [30]:
AGTB = 0.0509 X ρ X D2 X H
Where ρ = wood density (kg/m3), D= DBH (cm), H= height (m)
VI. Biomass converted to carbon stock by multiplying by carbon
fraction 0.47 (IPCC standard).
VII. Statistical analyses including diversity indices such as Shannon-
Weiner diversity index, species richness, and evenness were
calculated to analyze tree species diversity and abundance.
VIII. Regression analysis tested hypotheses about relationships
between species parameters (DBH, height, density) and
carbon stock.
IX. Carbon stock spatial mapping and predictive modeling were
done with InVEST carbon model and GIS software to project
future scenarios (e.g., 2050 landcover and carbon stock
predictions).
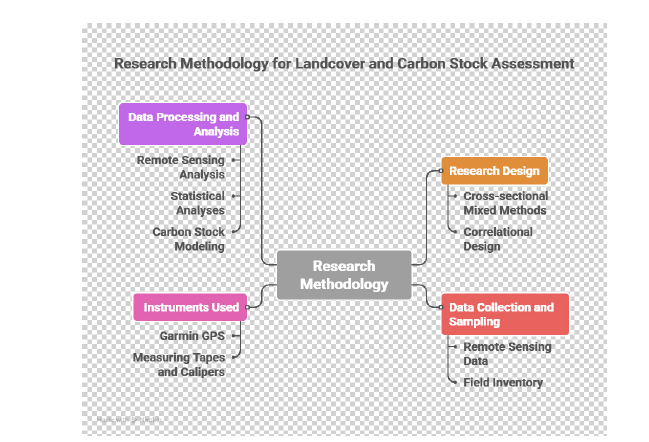
This methodology integrates field-based ecological sampling with satellite remote sensing and GIS analysis to comprehensively assess landcover change and carbon stock dynamics in the southern slope of Mount Bamboutos (Figure 2).
Figure 2:Research design and methodology for carbon stock estimation.
Result
This section details the quantification of carbon stock across the principal landcover types of the southern slope of Mount Bamboutos. Using extensive field measurements combined with biomass estimation equations [30], we explore how tree species abundance, richness, and diversity contribute to carbon storage. Carbon stock was quantified across three main landcover categories: Dense Montane Forest, Modified Montane Forest/Agroforestry, and Grassland/Cropland.
Carbon stock from tree species abundance and diversity
Tree species mapped and identified: A total of 1322 trees were geolocated across 30 plots distributed among the major landcovers:
a) Dense Montane Forest: 1304 trees
b) Modified Montane Forest/Agroforestry: 571 trees
c) Grassland/Cropland: 102 trees
Photographic documentation of the tree mapping process is shown in Plate 1 and the species identification process in Plate 2.
Plate 1:Field geolocation of tree positions. This photograph illustrates the detailed mapping of tree stems within a 20m×20m plot in the Dense Montane Forest. The GPS unit held by the technician demonstrates the use of high-accuracy spatial data collection, while the standardized plot layout using stakes and measuring tapes ensures rigorous and consistent sampling for biomass estimation.
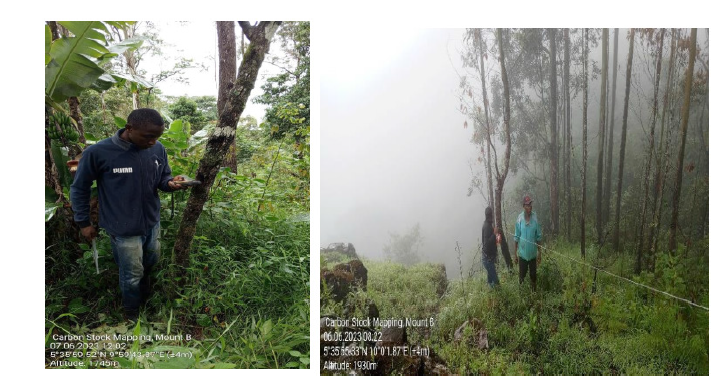
Plate 2:Botanical sampling for species identification. Here, a field botanist is shown collecting leaf and bark specimens for accurate species identification crucial for linking each geolocated stem to its taxonomic identity. This rigor in species identification underpins the precision of carbon stock estimates by species.
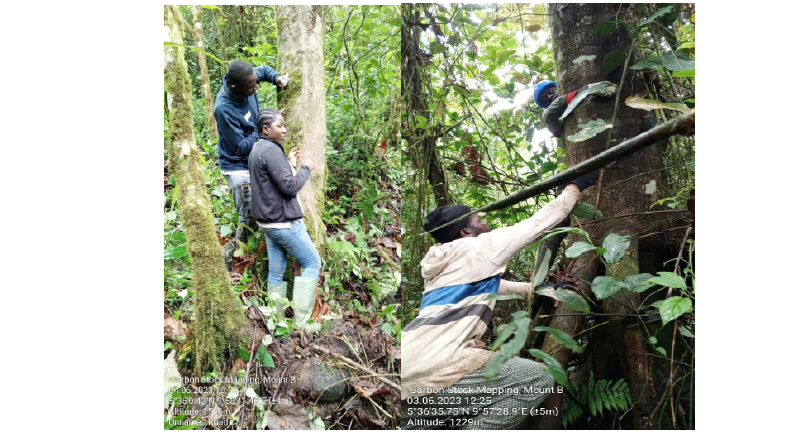
Figure 3 quantitatively compares the total mapped trees among landcover types. Dense Montane Forest dominates in tree abundance, followed by Modified Montane Forest/Agroforestry, with Grassland/Cropland contributing minimally.
Figure 3:Total geolocated trees by landcover type.
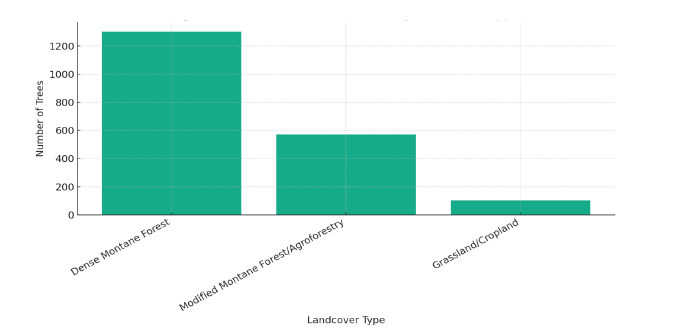
The figure shows a bar chart illustrating tree counts by landcover, highlighting Dense Montane Forest as the most treeabundant.
Table 1:Shannon diversity index calculation for dense montane forest.
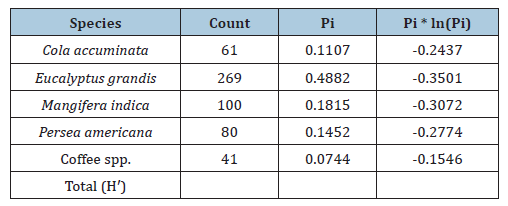
This table details species counts, proportions (Pi), and entropy values used to compute Shannon H′, reflecting biodiversity richness and evenness. For example, Musanga cecropioides is abundant with Pi=0.236, contributing heavily to the index.
Species richness and diversity: The Dense Montane Forest exhibited the highest species richness, with 95 identified tree species across plots. The calculated Shannon diversity index (H′=3.67) indicates very high biodiversity in this ecosystem (Table 1).
The high Shannon index affirms the montane forest’s complex species composition, which is critical for ecosystem resilience and carbon storage consistent with literature demonstrating the positive correlation between tree species richness and biomass [33].
Biomass and carbon stock in dense montane forest: Aboveground carbon stock estimated for the montane forest was 151.14kg of carbon per plot. Within the species sampled, Strombosia scheffleri was a notably high contributor to carbon stock, sequestering 12.72kg of carbon per tree, whereas species like Beilschmiedia sp. 2 contributed minimally (0.01kg) (Figure 4).
Figure 4:Carbon contribution per tree species in montane forest. The bar chart visualizes carbon stock per tree species, showing stark differences-Strombosia scheffleri dominating, nearly three orders of magnitude greater than the lowest contributor. This interspecific variation underscores the pivotal role of dominant species in forest carbon storage, a pattern supported by Dixon et al. [28].
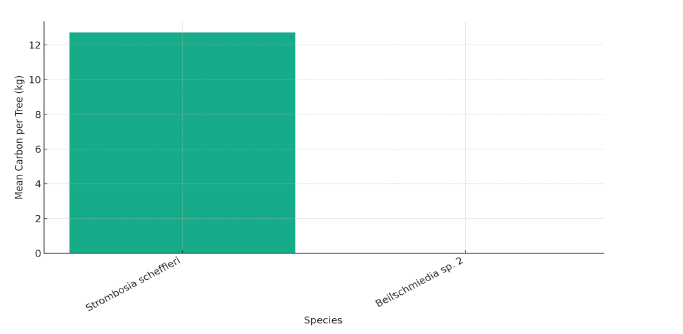
Table 2:Shannon diversity index calculation for modified montane forest/agroforestry.
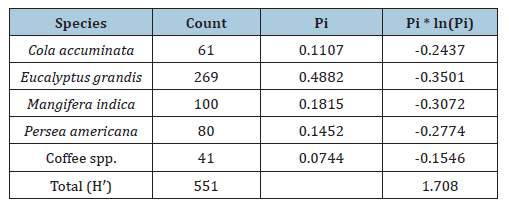
This table outlines species frequencies and entropy terms, showing Eucalyptus grandis as dominant 48.8% of trees and overall moderate diversity. Total aboveground carbon stock for this landcover was the highest among the three, estimated at 859.64kg (Figure 5).
Carbon stock in modified montane forest/agroforestry: Within the Modified Montane Forest/Agroforestry landcover, 551 trees belonging to 10 species were recorded. The Shannon diversity index here was moderate at H′ = 1.70 (Table 2&Figure 5).
Figure 5:Carbon stock per tree species within modified montane forest/agroforestry. Eucalyptus grandis and Persea americana lead as major carbon contributors, corroborating findings about Eucalyptus’ high sequestration capacity [42,43].
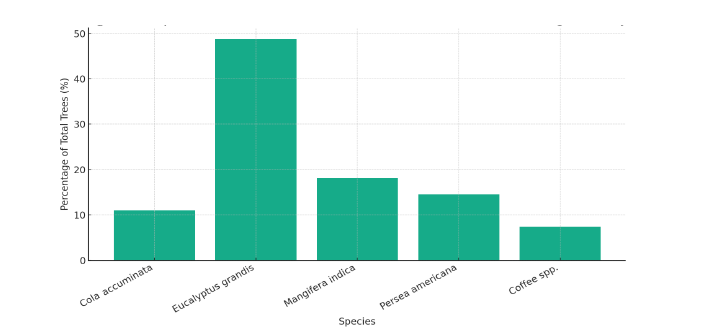
Table 3:Shannon Diversity Index Calculation for Grassland/Cropland.
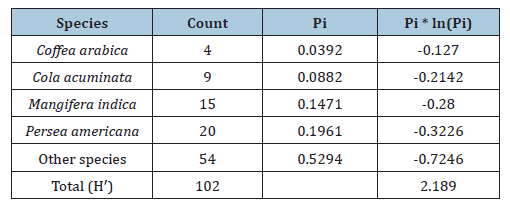
This table shows species counts and entropy, with ‘Other species’ collectively representing over half the diversity. The total carbon stock in this landscape was estimated at 79.06kg.
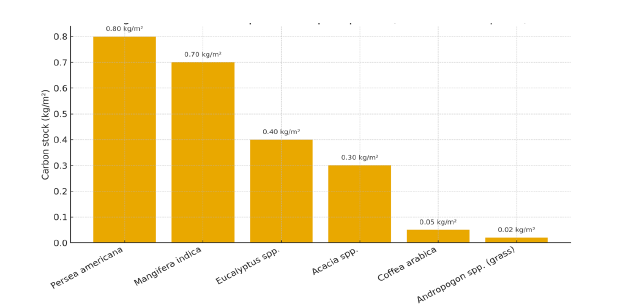
Carbon stock in grassland/cropland: In the Grassland/ Cropland landcover, tree abundance was scarce, with only 102 trees and 10 species identified. Despite fragmentation, the Shannon index was relatively high at H′=2.18, reflecting a moderately even species distribution (Table 3&Figure 6).
Figure 6:Carbon sequestration per species in grassland/cropland. Persea americana and Mangifera indica contributed disproportionately more to carbon stock despite lower abundance; meanwhile Coffea arabica contributed minimally this highlights how species identity influences carbon stocks even in low-biomass areas.
Statistical tests of hypotheses on carbon sequestration
Regression analysis revealed a strong positive relationship between tree structural attributes and carbon stock, as indicated by a high correlation coefficient (R=0.738, p<0.001). Figure 7 visualizes the agreement between predicted and observed values, while Table 4 summarizes the model fit and statistical significance. Together, these results demonstrate that approximately 54.5% of the variance in carbon stock can be explained by tree size and density, in line with previous findings.
Figure 7:Predicted vs Observed carbon stock scatter plot. The figure shows points clustered near the 1:1 line, indicating reliable predictive modeling with minor deviations.
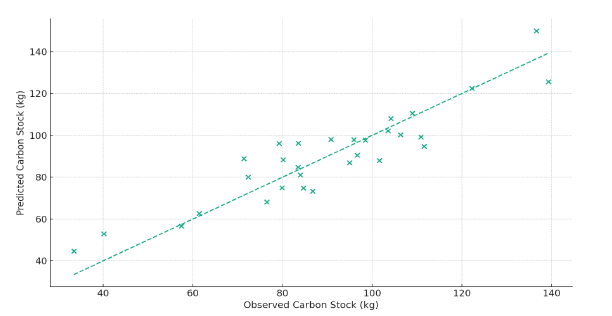
Table 4:Regression model summary and ANOVA.
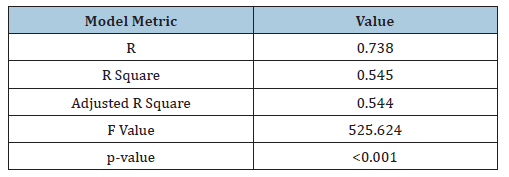
This model explains approximately 54.5% of variation in carbon stock, consistent with global evidence linking tree size and density with carbon storage [6].
Hypothesis 2: Significance of tree species characteristics on carbon sequestration: Regression analysis tested the relationship between tree structural attributes (diameter at breast height, density, height) and carbon stock.
Results showed a strong positive correlation:
A. R=0.738, indicating effective prediction of carbon stock from
tree parameters
B. p-value <0.001, confirming statistical significance
(Figure 7&Table 4 for model fit and statistical details.)
This model explains approximately 54.5% of variation in carbon stock, consistent with global evidence linking tree size and density with carbon storage [6].
Hypothesis 3: Relationship between landcover change and carbon stock: Carbon stocks vary significantly across landcover types, reflecting the impact of landcover dynamics on ecosystem carbon storage (Figure 8&9).
Figure 8:Mean carbon stock per landcover type. The bar chart illustrates the gradient of carbon storage: Modified Montane Forest/Agroforestry > Dense Montane Forest >Grassland/Cropland. Figure 9, which compares predicted and observed carbon stock values by landcover.
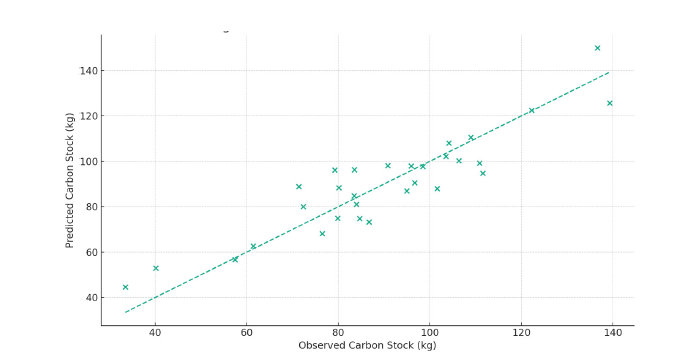
Figure 9:Model validation: Predicted vs Observed plot-level carbon stock across landcover types in Mount Bamboutos. Figure 9 compares predicted and observed carbon stock for three landcover types. Most data cluster near the 1:1 line, showing strong agreement for agroforestry plots, while dense forest and grassland/cropland group at lower values, highlighting landcover differences in model accuracy.
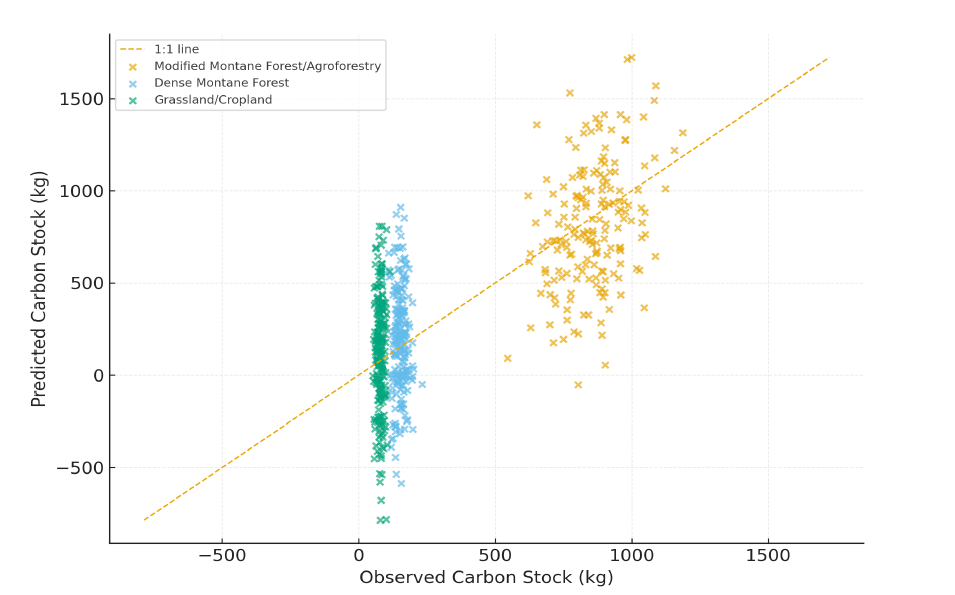
Table 5, below provides the corresponding quantitative values. Altogether, these visualizations confirm that shifts in landcover significantly impact ecosystem carbon sequestration. These results confirm the hypothesis that landcover change strongly influences carbon sequestration capacity [4,36].
Table 5:Mean aboveground carbon stock by landcover type.

Carbon stock modeling and mapping
Using combined remote sensing and field-collected data, three carbon stock maps were created to visualize current stocks, REDD+ scenarios, and future projections:
A. Current Aboveground Biomass Carbon Stock Map (2023)
Figure 10a
B. REDD+ Scenario Carbon Stock Map (2023) Figure 10b
C. Projected Carbon Stock Map for 2050 Figure 11
Figure 10a:Current aboveground biomass carbon stock map (2023). This map reveals spatial heterogeneity in carbon stocks: light areas correspond to high-biomass zones (intact montane forest and agroforestry areas), while darker zones correlate with grasslands and cropland mosaics, indicating lower carbon density. The map highlights priority areas for conservation.
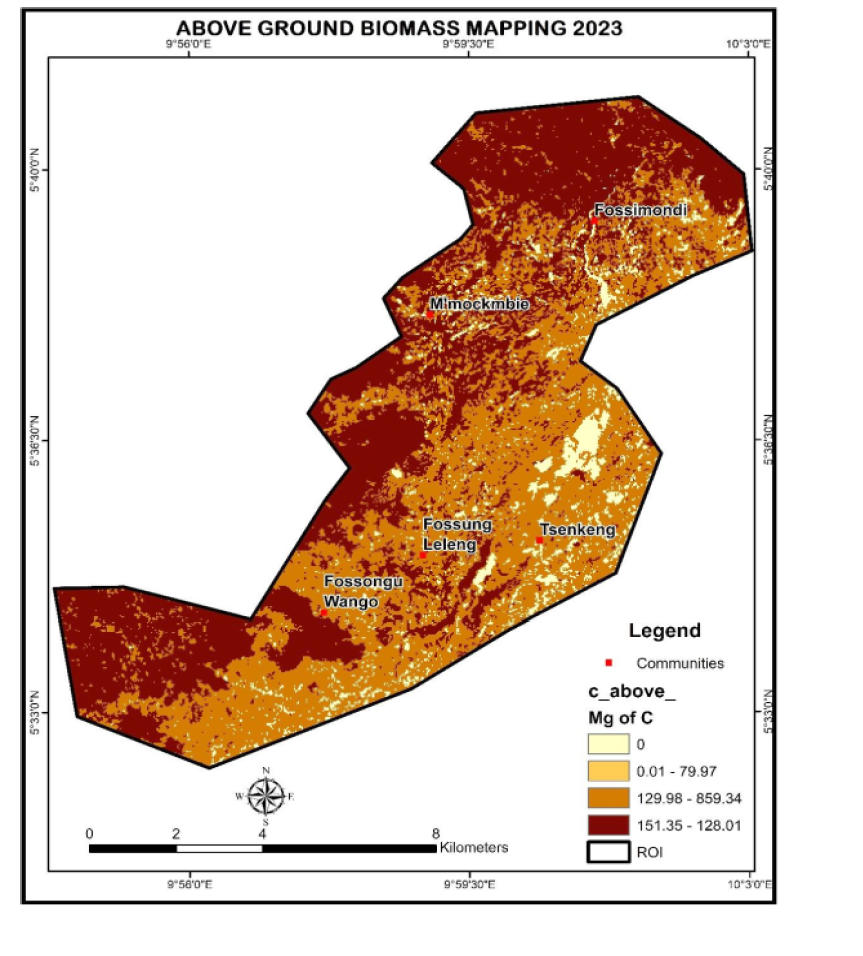
Figure 10b:REDD+ Scenario carbon stock map (2023). Under the REDD+ baseline, grassland/cropland dominates the landscape but shows lower carbon densities, while forest remnants appear as isolated high-carbon patches strategic targets for REDD+ investment to maximize impact.
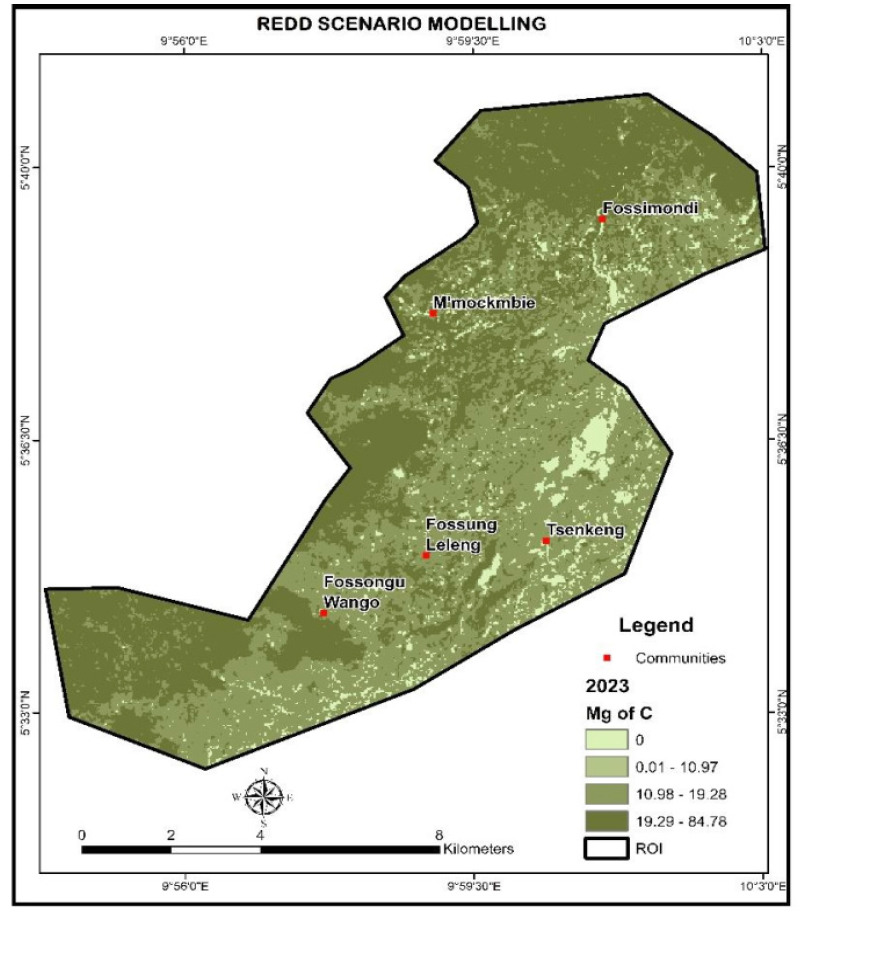
Figure 11:Projected carbon stock map (2050).
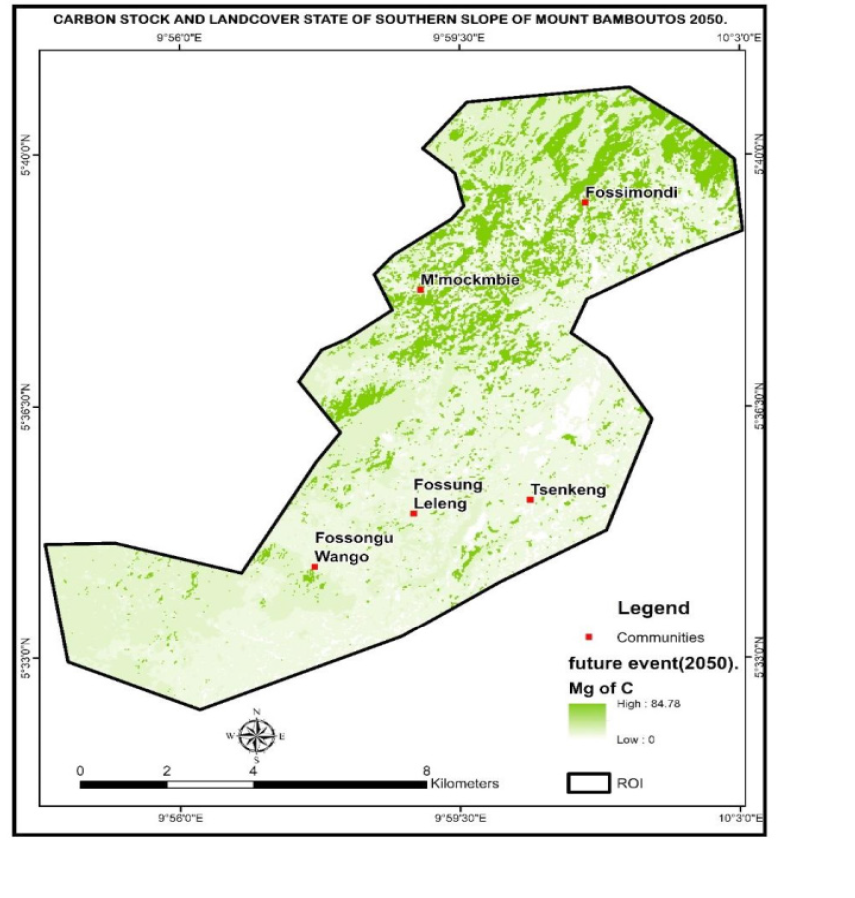
Current REDD status of the southern slope of mount bamboutos: Analysis confirms that although Modified Montane Forest/Agroforestry holds the highest carbon stock per area, the largest landcover remains grassland/cropland (56.50%), highlighting the challenge of balancing land use and carbon conservation.
Projected landcover and carbon stock to 2050:
a) Comparative carbon stock and tree diversity across landcover types: The southern slope of Mount Bamboutos demonstrates marked variation in both carbon stock and tree species diversity across its principal landcover types. The Table 6 below synthesizes key metrics for rapid comparison.
From this summary, the Dense Montane Forest, though occupying a lower proportion of land area, exhibits the greatest tree species richness and ecological diversity (H’=3.67), underscoring its importance as a reservoir for biodiversity. However, the Modified Montane Forest/Agroforestry, despite having less species diversity (H’=1.70), records the highest carbon stock per sampled unit, primarily owing to the dominance of fast-growing agroforestry species such as Eucalyptus grandis and Persea americana. Grassland/Cropland, which now comprises the majority of the landscape, maintains the lowest carbon stock and species abundance, reflective of considerable habitat simplification and modification for agriculture (Table 6).
Table 6:Comparative summary of landcover types by area, carbon stock, biomass, and tree diversity on the southern slope of Mount Bamboutos.

b) Landcover change projection and implications: This current status is projected to shift dramatically if present trends continue. The table below provides a scenario estimate for the year 2050, capturing the ongoing fragmentation and expansion of cropland at the expense of forested zones (Table 7).
Table 7:Predicted landcover area and percentage in the Southern slope of Mount Bamboutos (2050 Scenario).
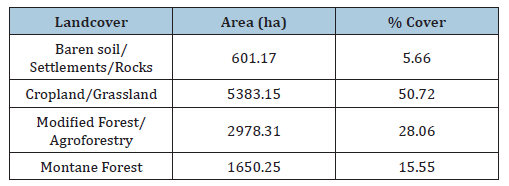
By 2050, cropland and grassland are anticipated to surpass 50% of the total land area, driving further reduction and fragmentation of the carbon-rich montane forest and agroforestry patches. This shift reflects sustained land-use pressure and foreshadows a contraction in both overall carbon sequestration capacity and biodiversity. The resulting losses in ecosystem services, such as climate regulation and habitat provision, highlight the precarious status of the landscape. These trends underscore an urgent need for robust ecological restoration and sustainable land management to safeguard the remaining carbon stocks and biodiversity. Without intervention, the region risks transitioning toward a homogenized, low-diversity agricultural landscape endangering both local livelihoods and broader climate mitigation goals [44].
Discussion
The following section presents an in-depth analysis of landcover dynamics observed in the study area and examines their direct implications on carbon stock distribution and ecosystem functioning across the southern slope of Mount Bamboutos.
Landcover dynamics and carbon stock patterns
The present study reveals substantial shifts in landcover composition across the southern slope of Mount Bamboutos over the past three decades. The dense montane forest decreased by approximately 23.62%, a trend echoing the widespread forest loss documented in many African montane areas due to the combined effects of population growth, expanding agriculture, and land management pressures [7,12]. Simultaneously, the landscape has seen a marked increase in cropland and grassland (now exceeding 50% projected by 2050), resulting in the fragmentation and contraction of high-biomass forest and agroforestry patches. This landcover conversion has profound implications for both carbon sequestration and biodiversity conservation [14]. The observed increase in Modified Montane Forest/Agroforestry area often at the expense of dense forest reflects a broader shift towards mixeduse landscapes. While agroforestry can enhance resilience and provide livelihood benefits, it does not fully compensate for the loss in biodiversity and the ecosystem services supported by intact montane forests [10,44]. Significantly, recent socio-political unrest has introduced complex dynamics, temporarily enabling some natural regrowth of montane forest in abandoned agricultural zones. Such regeneration demonstrates the sensitivity and adaptability of montane forest cover to shifting human pressures and landscape management [6].
Carbon stock differentials across landcovers
Quantitative assessments indicate that Modified Montane Forest/Agroforestry systems currently store the highest carbon per plot (859.64kg), despite their lower species richness (H’=1.7), compared to dense montane forests (151.14kg, H’=3.67) and grassland/cropland (79.06kg, H’=2.18). This finding supports a growing body of literature on the efficacy of agroforestry including species such as Eucalyptus grandis and Persea americana in delivering high aboveground carbon stocks through fast-growing, high-biomass species [42,43] (Mbow et al., 2020).
Conversely, dense montane forests although exhibiting the richest assemblage of species and highest diversity index do not match agroforestry systems in absolute carbon stock, likely due to a combination of species composition, disturbance regimes, and stand structure. This underscores that species identity, ecological succession stage, and biomass allocation play crucial roles in carbon storage, aligning with recent empirical findings [4,33]. The relatively low carbon stock in grassland/cropland is indicative of intense human modification, vegetation simplification, and reduced woody biomass. This conforms to the well-documented effect of agricultural expansion in reducing ecosystem carbon pools and fragmenting the remaining carbon-rich habitats [8].
Diversity, structure, and carbon sequestration
A strong and statistically significant relationship (R=0.738, p<0.001) was observed between key tree structural parameters (diameter at breast height, density, and height) and carbon stock. This affirms the central role of forest structure in ecosystem functioning and mitigation potential, reinforcing the importance of managing for both biomass accumulation and diversity to optimize carbon sequestration [6,33,45]. Notably, the dense montane forest, though less carbon-rich than agroforestry by area, harbors remarkable tree species richness (~105 species) and the highest Shannon diversity index (H’=3.67). Such diversity is vital for long-term ecosystem stability, productivity, and the maintenance of ecological processes including nutrient cycling, hydrological regulation, and resilience against disturbance [46,47].
Predictive mapping and restoration implications
Projections indicate that, without intervention, cropland/ grassland will continue expanding and by 2050 will comprise the majority of the study area. This will lead to further fragmentation of remaining high-carbon-stock zones and a loss of both carbon sequestration capacity and biodiversity. The predicted contraction of forest and agroforestry patches signals a looming ecological threshold, beyond which restoration becomes increasingly challenging and cost-inefficient [44]. The distribution of current carbon stock, reinforced by spatial mapping, highlights the essential role of landscape mosaics in climate mitigation policy. Restoring native forest patches and enhancing the sustainability of agroforestry systems emerge as key strategies for boosting carbon stocks and halting biodiversity decline [48,49].
Regional and policy relevance
The results of this study are directly relevant to regional carbon policy and sustainable landscape management. The underdevelopment of REDD+ (Reducing Emissions from Deforestation and forest Degradation) mechanisms in the area underscores a missed opportunity to leverage carbon finance for both conservation and livelihood enhancement [15,16]. By providing spatially explicit carbon stock baselines, this research can guide future REDD+ project design, support monitoring, reporting, and verification, and foster locally adapted restoration interventions.
The clear evidence of carbon loss due to LULCC, combined with demonstrated sequestration potential in both montane forest and agroforestry zones, calls for multifaceted land management policies that balance conservation, sustainable agriculture, and socioeconomic development [14] While this study integrates remote sensing and rigorous field inventories, some limitations persist, such as the exclusion of belowground carbon and soil carbon pools, and potential uncertainties in allometric equations. Future research should aim to (1) incorporate total ecosystem carbon accounting, (2) evaluate the socioeconomic factors driving land use choices, and (3) monitor the long-term effects of restoration and REDD+ interventions on both carbon stocks and community livelihoods [50-52].
Conclusion and Recommendations
The following subsection distills the principal findings of this study into key conclusions, synthesizing how landcover dynamics have influenced carbon stock patterns and ecological integrity on the southern slope of Mount Bamboutos. These conclusions provide a foundation for the subsequent recommendations aimed at guiding effective management and policy interventions.
Conclusion
This study demonstrates that the southern slope of Mount Bamboutos is experiencing substantial landcover transformation, with marked declines in dense montane forest and an expansion of cropland, grassland, and agroforestry systems over the past three decades. Dense montane forests, despite comprising the smallest area, retain the highest species diversity (with a Shannon index H′= 3.67) and are critical for biodiversity conservation. However, Modified Montane Forest/Agroforestry dominated by species such as Eucalyptus grandis and Persea Americana act as significant carbon sinks, possessing the highest aboveground carbon stock per unit area, despite relatively lower species diversity.
The drivers of landcover change include demographic pressure, agricultural expansion, and recent socio-political instability, which together have led to forest degradation, reduction in carbon stock, and increased landscape fragmentation. Predictive mapping indicates that if current trends persist, cropland and grassland will dominate by 2050, further diminishing the extent and integrity of high-biomass, high-biodiversity forest patches. Regression analysis confirmed a strong, positive correlation between tree structural parameters and carbon stock, highlighting the importance of both species identity and stand structure for carbon sequestration. The current absence of robust local REDD+ mechanisms and carbon policy frameworks has limited opportunities for integrating climate mitigation and community livelihood benefits. Without proactive intervention, ecosystem services, carbon storage, and biodiversity will continue to erode, undermining both local livelihoods and global climate goals.
Recommendations
Strengthen forest protection and restoration
A. Prioritize the preservation and restoration of dense montane
forest patches, given their irreplaceable biodiversity and
foundational ecosystem services.
B. Encourage active restoration of degraded lands and corridors
between forest fragments to enhance carbon sequestration
and landscape connectivity.
Promote sustainable agroforestry expansion:
A. Support the development of agroforestry systems that
maximize carbon stock without sacrificing species diversity,
using species with proven high-biomass potential.
B. Offer technical and financial assistance to farmers for
integrating native and high-value multipurpose species,
thereby aligning ecological and socio-economic benefits.
Integrate and scale REDD+Initiatives:
A. Develop locally tailored REDD+ (Reducing Emissions from
Deforestation and forest Degradation) projects, underpinned
by spatially explicit carbon stock baselines and robust
monitoring systems.
B. Foster community participation in REDD+ planning,
implementation, and benefit-sharing to ensure equitable
livelihood improvements and enhance project acceptance.
Advance land use planning and policy
A. Incorporate landcover and carbon stock mapping into district
and regional land-use planning to prevent uncontrolled
agricultural expansion and unsustainable settlement.
B. Strengthen legal and institutional frameworks to support
the enforcement of land use zoning and forest conservation
policies.
Enhance capacity and community awareness:
A. Build local capacity through targeted training in forest
measurement, carbon monitoring, and biodiversity
assessment, using participatory approaches where possible.
B. Increase awareness of the value of carbon ecosystem services,
biodiversity, and climate mitigation through educational
programs and community engagement.
Foster ongoing research and long-term monitoring:
A. Support longitudinal studies that capture temporal changes
in all carbon pools (including belowground) and their socioecological
drivers.
B. Encourage interdisciplinary collaboration to investigate the
effects of restoration, agroforestry, and policy interventions on
carbon storage and livelihood outcomes.
Mobilize carbon finance for conservation and development
A. Pursue opportunities for carbon credit trading and sustainable
finance to attract investment in conservation and restoration
projects.
B. Develop benefit-sharing mechanisms that transparently return
carbon revenues to local land stewards and communities.
In summary, tailored and integrated landscape management combining dense forest protection, sustainable agroforestry, REDD+ implementation, and enhanced community involvement offers the most promising pathway for maintaining carbon stocks, safeguarding biodiversity, and supporting resilient rural livelihoods on the southern slope of Mount Bamboutos. Immediate action is imperative to reverse current degradation trends and harness the region’s full potential as a climate change mitigation landscape.
References
- Ter-Mikaelian MT, Colombo SJ, Chen J (2021) Carbon stocks in managed forests of Canada. Natural Resources, Canada.
- Friedlingstein P, O’Sullivan M, Jones MW, Andrew RM, Gregor L, et al. (2022) Global carbon budget 2022. Earth System Science Data 14(11): 4811-4900.
- Moreau RE, Archer AL, Pakenham RHW (1987) The montane forests of Cameroon. Conservation of Cameroon Montane Forests, International Council for Bird Preservation, UK, pp: 1-20.
- Pan Y, Birdsey RA, Fang J, Houghton R, Kauppi PE, et al. (2011) A large and persistent carbon sink in the world’s forests. Science 333(6045): 988-993.
- Kong D, Zhang Y, Wang M, Gu X (2022) Effects of land use change on carbon sequestration in global terrestrial ecosystems. J Clean Prod 333: 130067.
- Houghton RA, Nassikas AA (2017) Global and regional fluxes of carbon from land use and land cover change 1850-2015. Glob Biogeochem Cycles 31(3): 456-472.
- Zhang M, Huang X, Chuai X, Yang H, Lai L, et al. (2015) Impact of land use type conversion on carbon storage in terrestrial ecosystems of China: A spatial-temporal perspective. Scientific Reports 5: 10233.
- Getaneh GG, Soromessa T, Bekele T, Teketay D (2022) Forest cover change and its drivers in the Ethiopian highlands: A systematic review.
- Igini M (2022) Deforestation in Africa: Causes, effects, and solutions. Earth Org.
- Tadoum M, Tchamba M, Nkwatoh AF (2015) Forest governance and REDD+ in Cameroon: Challenges and opportunities. International Journal of Environmental Protection and Policy (IJEPP) 3(5): 150-158.
- Tubiello FN, Salvatore M, Ferrara AF, House J, Federici S, et al. (2014) Agriculture, forestry and other land use emissions by sources and removals by sinks. FAO Statistics Division, pp: 1-89.
- Kindu M, Schneider T, Teketay D, Knoke T (2018) Changes of ecosystem service values in response to land use/land cover dynamics in Munessa-Shashemene landscape of the Ethiopian highlands. Sci Total Environ 547: 137-147.
- Toh FA, Angwafo TE, Ndam LM (2018) Application of GIS and remote sensing in the spatio-temporal analysis of forest cover changes in Mount Bamboutos Caldera, Cameroon. J Geosci Environ Prot 6(8): 1-17.
- Tsolocto A (2023) Landcover dynamics and carbon stock assessment on Mount Bamboutos. Proceedings of the Congo Basin Symposium on Security of Biodiversity, Climate and Natural Resources in Yaoundé, Yaounde, Cameroon.
- Corbera E, Schroeder H (2011) Governing and implementing REDD+Environ Sci Policy 14(2): 89-99.
- UN-REDD Programme (2019) Annual report 2ss019, UNREED Programme, Geneva, Switzerland.
- Turner BL, Skole D, Sanderson S, Fischer G, Fresco L, et al. (1995) Land-use and land-cover change: Science/research plan. International Geosphere-Biosphere Programme (IGBP), Stockholm, Sweden.
- Meyer WB (1995) Past and present land use and land cover in the USA. Consequences 1(1): 25-33.
- Jensen JR (1996) Introductory digital image processing: A remote sensing perspective. (2nd edn), Prentice-Hall Inc, USA, p. 318.
- Song C, Woodcock CE, Seto KC, Lenney MP, Macomber SA (2001) Classification and change detection using landsat TM data: When and how to correct atmospheric effects? Remote Sens Environ 75(2): 230-244.
- Butt A, Shabbir R, Ahmad SS, Aziz N (2015) Land use change mapping and analysis using remote sensing and GIS: A case study of simly watershed, Islamabad, Pakistan. Egypt J Remote Sens Space Sci 18(2): 251-259.
- Rawat JS, Kumar M (2015) Monitoring land use/cover change using remote sensing and GIS techniques: A case study of Hawalbagh block, district Almora, Uttarakhand, India. Egypt J Remote Sens Space Sci 18(1): 77-84.
- Tewabe D, Fentahun T (2020) Assessing land use and land cover change detection using remote sensing in the Lake Tana Basin, Northwest Ethiopia. Cogent Environ Sci 6(1): 1778998.
- Lu D, Mausel P, Brondízio E, Moran E (2004) Change detection techniques. Int J Remote Sens 25(12): 2365-2401.
- Food and Agriculture Organization (FAO) (2000) Land cover classification system: Classification concepts and user manual. FAO, Italy.
- Ahadnejad M (1999) Land cover mapping and change detection for sustainable land management.
- Watson RT, Noble IR, Bolin B, Ravindranath NH, Verardo DJ, et al. (2000) Land use, land-use change, and forestry, IPCC Special Report, Cambridge University Press, UK, pp: 1-30.
- Dixon RK, Brown S, Houghton RA, Solomon AM, Trexler MC, et al. (1994) Carbon pools and flux of global forest ecosystems. Science 263(5144): 185-190.
- Albrecht A, Kandji ST (2003) Carbon sequestration in tropical agroforestry systems. Agric Ecosyst Environ 99(1-3): 15-27.
- Chave J, Andalo C, Brown S, Cairns MA, Chambers JQ, et al. (2005) Tree allometry and improved estimation of carbon stocks and balance in tropical forests. Oecologia 145(1): 87-99.
- Gumindoga W (2010) Remote sensing and GIS for carbon estimation in tropical forests. Doctoral dissertation, University of Twente, Netherlands.
- Hooper DU, Chapin FS, Ewel JJ, Hector A, Inchausti P, et al. (2005) Effects of biodiversity on ecosystem functioning: A consensus of current knowledge. Ecol Monogr 75(1): 3-35.
- Pascal JP, Pelissier R Ayyappan N (2018) Biodiversity and carbon storage in tropical forests: Patterns and implications. Curr Sci 115(8): 1438-1444.
- Magurran AE (2004) Measuring biological diversity. Blackwell Publishing, New Jersey, USA.
- Brown S, Sathaye J, Cannell M Kauppi PE (1996) Management of forests for mitigation of greenhouse gas emissions. In: Watson RT, Zinyowera MC, Moss RH (Eds.), Climate change 1995: Impacts, adaptations and mitigation of climate change: Scientific-technical analyses. Cambridge University Press, UK, pp. 775-797.
- Malhi Y, Baldocchi DD, Jarvis PG (1999) The carbon balance of tropical, temperate and boreal forests. Plant Cell Environ 22(6): 715-740.
- Janisch JE, Harmon ME (2002) Successional changes in live and dead wood carbon stores: Implications for net ecosystem productivity. Tree Physiol 22(2-3): 77-89.
- Wasseige CD, Devers D, Marcken PD, Ebaa Atyi R, Nasi R, et al. (2009) The forests of the Congo Basin: State of the forest 2008. Publications Office of the European Union, Luxembourg.
- Ickowitz A (2006) Shifting cultivation and deforestation in tropical Africa: Critical reflections. Dev Change 37(3): 599-626.
- Martin TC, Tchamba M, Nkwatoh AF (2015) Forest governance and REDD+ in Cameroon: Challenges and opportunities. Int J Environ Prot Policy 3(5): 150-158.
- Food and Agriculture Organization (FAO) (2011) State of the world’s forests. Food and Agriculture Organization of the United Nations, Rome.
- Crow TR, Buckley DS, Nauertz EA, Zasada JC (2002) Effects of management on the composition and structure of northern hardwood forests in Upper Michigan. For Sci 48(1): 129-145.
- Zubair OA, Oladipo FO, Adekunle VA J (2022) Carbon sequestration potential of eucalyptus grandis plantations in Nigeria. J Sustain For 41(2): 123-137.
- Mbow C, Rosenzweig C, Barioni LG, Benton TG, Herrero M, et al. (2017) Food security. Climate Change and Land: IPCC Special Report on Climate Change, Desertification, Land Degradation, Sustainable Land Management, Food Security, and Greenhouse Gas Fluxes in Terrestrial Ecosystems, Intergovernmental Panel on Climate Change (IPCC), Geneva, Switzerland.
- Reich PB, Hobbie SE, Sendall KM (2023) Forest carbon dynamics under global change. Annu Rev Ecol Evol Syst, p. 54.
- Hooper DU, Adair EC, Cardinale BJ, Byrnes JE, Hungate BA, et al. (2012) A global synthesis reveals biodiversity loss as a major driver of ecosystem change. Nature 486(7401): 105-108.
- Wilsey BJ, Potvin C (2000) Biodiversity and ecosystem functioning: Importance of species evenness in an old field. Ecology 81(4): 887-892.
- Lal R, Smith P, Jungkunst HF, Mitsch WJ, Lehmann J, et al. (2015) The carbon sequestration potential of terrestrial ecosystems. Journal of Soil and Water Conservation 70(6): 134A-140A.
- Griscom BW, Adams J, Ellis PW, Houghton RA, Lomax G, et al. (2017) Natural climate solutions. Proc Natl Acad Sci USA 114(44): 11645-11650.
- Brown S, Gillespie AJR, Lugo AE (1989) Biomass estimation methods for tropical forests with applications to forest inventory data. For Sci 35(4): 881-902.
- Mbow C, Smith P, Skole D, Duguma L, Bustamante M (2014) Achieving mitigation and adaptation to climate change through sustainable agroforestry practices in Africa. Curr Opin Environ Sustain 6: 8-14.
- Mbow C, Van NM, Luedeling E, Neufeldt H, Minang PA, et al. (2014) Agroforestry solutions to address food security and climate change challenges in Africa. Curr Opin Environ Sustain 6: 61-67.
© 2025 © Abel Tsolocto. This is an open access article distributed under the terms of the Creative Commons Attribution License , which permits unrestricted use, distribution, and build upon your work non-commercially.
 a Creative Commons Attribution 4.0 International License. Based on a work at www.crimsonpublishers.com.
Best viewed in


.jpg)


 Editorial Board Registrations
 Submit your Article
 Refer a Friend
 Advertise With Us
.jpg)


.jpg)


.bmp)
.jpg)
.png)
.jpg)


.jpg)


.png)

.png)


.png)


