
- About Us
- Information
-

The Author ensures that the research has been conducted responsibly and ethically with adherence to all relevant regulations. read more..
- For Authors
- For Reviewer
- Manuscript Guidelines
- Membership
- Publication Ethics
-
- Journals
- Reprints
- e-Books
- Videos
- Policies
- Contact Us
 COVID-19
- Submissions


Full Text
Environmental Analysis & Ecology Studies
Water Quality and Sediment Index in the Downstream Section of Palembang’s Musi River, South Sumatera
Agus Tjahjono1*, Rudy Sugiharto2 and Okvita Wahyuni3
1Engineering Department, Indonesia
2Nautical Studies Department, Indonesia
3Port and Transportation Management, Indonesia
*Corresponding author: Agus Tjahjono, Engineering Department, Inland Water and Ferries Transport, Palembang, South Sumatera, Indonesia
Submission: June 14, 2021; Published: February 21, 2022

ISSN 2578-0336 Volume9 Issue4
Abstract
Musi River, with its eight tributaries, is the largest river in Palembang. However, as time passes by, pollution has become one of its biggest problems. The pollution was generally caused by domestic and industrial activities. This research was aimed: (1) to analyze the content of Pb and Cd in water and sediment; (2) to examine the content of Coliform bacteria in water; (3) to identify the physical and chemical parameters of water; (4) to determine the enrichment factor and accumulation index of Pb and Cd metals in sediment, and (5) to determine the river’s water quality based on Pollution Index (IP) and STORET. Based on the research, it was found that the average content of Pb and Cd at the six stations had exceeded the quality standards reaching 0.03 and 0. 01mg.l-1. The average concentrations of Pb and Cd in sediment were 4.49 and 0.15mg.kg-1 which still met the quality standards of ANZECC/ ARMCANZ and CCME. Based on the Enrichment Factor (EF) and the accumulation index (Igeo) of Pb and Cd, it was found that the river had not been contaminated and was low in contamination. The coliform content in water reached 1,600 MPN.100ml-1 indicating that it was not suitable to use as a source of conventional drinking water treatment. The pollution index showed that all stations had been heavily polluted.
Keywords: Musi river; Pb and Cd in water and sediment; Physical and chemical parameters; Coliform; EF and Igeo
Introduction
Musi River is the largest river in Palembang, South Sumatera. It has eight major tributaries: Komering, Ogan Penukal, Batanghari Leko, Lematang, Rawas, Lakit, and Kelingi Utomo et al [1]. Musi River has been playing an important role as water transportation, a source of livelihood for fishermen, a water source of drinking and bathing, agriculture, and industry Emilia et al [2] One of the drinking water sources is Ogan river, whose water is still assumed to be safe for drinking purpose Rosyidah [3]. The pollution found in Musi River was caused by two factors: domestic and industrial activities. Domestic activity was said to affect more than the industries. This condition could be seen from the organic decomposition caused by household waste which was dominated by iron ranging from 288 to 453mg/liter Setianto & Fahritsani [4]. In the downstream, in Gandus sub-district, it was found that 86% of the environment was in poor conditions where people were not aware that the river’s cleanliness impacted on the environment and their own health as they had been using the river as a garbage dumps and public toilets Putri et al [5] People’s habits such as using the river as a garbage dump, and unavailability of Wastewater Treatment Plant facilities around Sekanak river, a tributary of Musi river, also contributed to the decline in Musi River’s water quality Kospa & Rahmadi [6].
Heavy metals as one of pollution sources resulted from the industrial and agricultural activities, mining, and household waste could affect the aquatic organisms Rochyatun et al [7] The organisms include crustaceans such as crabs, shellfish, and shrimp. At the mouth of Banyuasin river, iron content in crabs reached 2.054ppm due to the high concentration of metals in sediment Sandro et al [8] Pb metal pollution was produced by lead additives in gasoline used for transportation and agricultural fuels while Cd metal pollution was produced by the industrial waste of metals, plastics, paints, fertilizers, and oil Azhar et al [9].
Previous research has found that the concentration of heavy metal Pb in water ranged from 0.001 to 0.005mg.l-1 while its content in the sediments in the downstream of Musi river ranged from 1.9 to 11mg.kg-1 which were still remain within the safe limits Putri et al [10]. However, the average of Pb concentration found in the muscle of Seluang fish (Rasbora sp.) was 157.5μg.kg-1 while in mullet fish (Mugil chepalus), it was 201.5μg.kg-1. Thus, the metal content was still within the safe limits for consumption purpose Putri et al [11] The presence of this heavy metal had affected Selar fish (Alepes vari) and Gulamo fish (Johnius belangerii) found in the river’s estuaries. It was found that the concentration of Pb was higher in Gulamo fish than the finding in Selar fish. The heavy metal affected the fish’s organs and had exceeded the safe limits for consumption purpose Agustriani et al [5].
The presence of Coliform bacteria indicated that pathogens had contaminated the environment. In the downstream section, starting from Ogan river estuary to Kemaro Island, Coliform bacteria ranged from 5,000-13,000 CFU.100ml-1. It means that the land use would affect the abundance of these bacteria as the domestic waste was disposed into the river Genisa & Auliandari [12]. This research was aimed: (1) to analyze the content of Pb and Cd in water and sediment; (2) to examine the content of Coliform bacteria in water; (3) to identify the physical and chemical parameters of water; (4) to determine the enrichment factor and accumulation index of Pb and Cd metals in sediments, and (5) to determine the river’s water quality based on Pollution Index (IP) and STORET.
Materials and Methods
Description of the study area
The research was conducted on July 23rd, 2019 in the morning during high tide starting from the upstream section around Ampera bridge to the downstream. The waters was mixed single dominant tides; there were two high and two low tides within 24 hours. The lowest tide reached 1.2m and the highest was 3.25m. During the high tide, the flow rate ranged from 0.023 to 0.256m.sec-1 Sari et al [13].
In this research, random sampling was applied at six observation points: (1) the first point, at Ampera bridge (020 59’25” S, 1040 45’55” E); (2) the second point located at Boom Baru port (020 58’ 55” S, 1040 46’ 44” E); the third point, at PT Pupuk Sriwijaya (Pusri), a fertilizer factory (020 59’ 05” S, 1040 47’ 46” E); (4) the fourth point, in Pertamina’s refinery jetty (02059’ 21” S, 1040 50’ 03” E); (5) the fifth point, in a the shipyard owned by Mariana Bahagia Company (020 58’ 02” S, 1040 52’ 12” E); and (6) the sixth point, in the shrimp processing area and PT SAP palm oil mill (020 57’ 30” S, 1040 52’ 44” E) (Figure 1).
Figure 1: Research site.

Research parameters
The samples were then analyzed in terms of temperature, TDS, salinity, TSS, nitrite, nitrate, pH, phosphate, BOD, DO, Pb, Cd, MPN Coliform.100ml-1. The in-situ data included temperature, salinity, and pH whereas the ex-situ data consisted of the primary data obtained from laboratory results including TDS, TSS, Nitrite, Nitrate, Phosphate, BOD, DO, Pb, Cd and MPN Coliform.100ml-1. An in-situ measurements were also conducted in order to analyze the level of turbidity, flow rate, and river depth. Moreover, samples of sediment were also obtained to analyze the content of Pb and Cd metal.
Determination of heavy metals (Pb, Cd) in water
In this research, 18 samples were obtained. Each sample was put into a 100ml erlenmeyer flask. Five ml of concentrated HNO3 was then added. Next, it was covered with a watch glass and heated at 105-120 °C so that the rest volume became 15-20ml. After the test sample became clear, it was put into a 50ml volumetric flask and filtered on 42μm Whatman paper. Some free-mineral water was then added and tested using AAS (Atomic Absorption Spectrophotometer) (Ginting et al [14], SNI (Indonesian National Standard) 6989.16-2009, SNI 6989.8-2009)
Determination of heavy metal (Pb, Cd) in sediment
In order to determine the level of Pb and Cd, 18 samples were collected. 50 grams of each sample was taken and then dried in an oven at 150 °C for 24hours. 5gram of sample was added with 10ml of HNO3. The sample was then heated using a waterbath at 150 °C for 30 minutes, filtered on 0.45μm Whatman paper, stored in a sample bottle which had been filled with 15ml of distilled water. The content of Pb and Cd in sediment were analyzed using AAS Ginting et al [14] & Husainy et al [15].
Determination of the content of Coliform bacteria in river water
In this research, 18 samples were taken from the river. The water sample was put into sterilized bottles and given a flame at the bottle mouth. The bottles were then closed and put into an ice box. Next, the sample bottles were taken to the laboratory. There were four stages in examining Coliform bacteria (Adrianto 2018, SNI 06-4158-1996).
Preliminary test
In order to perform the preliminary test, 9ml of LB (Lactose Broth) was put into test tubes with a durham tube inside. The tubes were then autoclaved at 121 °C for 15 minutes. The sample was diluted by adding 9ml of sterile distilled water as a 10-1 dilution occurred. The dilution was obtained from 0.1ml, 0.01ml, 0.001ml and was then put into three tubes of LB. The tubes were stored in an incubator at 37 °C for 24-48 hours. Coliform bacteria was identified by the presence of gas, acid, or discoloration.
Confirmation test
The 1-2 positive suspensions were inoculated into tubes containing BGLBB (Brilliant Green Lactose Bile Broth). The tubes were incubated at 37 °C in 24-48 hours. If some gas, acid, or color changes were formed, so it means that Coliform bacteria existed. Last, MPN was performed.
Complementary test
The media which were positive in the confirmation test were then inoculated. One inoculation loop of the sample was added into Eosin Methylene Blue (EMB) agar and then incubated at 37 °C. If metallic blackish green colony grown after 3-4 days of incubation, a biochemical test and gram stain were then performed.
Determination of water quality using pollution index method
In this research, pollution Index method was used to determine the relative level of pollution toward the water quality parameters using this following formula (Minister of Environment Decree No. 115/2003, Nemerow & Sumitomo [16].
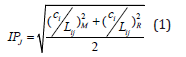
where IPJ = pollution index of j, Ci = concentration of water quality parameters i, Lij = quality parameters listed in the quality standard of water j, M = maximum, R = mean. There are four categories of the result: (a) 0 ≤ IP ≤1.0 means that the water meets the quality standard, (b) 1.0 ≤ IP ≤5.0 means that the water is lightly polluted, (c) 5.0 ≤ IP ≤10 means that the water is moderately polluted, and (d) IP ≥10 means that the water is heavily polluted.
The determination of water quality using STORET
STORET method utilized parameters which met or exceeded the quality standard. Determination of water quality status used a value system of US EPA (United States Environmental Protection Agency) which consisted of four classes: (a) Class A, score 0, is considered as very good that it meets the quality standards; (b) Class B, score between -1 and -10, is considered as mildly polluted; (c) Class C, score between -11 and -30, is classified as moderately polluted; and (d) Class D, score ≥ -31, is considered as heavily polluted Arnop et al.
Determination of heavy metals for water
In this research, the determination of heavy metal quality was based on four standards. The first was the standards of seawater quality for marine biota (Minister of Environment Decree No. 51/2004). The second was Government Regulation No. 82/2001 on Water Quality Management and Water Pollution Control in the third part of Article 8 which says that there are four water quality classes, grade one to grade four. This study uses two classes of water quality standards: (1) Class II: water used for water recreational infrastructure/ facilities, freshwater fish farm, animal husbandry, and crops irrigation and (2) Class III: water used for freshwater aquaculture, livestock, and crops irrigation. Third, ANZECC/ ARCANZ (2000) from Australia and New Zealand was used. Last, this research also apply CCME (Canadian Council of Miniters of Environment, 1999) from Canada.
Determination of coliform bacteria density
The coliform bacterial density was calculated using the formula as follows (Adrianto [17], SNI 06-4158-1996).
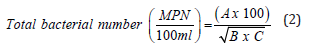
where A = number of positive tubes, B = volume of test objects in negative tubes (ml), C = volume of test objects in all tubes (ml)
The enrichment level of Pb and Cd metals in sediment
The enrichment factor was employed to determine the level of heavy metal contamination of Pb and Cd in sediment. The level of enrichment (EF = Enrichment Factor) was calculated using the following formula Ginting et al [14]; Sakan et al [18].
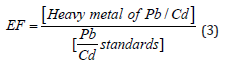
where EF = Enrichment Factor, standard of Pb = 12.5mg.kg- 1, standard of Cd = 0.2mg.kg-1. EF value < 1 means that it is not contaminated, EF value 1-3 means that the contamination is low, value 3-5 means that the contamination is moderate, 5-10 means severe contamination, and 25-50 means that severe enrichment occurs.
Accumulation index
The accumulation index was aimed to determine the value of the presence and intensity of anthropogenic metal contaminants in sediments. The formula used is as follows Barbieri [19].
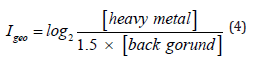
where Igeo = geoaccumulation index, log2=0.301, 1.5=constant value, background=metal standard value. The accumulation index is divided into seven classes: (1) Igeo<0 meaning there is no contamination, (2) 0 ≤ Igeo≤1 meaning there is no contamination/ low contamination, (3) 1≤Igeo≤2 meaning that moderate contamination occurs, (4) 2≤Igeo≤ 3 meaning that there is moderate/heavy contamination, (5) 3≤Igeo≤4 meaning that it was heavily contaminated, (6) 4≤Igeo≤5 meaning that there is heavy/ extraordinary contamination, and (6) Igeo≥5 indicating highly contaminated sediment Forstner & Muller [20].
Results and Discussion
During the research, the water temperature was not in an optimal condition for biota ranging from 32 to 38.67 °C; the optimal temperature was 28-32 °C Miranda et al [21] Other physical parameter, TDS values ranged from 38.9-41.57mg.l-1 which means that it still met the water quality standards of Class II and III, below 1000mg.l-1. Meanwhile, TSS value was also still below the quality standard, below 50 and 400mg. l-1. The chemical parameters of this research included nitrite, nitrate, Ph, phosphate, BOD and DO content. Based on the analysis, nitrite content had exceeded the quality standard reaching 0.06mg.l-1. Besides, the average level of nitrate content was at the quality standard reaching 10mg.l-1. The average level of Phosphate content was below the quality standard (0.2mg.l-1). However, BOD and DO content had exceeded the quality standard reaching 3 and 4mg/liter (Government Regulation No. 82/2001) (Table 1).
Table 1: Physical and chemical quality conditions of the downstream of Musi river waters.

The average concentration of Pb found at the six stations was 3.0933m.l-1, ranging from 2.82 to 3.92mg.l-1. The highest value was found at Boom Baru port while the lowest was at Pertamina and Pusri ports. Pb content at all stations had exceeded the quality standard 0.03mg.l-1 (Government Regulation No. 82/2001). It indicates that river water could no longer be used as a source for drinking water treatment (threshold≤0.1mgl-1) (Figure 2). Based on the seawater quality standards for biota (Minister of Environment Decree No.51/2004), Pb content of 0.008mg.l-1 was regarded as unsafe for biota. Pb concentration found in Musi river was higher than what was found in Tenggang river, Semarang, which ranged from 0.0755 to 0.1425mg. l-1 Agustina et al [22]. The average of Pb content was higher compared to the previous studies, which ranged from 0.002-0.004mg.l-1 and 16.977-61.479mg.kg-1 in dissolved and suspended conditions Putri & Purwiyanto [23]. The presence of Pb in water could affect aquatic organisms such as Cendro fish in the coastal waters of Krueng Raya Aceh Besar Fadillah et al [24].
Figure 2: Average content of pb in water.

Based on the analysis, it was found that average Cadmium concentration in all stations was constant at 1.88mg.l-1 which means that they had exceeded the quality standard (0.01mg.l-1) (Government Regulation No. 82/2001) (Figure 3). The content of Pb and Cd had affected the snakehead fish which were sold in KM 5 Palembang market. It was found that Pb and Cd content in fresh fish still met the quality standards. On the other hand, the content in processed fish had exceeded the quality standard 0.3mg.kg-1 [25].
Figure 3: The average of Cd content in water.

The concentration of Pb in the sediment ranged between 2.48 and 5.28mg.kg-1, whose average reached 4.49mg.kg-1. The highest concentration was found at Boom Baru port while the lowest was found in Ampera Bridge. On the ther hand, Cd content in the sediment was between 0.18 and 0.41mg.kg-1 with average of 0.31mg.kg-1. The highest finding was found at Boom Baru port while the lowest was in Pusri fertilizer factory (Figure 4). The Pb content had increased, between 3.89 and 10.14mg.kg-1, which was found at Upang estuary Sari et al [13]. It was also found that the quality standards of Pb in sediment were 50 and 30.2mg.kg-1. Thus, the content of Pb in sediment was still below the threshold meaning that it was still safe for biota [(ANZECC (Australian and New Zealand and Concervation Council and Agriculture) 2013, CCME (Canadian Council of Minister of the Environment) 1999). Compared to previous studies conducted in the same area, this research showed that the average value of Cd content in sediment was lower reaching 0.15 mg.kg-1 Emilia et al [2].
Figure 4: Pb and Cd content in sediment.

The enrichment factor for Pb in sediments ranged from 0.2-0.4 and the average reached 0.36. The highest enrichment factor was found in Pertamina jetty while the lowest finding was at Ampera Bridge. It means that the vessel’s activities at Pertamina jetty had caused a high solubility in sediment. The enrichment factors of Pb at all stations did not indicate any contamination. The enrichment factors or Cd ranged from 0.9 to 2.05 with an average of 1.55; the highest value was found at Ampera bridge and Boom Baru port while the smallest was at PT Pusri fertilizer factory. Compared to the fertilizer factory whose access was limited only to certain vessels, domestic discharge activities around KM 16 market and jetty had affected the sediment. The analysis also found that the enrichment factors of Cd in the fertilizer factory area was regarded as as not contaminated while the findings at other stations were regarded as lowly contaminated. The average value of Cd enrichment factors was found higher than Pb’s. It indicates that oil waste from both domestic and aquatic activities were dominant (Figure 5).
Figure 5: Enrichment factors of Pb and Cd in sediment.

The accumulation index (Igeo) for Pb in sediment ranged from 0.04 to 0.08, with an average value of 0.07. The highest value was found at Boom Baru port. The values at all stations indicated a low contamination. The Cd accumulation index ranged from 0.18 to 0.41 and the average value reached 0.31. The highest value was found at Ampera bridge and Boom Baru port. Igeo for Cd at all stations also indicated a low contamination (Figure 6).
Figure 6: Igeo for Pb and Cd in sediment.

The concentration of total Coliform at all stations was 1,600 MPN.100ml-1. It was still below the water quality standard for class II and class III, which were 5,000 and 10,000 MPN.100ml-1. However, according to Minister of Health Decree No. 492/MENKES/PER/ IV/2010 which says that the total Coliform concentration should be 0 MPN.100ml-1, the river water was not suitable for drinking purpose (Figure 7). The high concentration of Coliform found in this research was in accordance with the previous research’s finding which showed that the Coliform content in Seberang Ulu I reached 2,400 colonies per 100ml of water Windusari & Sari [26].
Figure 7: The total coliform content.

The pollution index value based on STORET using the water quality standard’s class II and class III, with parameters of TDS, TSS, nitrate, nitrite, pH, phosphate, BOD, DO, Pb, Cd and Total Coliform whose values were 1000, 50-400, 10-20, 0.06, 6-9, 0.2-1, 3-6, 4-3, 0.03, 0.01mgl-1 and 5000-10000 MPN.100ml-1. The highest pollution index was found at PT Pusri, the fertilizer factory. The pollution index at all stations was regarded as heavily polluted, exceeding -31 value (Table 2).
Table 2: The parameters values of STORET’s pollution index at the stations.

The pollution index at all stations indicated a heavy pollution which exceeded 10. The highest value was found at Boom Baru port which was highly influenced by the transportation activity. Some factors which influenced contamination included the parameters of BOD, DO, Pb, Cd, and nitrite. The average concentrations of Pb and Cd in the river reached 3.92 and 1.88mg.l-1, indicating that fuel spill caused pollution (Table 3).
Table 3: Pollution index test results.

Conclusion
The average content of Pb and Cd at the six stations were 3.09 and 1.88mg.l-1; these values had exceeded the quality standards of 0.03 and 0.01mg.l-1. The average concentrations of Pb and Cd in sediment were 4.49mg.l-1 and 0.15mg.kg-1. These concentrations still met the quality standards of ANZECC/ARMCANZ and CCME. Pb content in sediment was found higher than Cd content. The enrichment factors for Pb and Cd were 0.36 and 1.55 indicating that they had not been contaminated. The average accumulation index for Pb and Cd metals were 0.07 and 0.31. These values indicated that there was low contamination. The Coliform content was 1600 MPN.100ml-1, which was still below the water quality standard but was not suitable as a source of conventional drinking water treatment. The pollution index showed that all stations were heavily polluted [27,28].
Acknowledgement
The researchers would like to thank Santoso from the vessel, Bima Riansyah and Teguh for the assistance in sample collection, Vian and Febri from the Faculty of Fisheries and Marine Sciences of Semarang Diponegoro University, and Industrial Research and Standardization Center of Palembang. A deepest gratitude also goes to Inland Water and Ferries Transport, Polytechnic of Palembang for the fund provided for this research.
References
- Utomo AD, Muflikhah N, Nurdawati S, Rahardjo MF, Makmur S (2007) Ichtiofauna, Musi river, South Sumate Balai Riset Perikanan Perairan Umum.
- Emilia I, Suheryanto, Hanafiah Z (2013) Distribution of cadmium in water and sediment in Musi river, Palembang. Jurnal Penelitian Sains 16(2): 59-64.
- Rosyidah M (2017) Analysis of water quality in Ogan River as Palembang’s water source. Jurnal Redoks 2(1): 48-52.
- Setianto H, Fahritsani H (2019) The dominant factor affecting the pollution of Musi River in Palembang. Media Komunitas Geografi 20(2): 186-198.
- Agustriani F, Purwiyanto AIS, Putri WAE, Fauziyah F (2019) Concentration of heavy metal (Pb and Cu) in Alepes vari and Johnius belangerii from Musi river estuary, Banyuasin District, South Sumatra. Journal of Suboptimal Lands 8(2): 213-219.
- Kospa HSD, Rahmadi (2019) The influence of community behavior on water quality in the Sekanak River, Palembang City. Jurnal Ilmu Lingkungan 17(2): 212-221.
- Rochyatun E, Kaisupy MT, Rozak A (2006) Heavy metal distribution in water and sediment in the estuary waters of Cisadane River. Makara Sains 10(1): 35-40.
- Sandro SR, Lestari S, Purwiyanto AIS (2013) Analysis content levels of heavy metals in the crab meat (Scylla serrata) in the territorial waters of Banyuasin’s estuaries. Fishtech 2(1): 46-52.
- Azhar H, Widowati I, Suprijanto (2012) Study of Heavy Metal Content of Pb, Cu, Cd, Cr in Simping shellfish (Amusium pleuronectes), water, and sediment in the waters of wedung, demak and analysis of maximum tolerable intake in humans. Journal of Marine Research 1(2): 35-44.
- Putri MK, Septinar H, Daulay RW (2019) The influence of environmental management on the condition of the community living at downstream of Musi river. Jurnal Geografi 16(2): 80-89.
- Putri WAE, Purwiyanto AIS (2016) Cu and Pb concentration in water column and plankton of downstream section of the Musi river. Jurnal Ilmu dan Teknologi Kelautan Tropis 8(2): 773-780.
- Genisa MU, Auliandari L (2018) Spatial distribution of coliform bacteria in the downstream section of Musi river. Majalah Ilmiah Biologi Biosfera: A Scientific Journal 35(3): 131-138.
- Sari AB, Putri WAE, Diansyah G (2019) Heavy metals Cu And Pb in sediments in Estuary Waters to. Journal of Tropical Marine Science 2(2): 71-75.
- Ginting EI, Indris F, Syakti AD (2019) Heavy metal Cadmium (Cd) in Mangrove in Tanjungpinang Waters, Riau Islands. Jurnal Ruaya 7(2): 73-83.
- Husainy IA, Bakti D, Leidonald R (2013) Analysis of heavy metal content of Lead (Pb) in water and sediment in Percut River, North Sumatera Province. Jurnal Sains 5(2): 20-29.
- Nemerow NL, Sumitomo (1970) Benefits of Water Quality Enhancement. DAJ, prepared for the U.S. Environment Protection Agency, USA.
- Adrianto R (2018) Monitoring the number of coliform bacteria in the river waters of lampung province. Agro-Industrial Technology Magazine (Tegi)10(1): 1-6.
- Sakan SM, Dordevic DS, Manojlovic DD, Predrag PS (2009) Assessment of heavy metal pollutants accumulation in the Tisza river sediments. Journal of Environmental Management 90(11): 3382-3390.
- Barbieri M (2016) The importance of Enrichment Factor (EF) and Geoaccumulation Index (Igeo) to evaluate the soil contamination. Journal Geology and Geophysics 5(1): 1-3.
- Forstner U, Muller G (1981) Concentration of heavy metals and polycyclic aromatic hydrocarbons in river sediments: geochemical background, man’s influence and environmental impact. Geo Journal 5(5): 417-432.
- Miranda F, Kurniawan, Adibrata S (2018) Heavy metal content of Lead (Pb) and Cadmium (Cd) in sediments in the river of Pakil, Bangka. Aquatics: Journal of Aquatic Resources 12(2): 84-92.
- Agustina DY, Suprapto D, Febrianto S (2019) Heavy metal concentration of Pb in Nile tilapia (Oreochromis niloticus) in Tenggang river, Semarang, Central Java (in Indonesian). Journal of Maquares 8(3): 242-249.
- Putri WAE, Bengen DG, Riani E (2015) Concentration heavy metals (Cu and Pb) in Musi river estuary. Jurnal Ilmu dan Teknologi Kelautan 7(2): 453-463.
- Fadillah S, Rinidar, Armansyah T (2017) Contamination of heavy metal (Pb) in flesh of Needlefish (Tylosurus crocodilus) at Krueng Raya Aceh Besar. Jimvet 1(3): 391-397.
- Mariadi PD, Kurniawan I (2018) The content of heavy metal lead (Pb) in snakehead fish (Channa sriata) sold at KM 5 market in AvoER National Seminar 2018, Faculty of Engineering, Sriwijaya University, Indonesia, pp. 900-903.
- Windusari Y, Sari NP (2015) Water quality of Musi river at Palembang city South Sumatera. Bioeksperimen 1(1): 1-5.
- Arnot O, Budiyanto, Rustama (2019) Quality standard evaluation of Nelas River using STORET method and Pollution Index. Naturalist-Journal of Natural Resource Management and Environmental Research 8(1): 15-24.
- Putri WAE, Bengen DG, Prartono T, Riani E (2016) Accumulation of heavy metals (Cu and Pb) in two consumed fishes from Musi river estaury, South Sumatera. Ilmu Kelautan 21(1): 45-52.
© 2022 © Knežević Marija. This is an open access article distributed under the terms of the Creative Commons Attribution License , which permits unrestricted use, distribution, and build upon your work non-commercially.
Editor In Chief


.jpg)


Signup for Newsletter

Quick Links
 Editorial Board Registrations
 Submit your Article
 Refer a Friend
 Advertise With Us
Our Recent Edition

.jpg)


Top Editors


.jpg)


.bmp)
.jpg)
.png)
.jpg)


.jpg)


.png)

.png)


.png)


Financial Support

Sponsors

Latest e-Books

Latest Video

 a Creative Commons Attribution 4.0 International License. Based on a work at www.crimsonpublishers.com.
Best viewed in
a Creative Commons Attribution 4.0 International License. Based on a work at www.crimsonpublishers.com.
Best viewed in