- Submissions

Full Text
Environmental Analysis & Ecology Studies
Frost Action Damages Effect in Correlation with IRI Data: A Study on Sections of Road BD97 and BD841
Ludvig Danfors1, Niklas Mannelqvist1, Tarun Bansal1* and Virgilio Pérez2
1Luleå University of Technology, Sweden
2Ramboll, Sweden
*Corresponding author: Tarun Bansal, Luleå University of Technology, Sweden
Submission: January 27, 2021Published: May 26, 2021

ISSN 2578-0336 Volume8 Issue3
Abstract
In northern regions of the world, frost action damages are a common problem on roads. Frost action damages often result in unevenness in the road surface and cracks in the pavement. Cracked asphalt leads to an uncomfortable driving experience and decreases the safety of the road. Since the frost action damages can affect traffic much it is important that the road owners maintain the road networks and also perform surveys to identify areas affected by frost action damages. Today, frost action damages are identified by visual inspection which is a time-consuming method. International Roughness Index (IRI) data is collected on most roads across the world and is used to determine the smoothness of the roads. If there would be a way of determining what types of damages are present on the road from IRI data, it would save a lot of time. This paper focuses on finding a correlation between IRI data and identified frost action damages by examining pictures taken along two roads in Norrbotten county, Sweden and identifying what damages are caused by frost action and where they are located. The IRI data from the same sections have been examined to identify a connection. The IRI values increase most of the time at frost action damaged sections, however, the same is true for sections with bearing capacity damages. Damages on roads can be located but not identified using IRI-data.
Introduction
In northern regions, problems with frost action on public roads are a widely spread phenomenon. Frost action damages are caused by uneven heave and thaw weakening in the road body due to construction in a frost susceptible soil. Frost damages appear more developed in the winter and springtime when the ice lenses expand due to the water suction at freezing front. At sub-freezing temperature, the moisture content in soil is converted to ice. There is a 9% volumetric increase when water is converted to ice. Another reason for the expansion of ice lenses is the availability of extra water which is transported from the groundwater table due to the suction generated by the temperature gradient frozen fringe [1,2]. International Roughness Index (IRI) is the measurements of unevenness on a road in the direction of travel. This index represents the total vertical displacements of the wheel axis (unsprang mass) relative to the vehicle frame (sprung mass). One way of measuring unevenness and how it affects the traffic is to measure the movement of the suspension of a vehicle as it is driven along the road. The problem is that the measurements will be affected by the weight of the car and the suspension adjustments. To receive results repeatedly, a quarter car is simulated going 80km/h. By simulating the vehicle, a constant speed can be set, and the suspension can be tuned to the golden car values. The golden car is a fictitious car with well-defined suspension characteristics. There are a few limit values for IRI data. IRI<2 and the road feel even, at IRI=2 the road starts to feel uneven and at IRI>3,5 the road feels so uneven that it feels unsafe to drive at the posted speed limit. Interpreting IRI is not an exact science meaning that the limits described above are not always the case. Variations in IRI have a bigger impact than just the values. Large variations can make roads with IRI<2 to feel unsafe while roads with IRI>3 are experienced as rather smooth if there are small variations on the IRI [3]. The quarter car simulator with golden car characteristics is shown in (Figure 1); [4].
Figure 1: Quarter car simulator with applicable parameters from Trafik verket VVMB115:2014.

The pictures that have been studied in this project has been collected by a special survey vehicle. The vehicle is equipped with GPS and both front- and back-facing cameras and is driven along the section of road that is being surveyed. The cameras take a picture with even spaced intervals and the GPS gives each picture coordinates. By giving the coordinates of the picture, there will not be any confusion about to what section of the road that the pictures are showing. Today, there is not a known way of utilizing IRI data to identify frost action damages. The IRI data is a measure of unevenness in the direction of travel. The IRI measurements are used to know how the traffic is affected by the unevenness of the road. To identify frost action damages visual inspections has to be made. The road sections have all been assessed on whether the damages are caused by frost action or poor bearing capacity.
In this paper, a study is performed to see if there is a correlation between frost action damages and IRI data. Two roads have been studied: BD97 and BD841, both situated in Norrbottens county, Sweden. The road section studied on-road BD97 is situated east of Vuollerim heading in a western direction and the section on road BD841 is situated between Korpilombolo and Kivijärvi heading in a north-western direction. Pictures and IRI-data used in the study have been delivered by Ramboll consultancy. The pictures were taken in 2018 for road BD97 and in 2020 on road BD841. In Table 1 below, information about the roads studied in this project is presented [5]; (Table2).
Table 1: Road data [5].
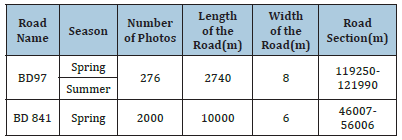
Table 2:Result of damages on road BD97 and BD 841.

Method
The pertinent literature used to correctly evaluate the damages have been:
1. The handbook in the condition assessment of paved streets and roads (Bära eller brista),
2. TDOK 2013:0669 (Inventory of frost action damages on existing roads),
3. TDOK 2014:0138 (Inventory and evaluation of existing roads).
These requirement documents and the handbook are used to identify the damages according to industry standards. Once all the frost action damages were identified and their positions noted, the IRI data was examined. The IRI data for the road section was considered for the same location as the pictures. Afterwards, the identified frost action damages were paired with the positions of the IRI data. By doing this, the effects of frost action damages on the IRI measurements could be evaluated. An IRI-value of 2 was chosen for comparison with the identified frost action damages in the pictures as an IRI-value greater than 2 yields uneven heave on the roads [3]. Then, the amount of frost action damages yielding an IRI value ≥2 could be determined. The total length of all frost action damages combined was approximated which allowed for calculations being made on how much of the road sections were affected by frost action damages.
During the assessment, frost action damages have been categorized into four categories: frost cracks, temperature cracks, stone heave and culvert movement (either positive or negative). Temperature cracks have been assessed as frost action damages, although they have not been a part of the final comparison IRIdata since the damage is not caused by frost actions in the soil. The reason for its inclusion in the classification is because it might have an impact on the IRI-value since the width of a transversal crack could easily be tracked in the measurement equipment.
Bearing capacity damages
The road damages caused by bearing capacity are only identified to separate them from frost action damages, i.e., these damages are not documented and taken into consideration in the result. There are two important characteristics of bearing capacity damages that have been decisive when looking through the pictures. The first characteristic is micro-cracks in the road surface as shown in Figure 2 which are mainly caused by aged asphalt.
Figure 2:Micro-cracks in the pavement caused the bearing capacity failure. The picture is taken at section 46082 on road BD841 with an IRI measuring vehicle and is provided by Ramboll.

The other characteristic is failures in the wheel tracks as shown in Figure 3 below. These cracks are developed when the bearing capacity is exceeded. The difference in bearing capacity cracks compared to frost cracks, which are quite similar in appearance, is the smaller width, location in wheel tracks and straightness. Figure 3, Cracks in wheel tracks caused by bearing capacity failure. A picture is taken on section 46607 on road BD841 with an IRI measuring vehicle and is provided by Ramboll.
Figure 3: Cracks in wheel tracks caused by bearing capacity failure. A picture is taken on section 46607 on road BD841 with an IRI measuring vehicle and is provided by Ramboll.

Description of frost action damages
Figure 4: Positive culvert movement from road BD841. The picture is taken on road BD841 at section 46797 with an IRI measuring vehicle and is provided by Ramboll.
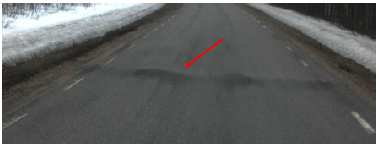
Culvert movement: A culvert movement can be both positive and negative. It is defined as positive, see Figure 4, when there is an upward buckling and negative, see Figure 5, when there is a dip in the road. A culvert makes it easy for cold air to travel inside and thereby cause frost action heave on surrounding frost susceptible soil. The positive culvert movement is created when the soil is heaving due to the frost action. If the frost action heave on the soil around the culvert rises higher, this may be experienced as a dip in the road and classified as a negative culvert movement [6]. Figure 4, Positive culvert movement from road BD841. The picture is taken on road BD841 at section 46797 with an IRI measuring vehicle and is provided by Ramboll. Figure 5, Negative culvert movement. The picture is taken on road BD841 at section 50499 with an IRI measuring vehicle and is provided by Ramboll.
Figure 5: Negative culvert movement. The picture is taken on road BD841 at section 50499 with an IRI measuring vehicle and is provided by Ramboll.

Stone heave: If the soil below the road body contains boulders, they can move upward towards the road surface. When a frost susceptible soil is exposed to a frost cycle, the frost front propagates from the top and expands further down with time. A cavity forms above the stone due to frost heave of the surrounding soil. Although, the stone remains in place if the self-weight and cohesion forces are in equilibrium with the freezing between soil and stone. As soon as the lifting force is larger than the forces keeping the stone in place, it will start to move upwards which enables a space below the stone. Pore water and fine particles from the unfrozen soil from beneath will start to fill the space due to a negative pressure adjacent to the ice lens above. This water later freezes and initially rejects the stone from falling when the thawing period starts. Since stones have a higher thermal conductivity than soil, the water will melt earlier than the soil around the stone. This means that the stone remains in its position due to freezing forces while smaller particles are gravitationally moving downwards and settling in the space below the stone preventing it from returning to its original position before the frost cycle. Viklander P [7] Every period of frost, the boulder moves further up and might cause a severe unevenness in the road surface [8].
Figure 6:Temperature crack. The picture is taken on road BD841 at section 51409 with an IRI measuring vehicle and is provided by Ramboll.
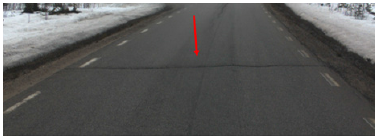
Temperature cracks: Since asphalt, like many other materials, can shrink during a period of low temperatures, it results in so-called temperature cracks. As seen in Figure 6, they appear as transversal cracks in the pavement with regular distance in-between [3]. Figure 6, Temperature crack. The picture is taken on road BD841 at section 51409 with an IRI measuring vehicle and is provided by Ramboll.
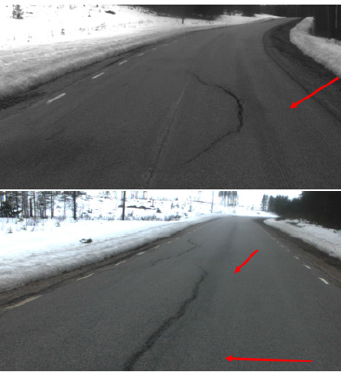
Frost cracks: Frost cracks are caused by uneven frost heaving and appear as longitudinal and widened cracks. The uneven frost heaving can be caused by an isolating snow layer surrounding the road. The occurrence is dependent on many factors like chosen construction material and temperature. The location is varying depending on the width of the road. Roads with a width of 5-6 or 12-13 meters tend to develop frost cracks on each side. Roads with a width of 7-9 meters tend to develop frost cracks in the middle of the road [9]. Figure 7, Frost cracks. The picture is taken on road BD841 at section 49874 and 49709 with an IRI measuring vehicle and is provided by Ramboll.
Figure 7: Frost cracks. The picture is taken on road BD841 at section 49874 and 49709 with an IRI measuring vehicle and is provided by Ramboll.
Result and Discussion
By adding the numbers of pictures with identified frost action damages and dividing it with the total number of pictures, the percentage of the road that is subjected to frost action damages is determined. Since the spacing between each picture is a set distance, 10 meters for BD97 and 5 meters for BD841, it is possible to add together the number of pictures containing frost action damages to get a total distance of all frost action damages. On-road BD97, the pictures are obtained from two different seasons meaning that the damages will not be the same. On-road BD841 the pictures were only taken in the spring.
When comparing the pictures with the IRI values, each frost action damaged section was paired with its corresponding IRI value. As mentioned earlier, the limit value for a road experienced as smooth is IRI<2. Therefore, the amount of IRI values ≥2 for frost action damaged sections was calculated and then divided by the total amount of frost action IRI values. This resulted in a ratio of how much of the frost action damages resulted in IRI ≥2 i.e., how much of the damages that create an uneven feeling when driving on the road.
The IRI data is obtained on both studied roads in sections of 20 meters. Therefore, the total distance of damages in Table 3 differs from the result in Table 2 where the picture material only covers sections of 5 and 10 meters. Damage might only be apparent in 5 meters of the section but will even though count for 20 meters when comparing with IRI data. The total distance of IRI≥2 is thereby also accounted for sections of 20 meters. The ratio of IRI≥2 is therefore assumed to be a fair result based on the provided data material. There were some road sections where no IRI data was available, therefore, frost action damages that have been identified in those sections have been disregarded since there were no data to correlate it to. The result from studied IRI data is presented in Table 3 below.
Table 3:Result of frost action damages concerning IRI data on road BD 97 and BD841.Frost cracks. The picture is taken on road BD841 at section 49874 and 49709 with an IRI measuring vehicle and is provided by Ramboll.

The result indicates that for road BD841, a clear majority of the assessed frost action damages are also related to IRI values bigger than 2. When looking at the result from summer and spring seasons on-road BD97, there is no relation between frost action damages and IRI values bigger than 2. The IRI values on-road BD97 were significantly lower on average than on-road BD841. One reason for this is the difference in road width. As mentioned earlier, a road of 5-6 meters in width tend to develop frost cracks on the sides of the road while a road with a width of 7-9 meter tends to develop frost cracks in the middle of the road. Therefore, the location of damages will have an impact on the result.
Figure 8:Comparison between IRI and photos.
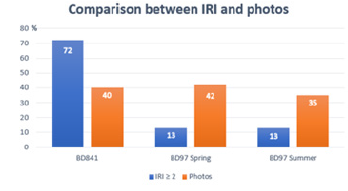
In Figure 8, a comparison between IRI data and photos is presented. However, the photos show how much of the studied road that is affected by frost action damages compared to IRI values ≥2. By that, the figure does not show a correlation between detection of frost action damages and IRI data. The length of the frost damages is most likely overestimated. Since it is hard to see distances in the pictures, the damages were named to the corresponding distance number from the pictures they appeared in. Therefore, a crack that is 7 meters could be classified as a 10-meter crack in BD841 and for BD97 it could be classified as a 20-meter crack if its placement in the pictures was unfavorable. This will result in an underestimation of the condition of the roads.
The IRI-data is not an exact science. From course literature [3], some limit values are given. The clearest limit value is IRI=2, which is the state where the road starts to feel uneven when driving on it. However, the fluctuations in IRI are at least as important as the actual values are. For example, a road with IRI=3 but with low fluctuations can feel rather smooth, but a road with IRI=1.8 but with larger fluctuations can be deemed so uneven that it must be repaired. The decision to only include frost damages yielding IRI ≥2 in the result is mostly based on the limit value from [3] since there are so many factors to have in mind when interpreting IRI data. The project had too little information and time for the group members to thoroughly determining IRI values that could have been more representative of the roads studied. For BD97, there are small fluctuations and small IRI values, so even if 35-40% of the road is subjected to frost damages, the road should feel smooth and even when travelling along with it. BD841 has large IRI fluctuations and values, therefore BD841 will most likely feel uncomfortable to drive on meaning that it should soon be repaired for traffic to maintain the posted speed limit and increase safety.
After identifying where the frost action damages are situated and compared with the IRI values right before and after these sections, a few things became apparent. Frost action damages usually render higher IRI values. There are sections on both roads when the presence of frost action damages do not render in an increased IRI value. What these sections have in common are small damages on the left lane of the road. The IRI values provided in this project are only from the right side of the road, and therefore these frost action damages do not affect the IRI values. Frost action damages usually render higher IRI values but the same is true for cracks and other discontinuities from bearing capacity failures. In some places on road BD841, there were also large IRI values which could not be directly connected to any damages using the pictures. The assumption was then that in these sections there are “smooth” dips in the road that are very hard to identify by only assessing the pictures.
It is possible to locate damages on the road using IRI data, however, it was not possible to find a way to identify whether the cause of the damage is due to frost action or bearing capacity. If only the IRI data is examined, it is also possible to miss frost action damages if these damages have not spread to the location where the quarter car is surveying. Another reason which made it very hard to identify what caused the spikes in IRI data is because of the limitations of IRI data. The only thing that IRI shows, is a change in smoothness on the road. It does not provide the width of the road, soil profiles or surrounding landscapes. Very little except for the condition of the roads is revealed through IRI measurements.
Only identifying the cause of the damages from the pictures can be tricky. The project members came Some pictures were not clear enough to identify the cause of the damage with ease. After consulting the consultant agency Ramboll it became clear that even the professionals would like more information to state the cause. This indicates that a lot of information is needed to identify the causes of damages, meaning that the information in this project was lacking to accurately identify damages. Some conclusions have been made during this project work. The reliability of these conclusions can be argued, the project has only looked at sections of two roads, and data for one year for each road section. To make more reliable conclusions more data should be examined, especially since it is patterns that need to be identified. The larger amount of data, the more certain one can be about the patterns found. To be able to make reliable conclusions data for several roads should be examined during different seasons and for several different years.
Conclusion and Future Work
A. The IRI values are higher at sections with frost action damages compared to just before and after the damaged section, however, the same is true for bearing capacity damages. Therefore, IRI data cannot be used to identify frost action damages.
B. The width of the road is important since it is a major factor in where the frost action damages will occur and can therefore contribute to lower or higher IRI.
C. Road BD97 is deemed mostly even and fine, traffic should not have any problems keeping the posted speed limit and feel comfortable driving their vehicles on the road.
D. Road BD841 is deemed uneven and road users will likely feel unsafe when driving the posted speed limit.
E. For future work more data should be examined, pictures from several years and IRI data for both summer and winter for several years.
Acknowledgement
The authors would like to thank Prof. Sven Knutsson and Prof. Jan Laue for the guidance and valuable suggestions in carrying out this study. Also, many thanks to Johan Ullberg from Trafikverket in the encouragement of this study.
References
- Taber S (1930) The mechanics of frost heaving. The Journal of Geology 38(4): 303-317.
- Beskow G (1947) Soil freezing and frost heaving with special application to roads and railroads. Technological Institute, Northwestern University, Evanston, Illinois, USA.
- Agardh S, Parhamifar E (2017) Road construction.
- Trafikverket (2004) The Swedish Transport Administration's online store.
- Trafikverket (2020) PMSV3. Sverige.
- Viklander P (1997) Laboratory study of stone heave in till exposed to freezing and thawing. Luleå 27(2): 141-152.
- Trafikverket (2018) Experiences of geotechnical work with risk reduction measures.
- Wågberg LG (2003) All or nothing. The asphalt school.
- Zhang Y, Michalowski RL (2012) Frost-induced heaving of soil around a culvert. GeoCongress 2012.
© 2021 Tarun Bansal. This is an open access article distributed under the terms of the Creative Commons Attribution License , which permits unrestricted use, distribution, and build upon your work non-commercially.
 a Creative Commons Attribution 4.0 International License. Based on a work at www.crimsonpublishers.com.
Best viewed in


.jpg)


 Editorial Board Registrations
 Submit your Article
 Refer a Friend
 Advertise With Us
.jpg)


.jpg)


.bmp)
.jpg)
.png)
.jpg)


.jpg)


.png)

.png)


.png)


