- Submissions

Full Text
COJ Technical & Scientific Research
A Mesh Networks System for Traffic Counting Using IoT
Haluk Laman1, Marc Gregory2 and Amr A Oloufa2*
1Osmaniye Korkut Ata University, Turkey
2University of Central Florida, Orlando, USA
*Corresponding author:Amr A Oloufa, Professor, University of Central Florida, Orlando, Fl, USA
Submission: January 24, 2025:Published: March 26, 2025

Volume5 Issue4March 26, 2025
Abstract
The successful development of effective real-time traffic management and information systems requires high-quality traffic data in real time. Traditional methods, including manual counts and the four-step planning model, have proven to be time-consuming and costly. While existing automated systems such as pneumatic traffic counting systems, CCTV, and image processing have been utilized, they often involve significant expenses related to installation and maintenance, especially in environments requiring minimal disruption. This paper discusses the design and field implementation of a novel, solar-powered, automated, real-time Origin-Destination (O/D) data collection and communication system that is reliable, inexpensive, and portable. By leveraging a combination of commercial off-the-shelf hardware and custom software, this system presents a more cost-effective and flexible alternative. Collected data from two test sites were extensively evaluated and compared with loop detector counts to assess accuracy and performance.
Keywords:Traffic data collection; Traffic counting sensors; Mesh network
Introduction
The increasing demand for efficient and accurate traffic management systems has
necessitated the development of advanced data collection technologies. Existing solutions,
such as pneumatic traffic counting systems, CCTV, and image processing, have proven effective
in certain scenarios but often come with significant limitations. These include high installation
and maintenance costs, the need for constant power supply, and challenges in deploying these
systems in remote or off-grid locations. Despite their widespread use, these systems may also
require frequent traffic interruptions for installation and maintenance, which can lead to
additional costs and inconveniences. Furthermore, many of these technologies are designed
for fixed, permanent installations, making them less suitable for temporary or rapidly changing
environments. This study addresses these gaps by introducing a novel, self-powered, solarbased
automated and real-time traffic counting system that overcomes these limitations.
Our approach focuses on creating a modular, portable solution that can be easily deployed in
various locations, including those without access to traditional power sources. The system’s
design leverages commercial off-the-shelf hardware, which not only reduces costs but also
simplifies the deployment process. The novelty of our approach lies in its self-sufficiency and
adaptability. The solar-powered design ensures that the system can operate independently of
the grid, making it suitable for both urban and rural settings. Additionally, the use of a mesh
network for data communication allows for seamless scalability, enabling the system to be
expanded or reconfigured with minimal effort. This study’s specific objectives are:
a) System design: To design a modular, solar-powered traffic counting system using
commercial off-the-shelf hardware combined with custom software.
b) Field implementation: To install and test the system at multiple test sites, ensuring its
reliability and effectiveness in both rural and urban settings.
c) Data evaluation: To collect traffic data and compare the
system’s accuracy with established methods, such as loop
detector counts, and manual counts conducted by the Florida
Department of Transportation (FDOT).
d) Communication and data transfer: To establish an efficient
communication protocol that enables the real-time transfer
of traffic data to a central traffic management center using
cellular communications.
Through this study, the researchers achieved the development of a reliable and cost-effective system that meets the needs for realtime traffic data collection, specifically addressing the challenges of power supply, communication, and installation. The results demonstrate that the system provides accurate traffic counts, with errors primarily occurring due to environmental factors, which are discussed in the results section.
Traffic data collection methods
Based on their functionalities, traffic data collection methods can be categorized into two main groups. In Figure 1, a category tree of technologies is provided. On-site detectors, also known as in-situ technologies and in-vehicle technologies which generate Floating Car Data (FCD). On-site detectors are also divided into two groups, such as intrusive (a.k.a. in the roadway) detectors and non-intrusive (a.k.a. on-roadway) detectors. An intrusive sensor is one that is embedded in the component of the roadway or attached to the roadway surface [1]. Commonly used intrusive technologies include inductive loop detectors, Weigh-In-Motion (WIM) sensors, embedded magnetometers, pneumatic detectors, and piezoelectric detectors. Non-intrusive technologies are mounted either above or alongside the roadways. Existing non-intrusive sensors can be listed as Automatic Vehicle Identification (i.e., license plate readers, Bluetooth readers, transponder readers, radio-frequency ID, Light Detection and Ranging (LIDAR)), Video Vehicle Detection Sensors (VVDS) (i.e., CCTV or video image processing), Microwave Detection Sensors (MVDS) (i.e., continuous-wave (CW, Doppler) and Frequency-Modulated Continuous-Wave (FMCW)), aerial photography, and infrared systems (i.e., active and passive infrared systems). In-vehicle technologies, which are relatively new traffic data sources, are considered in two groups in this report: probe vehicles and remote sensing. Probe vehicles could be further broken down into five different methods based on their technologies: GPS, mobile phone, Bluetooth device, Automatic Vehicle Location (AVL), and AVL systems [2].
Figure 1:Traffic data collection methods.
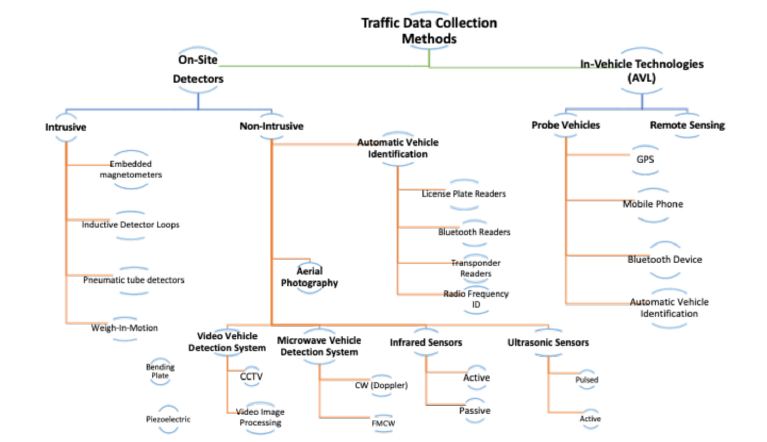
Non-intrusive technologies are generally less disruptive in terms of maintenance of traffic and have lower rates of failure as compared to intrusive detectors. Intrusive technologies are required to be permanent, while non-intrusive sensors/cameras could be either temporary (portable) or permanent (fixed). Further, in another way of categorizing in-situ technologies based on their functionalities, three groups are considered: point sensors, point-to-point sensors, and area-wide sensors. Point sensors are the most widely used category among traffic data collection methods in current use. These are inductive loop detectors, radar, infrared, MVDS, acoustic, ultrasonic sensors, video image detection systems, and WIM sensors where the data collection is performed at one single site/point. Examples of technologies in point-topoint sensors are AVI, AVL, license plate matching with optical character recognition algorithms. This type of data collection can be performed at multiple locations as vehicles move among the networks. With this type of detection, tracking and re-identification are achieved, which may provide average speeds, travel times/ delay, Origin-Destination (O/D) information, and route choices [3].
Recent advancements have also explored innovative methods for estimating truck volumes using aggregate data, such as the work by [4], which utilized linear programming techniques to improve the accuracy of truck volume estimates by incorporating empirical knowledge into the analysis. Similarly, [5] achieved a better precision in estimating truck traffic volume using singleloop detectors. However, limitations in their work, such as issues in congested scenarios or inability to process in adverse weather conditions, were noted. Our system addresses these challenges by integration with a solar-powered mesh network to ensure continuous data collection in varied settings. Additionally, the work by [6] explored hybrid renewable systems in traffic monitoring, highlighting the feasibility of sustainable sensor operation. While their work provided insights into renewable energy sources for remote traffic systems, it did not address lane-specific data collection and real-time communication across multiple nodes, which our study accomplishes through mesh-networked sensor systems. Last but not least, area-wide sensors are essential sources of real-time traffic monitoring. The traffic information collected using aerial photography, LiDAR technology, and VVDS systems can be considered area-wide sensors where the data requires a telecommunication connection for transferring to the Traffic Management Center (TMC). Recently, the Floating Car Data (FCD) concept is widely used in real-time traffic data collection. In this method, data is obtained from GPS equipped vehicles that provide higher coverage travel speeds in such high resolution (as low as 1-minute intervals). Therefore, FCD could inform the TMC to focus on recurrent congestion areas and is also capable of detecting nonrecurrent congestion, which possibly enabling drivers to avoid longer delays [7]. Effective traffic diversion and rerouting systems rely heavily on accurate and real-time traffic data collection methods, as the timely gathering and processing of traffic information are essential for dynamically adjusting routes and mitigating congestion across networked roadways. In recent years, the development of dynamic traffic management systems has gained significant attention, primarily due to the need to mitigate congestion and enhance road efficiency. Güner et al. conducted a pivotal study on dynamic routing solutions, focusing on handling both recurrent and non-recurrent congestion by utilizing real-time Intelligent Transportation System (ITS) data. Their research underscores the importance of adaptive routing strategies in reducing traffic delays, especially in urban settings where congestion is highly variable [8]. Morgul et al. introduced a web-based real-time data collection methodology for transportation operation performance analysis, utilizing virtual sensors to enhance the efficiency and accuracy of traffic monitoring systems, which serves as a foundational element for adaptive traffic management systems [9]. Building on this, another study explored dynamic traffic re-routing as a method to alleviate congestion, demonstrating the effectiveness of adaptive routing strategies in reducing traffic buildup in response to realtime conditions [10]. Similarly, Antoniou et al. evaluated various diversion strategies through dynamic traffic assignment models, illustrating how adaptive routing can mitigate congestion across complex transportation networks by responding to fluctuating traffic patterns [11]. Aved et al. contributed to this field with a real-time route diversion management system, which dynamically adjusts routing to enhance traffic flow efficiency, underscoring the benefits of integrating real-time data into traffic management systems [12]. Further supporting these advancements, another study introduced TraffSim, a traffic simulation tool designed to assess the impact of dynamic vehicle rerouting on urban congestion, providing valuable insights for congestion management in densely populated areas [13]. In a comprehensive review, Braekers et al. analyzed the state of the art in vehicle routing methodologies, emphasizing innovations that support efficient route planning and resource allocation, which are crucial for developing responsive and adaptive traffic systems [14]. Collectively, these studies highlight the critical role of advanced data collection, dynamic assignment models, and simulation tools in the evolution of traffic diversion and rerouting strategies aimed at improving urban traffic conditions. Furthermore, the DIVERT system, developed by [15], further advanced the concept of congestion avoidance through distributed vehicular traffic re-routing. This system leverages realtime data to dynamically adjust routing, aiming to prevent traffic bottlenecks by re-directing vehicles along less congested paths. The findings from this study highlight the potential of distributed systems in managing traffic flow, which is essential for urban traffic environments with high vehicular densities. In another study, Li and Khattak explored the impact of large-scale incidents on traffic flow, particularly focusing on how connected and automated vehicles could improve en-route diversions for both commercial and noncommercial traffic. Their research provides valuable insights into incident-induced congestion management, emphasizing the role of connected vehicle technology in creating responsive and adaptive traffic systems [16]. Luo et al. [17] presented a model predictive control framework that integrates real-time route diversion with multiple objectives, including traffic efficiency, emission reduction, and fuel economy. This multi-objective approach is particularly beneficial for cities aiming to create sustainable traffic systems by balancing efficiency with environmental considerations [17]. Finally, Wang et al. provided a comprehensive review of the advancements in dynamic traffic assignment methodologies, focusing on environmentally sustainable road transportation applications. Their work emphasizes the increasing integration of environmental objectives within traffic management strategies, reflecting a shift toward sustainable urban mobility solutions [18].
Methodology
System architecture
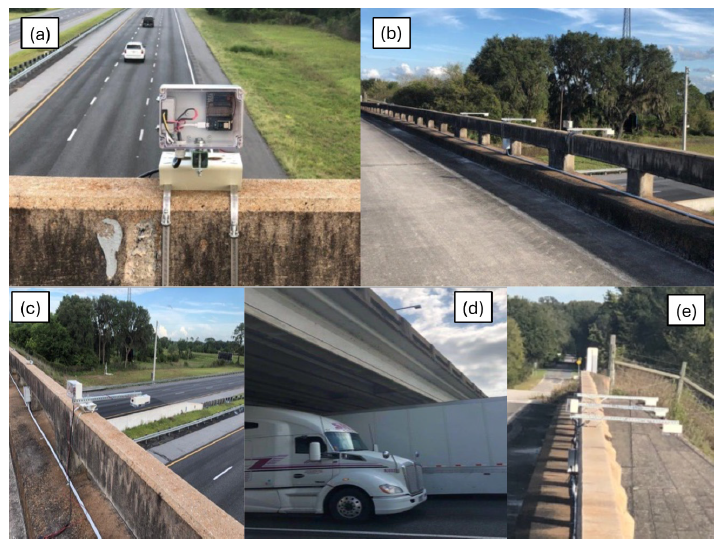
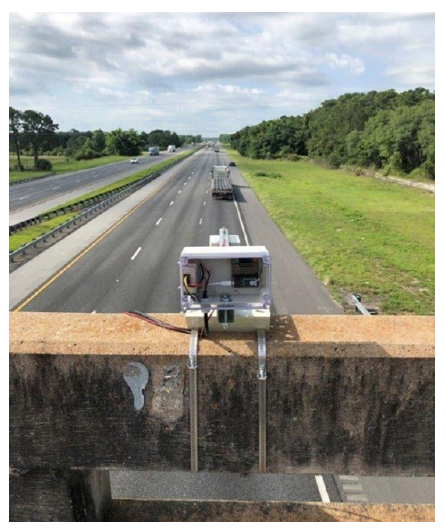
The major challenge in the design of the system was the need for integrated communications. The researchers needed to develop a system for traffic counts to be collected for each instrumented lane, then this data need to be transferred to an onsite collector (accumulator). The accumulator collected the data from all sensors then transfers it to a traffic center. To simplify system installation, the researchers wanted the system to be modular so that lanes can be easily added without having to include extra wiring for data. This necessitated the reliance on short-range communication technologies between the data collection nodes. Furthermore, short-range communication technologies were selected because of their low power requirements given that on a busy site, sleepmodes of processors cannot be used since all nodes are continuously broadcasting counts. On the other hand, Bluetooth Low Energy technology (BLE) offered an excellent solution. However, distances from the various nodes to the accumulator limited its application since for multi-lane highways, the distance between the accumulator and the farthest lane may easily exceed the typical Bluetooth limit of about 10 meters. Instead of communicating directly to the accumulator using BLE, the researchers selected mesh-technology where each data collection node communicates its information to the nearest node and so on until it reaches the accumulator (Gateway) shown in Figure 2a.
Figure 2:Accumulator (gateway) and brackets with sensor on overpass railing.
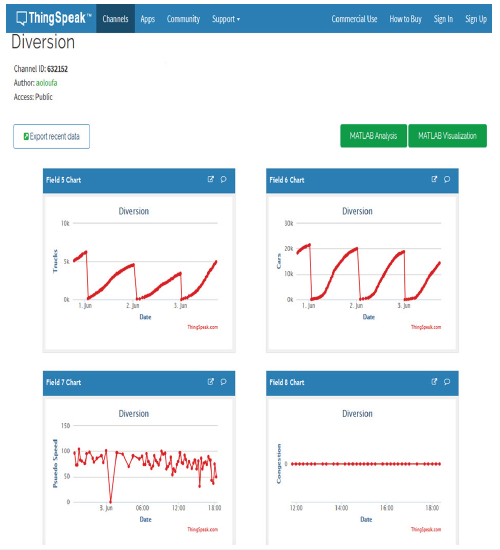
All the communications overhead is taken care of by the mesh network itself. This solution offered an optimal answer to the challenge. One can add data collection nodes without any changes to the underlying software (as long as each node is within 10 meters of another node). If a node goes down, the system would continue to operate since the mesh network automatically bridges to the data to the next closest node (Figure 3). The communication utilizes a mesh-architecture that enables one accumulator (Gateway) to communicate to a large number of sensors that may be a reasonable distance away from the Gateway. The selected hardware selected consisted of a “Gateway” microcontroller, which receives wirelessly, via BLE (low-power Bluetooth), data from several laser sensors. After every 25 vehicles are counted, the node communicates its data to the accumulator. The accumulator then aggregates 200 records from each sensor (lane) and communicates this information to the cloud (Figure 4). The Gateway aggregates the data in batches (200 data points each representing a car or a truck). The number of vehicles in a batch is configurable and has an impact on the number of batches communicated and, therefore, on the amount of data transferred, which in turn, impacts communication costs. The data is transferred to the cloud and stored on a Thingspeak website (https://thingspeak.com/ channels/632152). ThingSpeak is a cloud-based service for IoT analytics, enabling gathering, displaying, and assessing real-time data streams. It offers the capability to transmit data from devices to Thingspeak to generate live data visualizations and issuing of alerts. Data is graphed live, and an example of the captured data is shown in Figure 5. Thingspeak is a website owned by MATLAB and supports data analysis.
Figure 3:Mesh architecture.
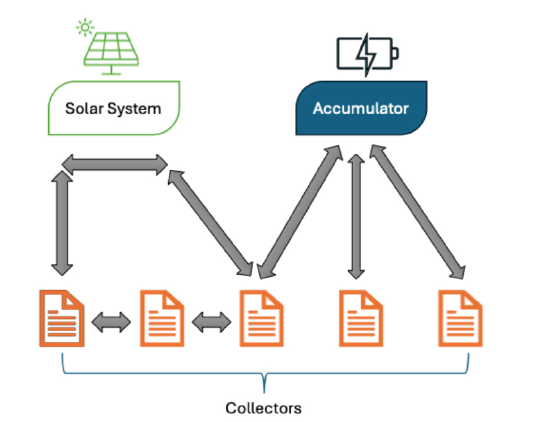
Figure 4:Communications flowchart.
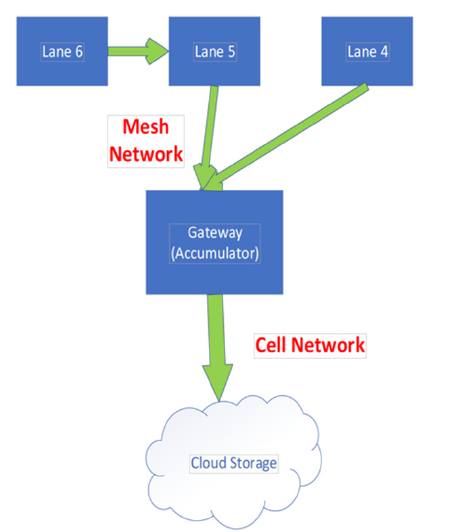
Figure 5:Thinkspeak website dashboard with traffic data June 1-3.
Traffic counting sensors
Each traffic lane has a laser sensor “Collector” that is connected to its microcontroller. This Collector processes the data from the sensor then communicates to the Gateway. Using cellular communications, the Gateway aggregates the data and then sends it to cloud storage. The system can be monitored, and the data collected can be viewed 24/7. To facilitate sensor installation, a hardware was developed to connect the sensors to overpasses. Connecting sensors to overpasses eliminate the need for costly and time-consuming Maintenance of Traffic (MOT) when connecting sensors to freeway gantries. A safety protocol was also developed to eliminate the need for MOT when installing sensors on overpasses. The field installation of this traffic counting system is shown in Figures 2b, 2c & 2d. For overpasses with 4” (10cm) pipe railings, the bracket shown in Figure 6 was developed. On barrier-type overpasses, the hardware shown in Figure 2e was used. For both brackets, only a daisy-chained power connection was needed since sensors communicated using wireless communications. This is the single most expensive component in the system ($40-$500) was the sensor. The researchers evaluated multiple sensors by installing them on a single bracket as shown in Figure 7. Counts from those sensors were compared to manual counts obtained from loops. On the basis of these tests, the researchers selected the Garmin sensor. 24 Volts of Direct Current (VDC) powers the system. Power comes from two 12VDC batteries that are wired in series. Additionally, a timer was added to recycle power to the system every 24 hours. From our experience, this clears potential memory problems that may disable the system or impact its operation. The batteries are recharged using the solar panels with a solar charge controller. The wiring diagram is shown in Figure 8 and the wiring in the field is shown in Figure 8. Weather conditions can significantly impact the performance of the solar-powered traffic counting system, particularly in terms of power generation and data accuracy. This includes cases such as cloud cover and reduced sunlight, snow and ice accumulation block sunlight and obstruct sensors, while rain and humidity may cause sensor fogging and impact electronic components, or fog can impair visibility for optical sensors, wet roads can cause reflections, and strong winds can blow debris into sensor paths, all of which can result in inaccurate traffic counts (Figure 9). To mitigate these challenges, the system includes a battery backup and power management to ensure continuous operation, regular maintenance to prevent buildup on panels and sensors, and weather-resistant equipment to protect against moisture and dust. Real-time monitoring and alerts enable timely intervention, while data correction algorithms help adjust for expected errors during adverse weather. In areas with frequent poor weather, alternative power sources are recommended to enhance system reliability. The test site was located at the overpass on I-75 and Warm Springs Ave. in Coleman, FL (Latitude 28.799864, Longitude -82.088359) and a map of the area is shown in Figure 10 & 11. Six traffic lanes were instrumented. Distance from the solar plant to the first sensor (and the new Gateway) is 75 feet. Distance from the Solar plant to the farthest sensor is 185 feet. Due to the long distances, the researchers had increased the voltage to 24V (two 12-VDC batteries wired in series). Two solar cells were used to cope with the power demands.
Figure 6:Bracket 1 with sensor.
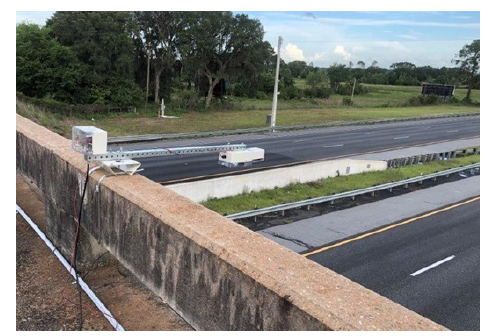
Figure 7Multiple sensors.
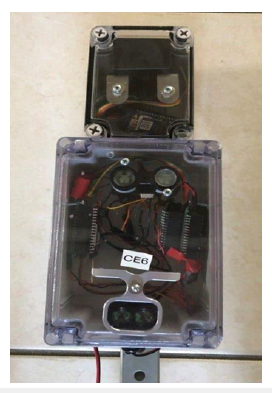
Figure 8Solar plant.
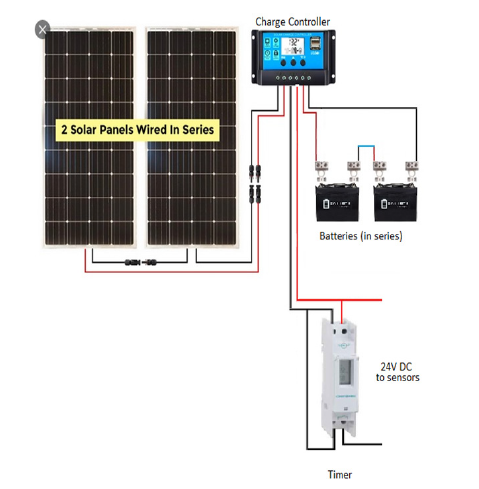
Figure 9Solar system.
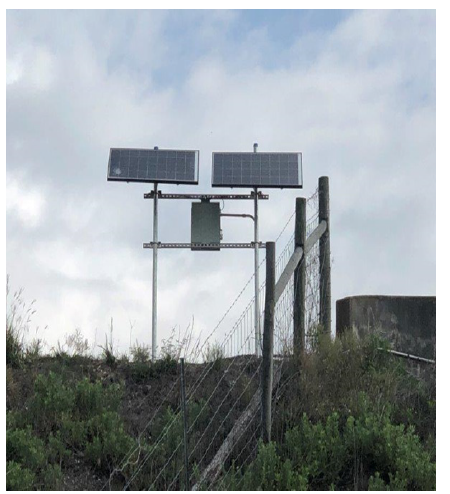
Figure 10Test site.
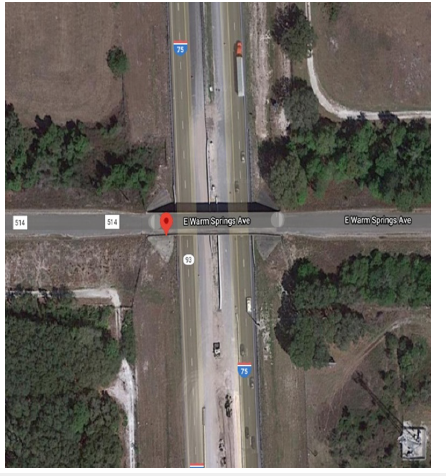
Figure 11Installation.
Results
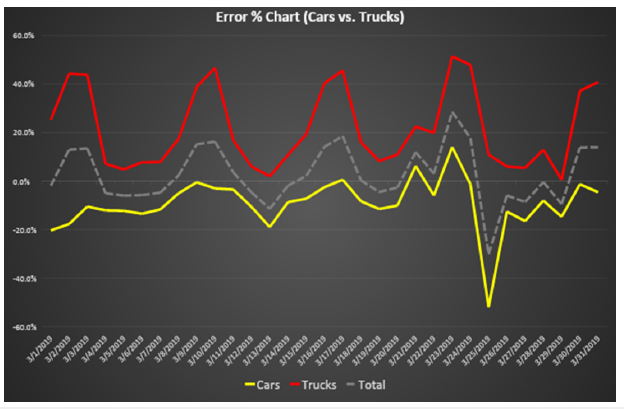
In the process of validating the accuracy of our traffic counting system, we compared the data collected by our system with ground truth data obtained through manual counting. Specifically, Table 1 presents the results from the manual counting conducted at the test site. These manual counts serve as a benchmark or ground truth against which we can assess the performance of our automated system. To conduct a comparative analysis, Florida Department of Transportation (FDOT) Telemetered Traffic Monitoring Site (TTMS) data were utilized as a benchmark. Summary results included counts from University of Central Florida (UCF) detectors versus TTMS detectors, per lane and vehicle type, and presented by calendar days as well as weekdays-only charts. Metrics used in this summary include +/- error ratio and accuracy of UCF counts as compared to TTMS counts. Daily counts in March 2019 from UCF detectors and TTMSs were collected per direction along with error percentages and accuracies for left lane, right lane, and total counts. In Figure 12, the accuracy profile for the same month is shown on left lane (blue line), accuracy was maintained at or above 90% for the entire month except for the 21st and 23rd of March, where it drops to 87.2% and 83.3%, respectively. Right lane (red line) and overall (grey-dashed line) accuracies are found to be lower on weekends. Error percentages are also presented in Figure 13. In another test day, count data were summarized by dividing in-vehicle type categories. In Figure 14 & 15, accuracies and error percentages were presented by vehicle types, including total counts. Similar trends are captured in these comparisons. UCF counts differ significantly compared to TTMS counts on weekends, while on weekdays, accuracy ranges from 85% to 100%.
Figure 12Accuracy comparison (left lane vs. right lane).
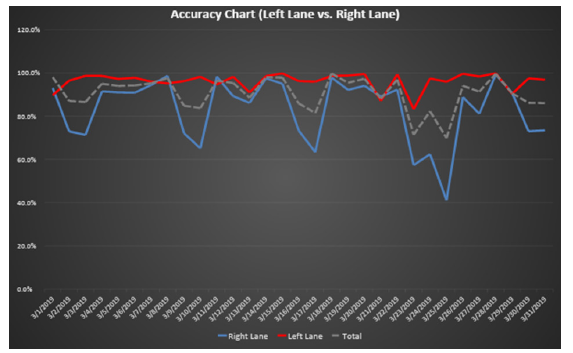
Figure 13Error percentage (left lane vs. right lane).
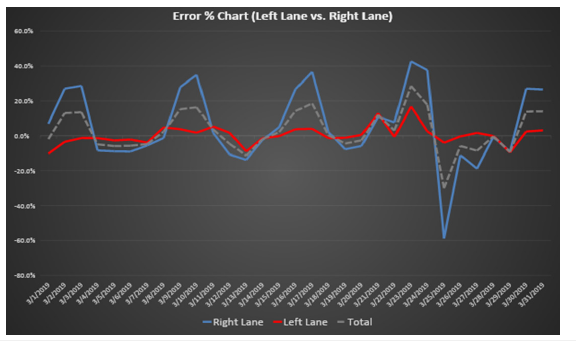
Figure 14Accuracy comparison (cars vs. trucks).
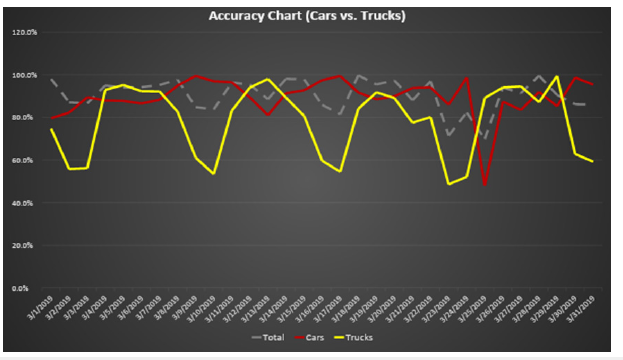
Figure 15Error percentage (cars vs. trucks).
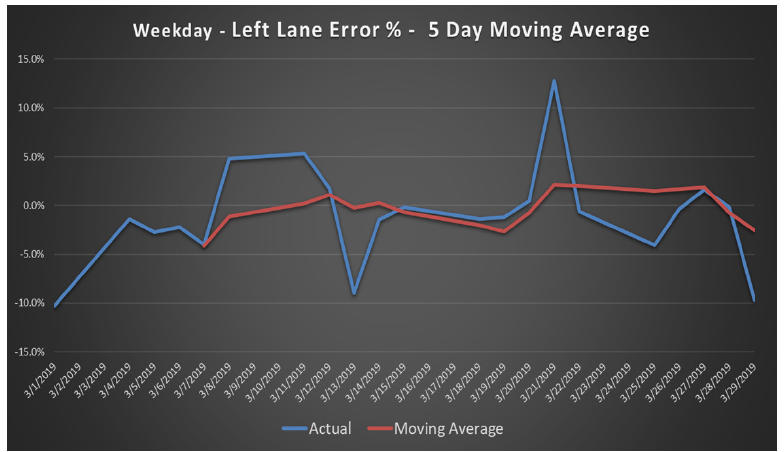
To compare each vehicle type counts on each lane, passenger car and truck counts on the left lane, and passenger car and truck counts on the right lane were summarized. Figure 16 represents counts from left lane only where trucks (Yellow line) and Cars (Redline) are compared utilizing error percentages. Total counts comparisons indicate low error percentages within 10% while in truck counts, much higher errors were captured, especially on weekends. To illustrate the overall trend with less noise in comparison charts, a 5-day moving average chart on the left lane is presented in Figure 17. Total counts are mostly within a 5% error range for the entire month. Figure 18 shows the trucks and cars’ error percentage profile for the entire month on the right lane. Overall, the errors are found to be much higher on the right lane as compared to left lane errors. The 5-day moving average chart in Figure 19 indicates that moving average errors of total counts on the right lane reach up to 20%. On the right lane, the 25th day of the month has a significant drop in UCF counts than TTMS’s. Due to higher error rates and lower accuracies seen on weekends via overall month profile charts shown earlier, summary statistics of only weekdays are also provided in this section. Figure 20 shows a left lane weekday error profile of March 2019 for cars and truck counts, while Figure 21 shows a right lane weekday error profile. 5-day moving average chart for total counts on the left lane (Figure 22) is also presented. As can be seen in these figures, by removing weekend counts, trendlines become smoother with less variation. Finally, to have a more detailed comparison and investigate the underlying causes of variations from TTMS counts, the 24-hour profile of each day in March has been provided for UCF, and TTMS counts for left-lane truck counts, left lane car counts, and right lane truck counts, right lane car counts, separately.
Figure 16Trucks vs. cars on left lane.
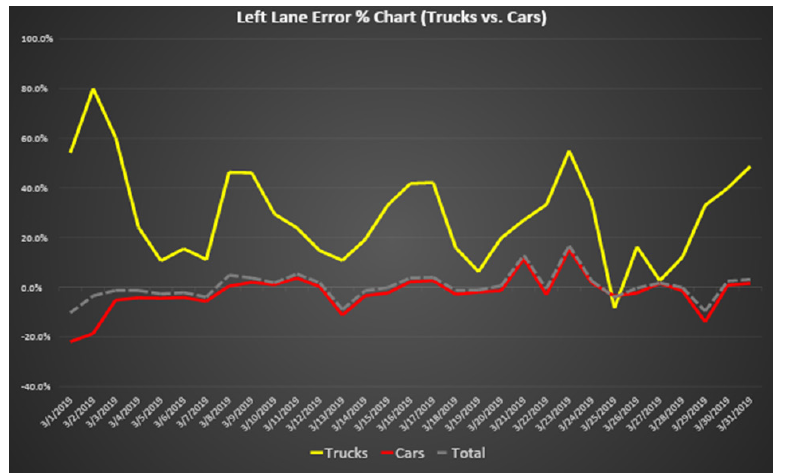
Figure 175-day moving average error percentage for left-lane counts.
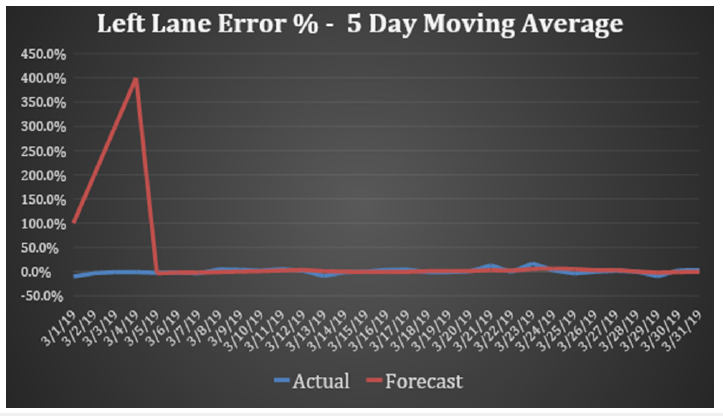
Figure 18Trucks vs. cars comparison on right lane.
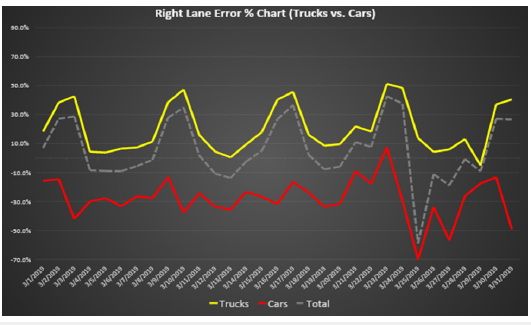
Figure 195-Day moving average error percentage for right-lane counts.
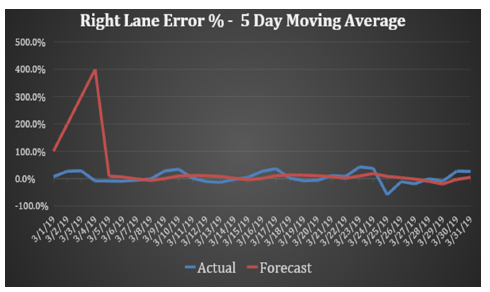
Figure 20Error percentage on weekdays: Left lane.
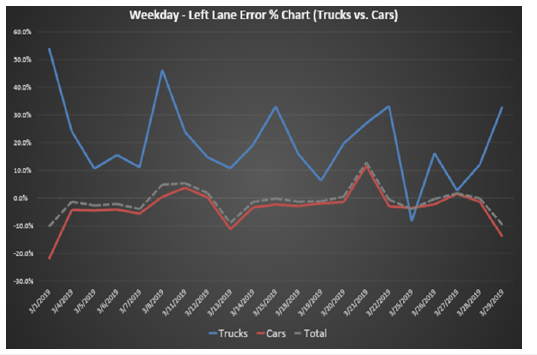
Figure 21Error percentage on weekdays: Right lane.
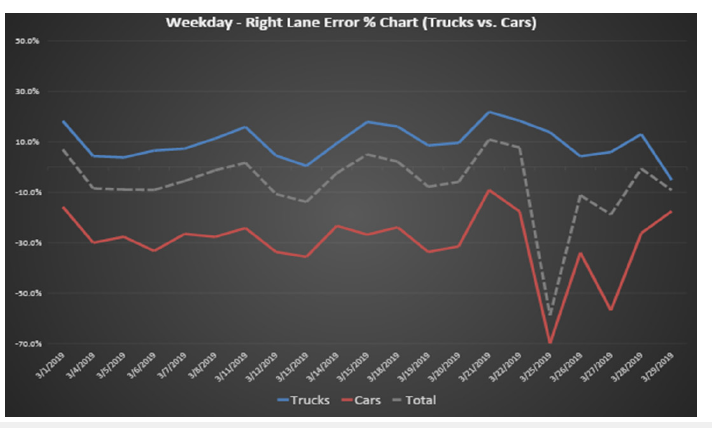
Figure 225-Day moving average error percentage on weekdays: Left lane.
Data validation for test site
To validate the accuracy of the collected data, the researchers
compared the traffic counts for cars and trucks collected by the
sensors and compared to loop counts from the Florida Department
of Transportation (FDOT). Also, the researchers conducted
manual counts via the FDOT camera. The results are summarized
in the tables on the next page and are followed by an analysis. It
is worth noting that sometimes, the video feed from the camera
was interrupted, which has an impact on the count’s accuracy.
The researchers will address this issue at a later date using the
following strategies:
a) If video feed continues to be unreliable, the researchers will
use a manual count at the site
b) Using the latest version of the Garmin sensor after the vendor
mentioned that earlier versions of the sensor (up to January
2020) had stability issues due to temperature and humidity
c) Use two new sensors and validate their performance.
In Tables 1-5, Lane 5 refers to the center lane of the southbound
direction of travel. The “Fast Lane” refers to the leftmost lane
of travel. Lane 4 (not shown) is the rightmost travel lane in the
southbound direction. Some differences in cars vs. trucks may be
attributed to the way that FDPT classifies various smaller trucks.
UCF fast lane counts are within 1% 4% of the FDOT loop counts,
with an average of 1.8% using data from 3 days
a) UCF fast lane counts are within 2% of manual counts.
b) UCF middle lane counts are within 2% of manual counts (based
on a 1-hour manual count comparison).
Table 1:Data collection 12/06 for three hours (2:00pm to 5:00pm).

Table 2:Data collection 12/07 all-day.

Table 3:Data collection 12/08 all-day.

Table 4:Data collection 12/09 all-day.

Table 5:Data collection 12/13 for one hour (2:00pm to 3:00pm).
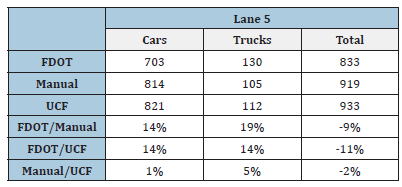
However, in comparison with FDOT loops counts, it varies by up to 10%. The research team continues to assess the reason for the discrepancy by making code revisions and by trying new sensors. Table 1 through 4 includes data from a three-hour manual counting session, where the number of cars and trucks passing through the test site was recorded manually. The table also includes a comparison of these manual counts with the data collected by our system and the FDOT loop detectors. These results demonstrate a high level of accuracy, suggesting that the system can produce reliable traffic counts that closely match the ground truth. Our analysis identified weekend discrepancies in sensor readings, which can be attributed to both inherent sensor limitations and variations in environmental conditions. For instance, lower traffic volumes and changes in ambient lighting during weekends may affect the sensor calibration.
Conclusion
The researchers designed and implemented a microcontrollerbased system for counting cars and trucks. The system is solar-powered and includes the ability to both collect data and communicate these data to the cloud, thereby offering real-time counts and traffic assessment. The presented results clearly demonstrate the effectiveness of our system in accurately counting vehicles. The close alignment between our system’s results and the manual ground truth highlights the system’s potential for use in real-world traffic monitoring applications. Additionally, any discrepancies observed, particularly in the middle lane counts, have been analyzed to understand potential sources of error, such as sensor misalignment or environmental factors. These findings underscore the robustness of our system and its applicability in various settings, including those without traditional power Collected data via the system design, hardware, and software were extensively evaluated. Data collected from the two test sites were compared with the loop detector counts under the supervision of Florida Department of Transportation District 5. As a result of the data analysis from test site 1, data collected during weekdays, results showed that the accuracy relative to loop counts varies from +/- 5% to +5/-10%. Furthermore, data analysis based on the test site 2 has shown that the UCF fast lane counts are within 1%, 4% of the FDOT loop counts, with an average of 1.8% using data from 3 days. UCF fast lane counts are within 2% of manual counts. UCF middle lane counts are within 2% of manual counts (based on a 1-hour manual count comparison). Finally, when FDOT loops counts were compared with UCF middle lane counts, differences reached up to approximately 10%. In some cases, variations up to 8% were due to sensor issues.
Limitations and Future Work
The performance of traffic monitoring systems is significantly influenced by environmental conditions. While this study did not conduct a dedicated extreme weather testing phase, the system was operational throughout the month of March, covering a range of weather conditions, including temperature fluctuations, humidity changes, and moderate rainfall. The analysis of this period revealed that the system generally maintained a high level of accuracy. However, for broader applicability, future research will focus on systematically evaluating the system under extreme weather scenarios, such as heavy snowfall, prolonged heavy rainfall, and extreme temperature conditions, over multiple seasons. Additional mitigation strategies will be explored, including the development of enhanced protective casings and adaptive calibration algorithms, to ensure consistent performance under challenging environmental conditions. Furthermore, observed discrepancies in traffic counts-particularly on weekends-highlight the need for further investigation into sensor limitations and environmental influences. Differences in traffic behavior, variations in ambient lighting, and changes in vehicle composition during weekends may impact sensor accuracy. Future research will focus on refining sensor calibration techniques and integrating machine learning models to adaptively correct for such variations. Additionally, improvements in sensor placement strategies and data post-processing algorithms will be considered to enhance system reliability across different traffic patterns.
Last but not least, scalability is another key factor for the effective deployment of traffic monitoring systems, particularly in dense urban areas and complex road networks. The modular design of our system enables straightforward scalability by adjusting the number of sensors and their deployment configuration. Since each sensor operates within a mesh network, additional nodes can be seamlessly integrated without requiring significant hardware modifications. While the current study primarily tested the system at specific locations, its architecture supports expansion into high-density traffic environments. Increasing sensor density and optimizing network communication protocols are potential pathways for system improvement. Future research will investigate system performance in highly congested traffic areas, addressing challenges such as sensor interference, real-time data synchronization, and increased network traffic. Additionally, dynamic calibration techniques will be explored to enhance adaptability across varying traffic conditions.
References
- Shi Q, Wu Y, Radwan E, Zhang B (2016) Integration of microscopic big traffic data in simulation-based safety analysis. TRID, pp. 1-134.
- Mimbela LEY, Klein LA (2000) A summary of vehicle detection and surveillance technologies used in intelligent transportation systems. pp. 1-218.
- Antoniou C, Balakrishna R, Koutsopoulos HN (2011) A synthesis of emerging data collection technologies and their impact on traffic management applications. European Transport Research Review 3(3): 139-148.
- Kwon S, Park H, Chung K (2022) Innovative method for estimating large truck volume using aggregate volume and occupancy data incorporating empirical knowledge into linear programming. Transportation Research Record: Journal of the Transportation Research Board 2676(11).
- Kwon TM, Weidemann R, Cinnamon D (2008) TDRL projects: Solar/wind hybrid renewable light pole, gravel-road traffic counter, dll-based traffic software development kit.
- Kwon J, Varaiya P, Skabardonis A (2003) Estimation of truck traffic volume from single loop detectors with lane-to-lane speed correlation. Transportation Research Record: Journal of the Transportation Research Board 1856(1): 106–117.
- Selezneva O, Wolf DJ (2017) Successful practices in weigh‐in‐motion data quality with wim guidebook.
- Güner AR, Murat A, Chinnam RB (2012) Dynamic routing under recurrent and non-recurrent congestion using real-time ITS information. Computers and Operations Research 39(2): 358–373.
- Morgul EF, Yang H, Kurkcu A, Ozbay K, Bartin B, et al. (2014) Virtual sensors: Web-based real-time data collection methodology for transportation operation performance analysis. Transportation Research Record 2442(1): 106-116.
- Aleksandr N, Vladimir Z, Anastasiya F (2018) Dynamic traffic re-routing as a method of reducing the congestion level of road network elements. Journal of Applied Engineering Science 16(1): 70–74.
- Antoniou C, Koutsopoulos HN, Ben AM, Chauhan AS (2011) Evaluation of diversion strategies using dynamic traffic assignment. Transportation Planning and Technology 34(3): 199–216.
- Aved A, Do T, Hamza LG, Hua HA, Hoang L, et al. (2007) A real-Time route diversion management system. ITSC 1131-1136.
- Backfrieder C, Ostermayer G, Mecklenbräuker CF (2014) TraffSim-A traffic simulator for investigations of congestion minimization through dynamic vehicle rerouting. International Journal of Simulation Systems, Science & Technology 15(4): 38-47.
- Braekers K, Ramaekers K, Van Nieuwenhuyse I (2016) The vehicle routing problem: State of the art classification and review. Computers & Industrial Engineering 99: 300-313.
- Juan PS, Sandu P, Borcea C, Juan S, Pan J (2017) DIVERT: A distributed vehicular traffic re-routing system for congestion avoidance. IEEE Transactions on Mobile Computing 16(1): 58-72.
- Li X, Khattak AJ (2018) Large-scale incident-induced congestion: En-route diversions of commercial and non-commercial traffic under connected and automated vehicles. Proceedings of the 2018 Winter Simulation Conference 1132-1143.
- Luo L, Ge YE, Zhang F, Ban X (2016) Real-time route diversion control in a model predictive control framework with multiple objectives: Traffic efficiency, emission reduction and fuel economy. Transportation Research Part D: Transport and Environment 48: 332-356.
- Wang Y, Szeto WY, Han K, Friesz TL (2018) Dynamic traffic assignment: A review of the methodological advances for environmentally sustainable road transportation applications. Transportation Research Part B: Methodological 111: 370-394.
© 2025 Amr A Oloufa. This is an open access article distributed under the terms of the Creative Commons Attribution License , which permits unrestricted use, distribution, and build upon your work non-commercially.
 a Creative Commons Attribution 4.0 International License. Based on a work at www.crimsonpublishers.com.
Best viewed in


.jpg)


 Editorial Board Registrations
 Submit your Article
 Refer a Friend
 Advertise With Us
.jpg)


.jpg)


.bmp)
.jpg)
.png)
.jpg)


.jpg)


.png)

.png)


.png)


