
- About Us
- Information
-

The Author ensures that the research has been conducted responsibly and ethically with adherence to all relevant regulations. read more..
- For Authors
- For Reviewer
- Manuscript Guidelines
- Membership
- Publication Ethics
-
- Journals
- Reprints
- e-Books
- Videos
- Policies
- Contact Us
 COVID-19
- Submissions


Full Text
COJ Technical & Scientific Research
Plankton Response in a Disturbed Wetland in Eagle Island Creek, Port Harcourt, Rivers State, Nigeria
Faith Isobo, Aduabobo I Hart and Aroloye O Numbere*
Department of Animal and Environmental Biology, University of Port Harcourt, Nigeria
*Corresponding author:Aroloye O Numbere, Department of Animal and Environmental Biology, University of Port Harcourt, PMB 5323, Choba, Nigeria
Submission: November 20, 2024:Published: December 03, 2024

Volume5 Issue2December 03, 2024
Abstract
The population of plankton in a disturbed wetland in Eagle Island, Niger Delta was carried out between April to September, 2023. Water samples were collected using a sample bottle and transported to the laboratory for analysis. Plankton samples were collected using a plankton net of mesh size 50μm. Nutrients and physico-chemical parameters were analyzed according to APHA 1998 standard. The results of water quality parameters include pH 7.59±0.015-11.72±.027, Temperature 28.37±0.03ºC-31.67±0.11oC, DO 4.53±.067mg/L-4.83±0.26mg/L, Conductivity 3291.00±1073.13μs/cm-14637.00±45.67μs/cm, Salinity 0.69±0.01%-1.01±0.00%, TDS 511.33±3.72mg/l-10246.00±32.01mg/l, Phosphate 0.15±0.02mg/l- 1.03±0.02mg/l, Sulphate 87.33±1.67mg/L-111.33±1.50mg/L, Nitrate 0.10±0.00mg/L-8.47±0.01mg/L. Mean values of the physico-chemical parameters except dissolved oxygen were not significantly different (p>0.05). In all, 427 phytoplankton from 44 taxa, were collected. Bacilliarophyceae dominated (51%) while Chrysophyceae had the least dominance (2%). Shannon Weiner index across the stations was highest in station 1 (3.302) and lowest in station 3 (2.35) in a trend of 3>2>1. A total of 199 zooplankton from 8 taxa were collected. Copepoda dominated (51%) followed by Cladocera (20%) and Nematoda (3%). Shannon Weiner index across the stations was highest in station 1 (3.304) and lowest in station 3 (3.153) in a trend of 3>2>1. Dissolved oxygen and temperature were within the WHO/FMEnv standards and can therefore support life. pH, E.C and TDS were above the regulatory limit. Generally, a fair diversity and composition was observed in the plankton.
Introduction
Plankton are free living, weakly swimming or floating organism and phyto means plant. However, phytoplankton are different than plants, they do not have root leaves and stem structures. Phytoplankton also comprises both prokaryotic and eukaryotic organisms. Moreover, they are physiologically diverse group. Although phytoplankton are mainly autotroph (producer), it also includes heterotrophic (consumer) and mixotrophic (capable of both autotrophic and heterotrophic) organisms. Phytoplankton species can also be categorized as planktonic and substrate associated according to their habitat preference. While planktonic species float in water column, substrate associated ones can attach to plants, stones or can live in benthic fauna and are referred to be benthic phytoplankton [1]. As they are mainly photosynthetic organisms, they need sun light to survive thus they can only survive in euphotic zone, which includes the depth of water column that is exposed to more than 1% of the incoming light and usually it can be 2.5 times Secchi disc depth. Phytoplankton are plant– like microscopic floating organisms in any water body, they play very important role in the aquatic ecosystem as primary producers and consist mainly of diatoms and dinoflagellates, and are also called algae. Phytoplankton size is considered to be one of the most important functional traits influencing various biological and ecological processes [2,3].
Cell size affects nutrient uptake, i.e., smaller cells have an advantage over larger cells for nutrient acquisition in nutrient-depleted environments as a consequence of their higher surface-area-to-volume ratio [4]. Sinking and grazing rates are also size-dependent as larger cells sink more efficiently and faster [5] than smaller phytoplankton cells. It has been argued that larger phytoplankton cells can escape grazing more easily than smaller cells due to the different generation times of their main predators, metazoans and protists, respectively [2,3]. Therefore, the size structure of the phytoplankton community is a critical issue to foresee future carbon cycling and trophic regimes, since it determines the carbon fate in the ecosystem toward higher trophic levels, export to the deep ocean or remineralization within the photic zone [6]. Zooplankton are microscopic animals living near to the surface of the water body. They are poor swimmers, relying on tides and currents as their transport mechanism. They feed upon phytoplankton, bacterioplankton, or detritus. Zooplankton constitute a vital food source for fish. They also play an important role as bio indicators and help to evaluate the level of water pollution. In freshwater communities, along with fish, they are the main food supplements to many other marine species. They are assumed to be a vital part in indicating water quality, eutrophication, and production of a freshwater body. In order to determine the status of a freshwater body it is necessary to measure seasonal variations and presence of zooplankton [7]. Varieties of species, biomass diversity and wealth of zooplankton groups can be utilized to determine the strength of a biological system. The potential of zooplankton as a bioindicator species is high on the grounds that their development and conveyance are subject to some abiotic (e.g. temperature, saltiness, stratification, and pollutants) and biotic parameters (e.g. limitation of food, predation, and competition. Naturally occurring bioindicators are used to assess the health of the environment and are also an important tool for detecting changes in the environment, either positive or negative, and their subsequent effects on human society. There are certain factors which govern the presence of bio indicators in the environment such as transmission of light, water, temperature, and suspended solids. Through the application of bio indicators, we can predict the natural state of a certain region or the level/degree of contamination. Many factors have been reported to affect the diversity and abundance of phytoplankton in aquatic environments. These are mainly affected by physical, chemical and biological factors. Among the most frequently discussed factors are light availability, temperature, tidal flushing, grazing, acidification, water pollution, eutrophication [8]. Pollution in aquatic ecosystem by various pollutants is a major subject of attention around the world as well as the subject matter area of major world’s fresh water resources [9]. The aquatic organisms become the sensitive area to water pollution. These organisms often act as bio-indicators for water. Bio-indicator is defined as an organism, or chemical markers of biological processes that are observable changes in its value as an indicator of changes in the environment and can also identify and quantify the impact of a pollutant in the environment [10]. Wetlands are among the most productive ecosystems in the world, comparable to rain forests and coral reefs. They also are a source of substantial biodiversity in supporting numerous species from all of the major groups of organisms-from microbes to mammals. Physical and chemical features such as climate, topography (landscape shape), geology, nutrients, and hydrology (the quantity and movement of water) help to determine the plants and animals that inhabit various wetlands. Wetlands can be thought of as biological supermarkets. They produce great quantities of food that attract many animal species [11].
Researches have been carried on the relationship between water quality and land use type and have established that there is a relationship between the two [12]. It has been observed that land use greatly impacts the water quality of water systems and it is related to human activities. Conversion of land pattern from one use to another is regarded as the major factor in transforming surface runoff and water quality [11]. Zamani [13] assessed landuse change and its impacts on surface water quality in the Ziarat Catchment in Iran. Results showed that about 980ha of forests were converted to other classes of land use such as croplands, residential areas and roads. The results of this research suggest that land-use change is one of the key factors causing water quality changes in the study area. Water Quality Index is a form of average derived by relating a group of variables to a common scale and combining them into a single number. A WQI summarizes information by combining several sub-indices of constituents (quality variables) into a univariate expression. The group should contain the most significant parameters of the dataset, so that the index can describe the overall position and reflect change in a representative manner [14].
The objectives of the study were to:
a) Assess the physico-chemical parameters of the study area.
b) Determine the water quality of the study area
c) Determine the composition and diversity of phytoplankton
and zooplankton in the study area.
d) Determine the nutrient level in the study area.
e) Determine the relationship between nutrient levels and
plankton abundance and distribution in the study area.
Materials and Methods
Description of study area
Eagle Island Creek lies along Latitude N 4o 47’13.03’’ and Longitude E 7o 0’0’’-7o05’30.0’’. It is accessible by road and water through the Eagle Island Road and Iwofe River respectively, which are both adjourning locations to Port Harcourt metropolis. The vegetation is dominated by Nypa palm (Nypa fructicans), red mangrove (Rhizophora racemosa) and white mangrove (Avicennia germinans). The major anthropogenic activities going on within and around the Eagle Island Creek include dredging activities, local boat water transportation through the use of outboard engine and in-board wooden boats, disposal of organic and inorganic wastes, including human faeces, saw milling. The abattoir activities located along the shore of the creek include slaughtering of various kinds of goats and cows mainly, removal of the hide, intestine management, rendering, trimming, processing and cleaning activities. The wastes generated from abattoirs usually comprise of blood, oil, mineral and organic solids, salts and chemicals added during handling operations etc. The creek is also a receptacle for effluent discharges from adjourning companies such as Nigeria Agip Oil Company (NAOC) and numerous residential estates, schools and other small-scale businesses. Three sampling stations were chosen representing different anthropogenic activities that are likely to affect water quality and phytoplankton diversity.
Plankton sampling
Plankton samples were collected by filtration with the aid of plankton net, which was followed by rinsing the plankton net of 50μm mesh size by pouring about 10 liters of water fetched from the flowing stream site into the plankton net. Filtrates were collected from the cod-end of the plankton net and were emptied into clean plastic sample bottles and were fixed with 4% formaldehyde. Plastic sample bottles were labelled with descriptions such as station number, date and time, sample number and fixative. Sampling was carried out monthly from May 2023 to October 2023 covering a period of six months.
Identification of plankton
Plankton samples were identified in the laboratory which was carried out by shaking the sample enclosed in the sampling bottle. A standard pipette was used to collect sample from the sampling bottle, and a drop was released on a clean micro slide. The slide was carefully covered with a cover slip, then mounted on the stage of a light microscope, with magnification at ×10 and ×40. The plankton samples were identified according to their taxonomic classification with the aid of Taxonomic keys [15].
Physico-chemical analysis
Temperature: The water temperature was measured in-situ at a depth of 15cm below water surface using Gon DO, a multiple parameter digital kit (TS: 406 model). The sensitive part of the thermometer was immersed directly into the water and allowed to stabilize. At stability, the temperature value was read. Three readings were taken and the mean values of the three were calculated and recorded as the surface water temperature for the station [16]. The same was repeated in all the sampling stations.
pH: The water for hydrogen ion concentration pH was also measured in-situ at a depth of 15cm below water surface using a multiple-parameter Gon DO water checker (Model DO: 7000). The instrument was first calibrated with the standard Horiba solution. The measurement for pH was done as soon as possible by dipping the probe into the water sample. The switch button was put on while the arrow key was moved to pH command displaying the values. After the value stabilized, the reading was taken. This was repeated for three times and the average value was recorded [16]. The same was also done for all sampling stations.
Electrical conductivity (μS/cm): The electrical conductivity of the sample at the stations was also measured in-situ at a depth of 15cm below water surface using the same Gon DO multi-parameter equipment. The same procedure was adopted as in pH but the arrow key was positioned on electrical conductivity parameter. When the instrument’s stabilization was completed, the value was taken and recorded after the calculation of the mean value was recorded [16].
Total Dissolved Solids (TDS): Total dissolved solids were measured in-situ at a depth of 15cm below water surface also with Gon DO Multi-parameter digital meter. The procedure was similar to those of the above parameters but the difference was that the cursor was moved to dissolve solid parameter. At the stability of the instrument, values were taken repeatedly for three times. Only the calculated value was recorded [16].
Dissolved Oxygen (DO): Surface water samples for the measurement of Dissolved Oxygen (DO) was collected at a depth of 15cm below water surface and determined according to the Modified Azide or Winkler’s method [16]. A well labeled clean 70ml DO bottle initially rinsed with water sample from the station was dipped below the water surface and allowed to fill to overflow in order to remove every trapped air bubbles in the bottle filled with the sample, 0.5ml manganous sulfate (Winkler-I) solution was fixed, followed by 0.5ml alkali-iodide reagent (Winkler-II) was added, a stopper was placed in order to remove air bubbles from the sample and mixed properly with several inversions. In the laboratory, the DO sample previously treated with Winkler I and II was added 0.5ml concentrated sulphuric acid (H2SO4), it was stopper and mixed properly for complete dissolution of precipitate. A volume of 25ml portion of the sample was placed in an Erlenmeyer flask, few drops of freshly prepared starch solution were added and titrated with 0.025 N Na2S2O3 (sodium thio-sulphate) solution. The titration was continued to the first disappearance of the blue color from blue black to colorless, and end point recorded [16].
Biochemical Oxygen Demand (BOD): Water samples were collected in the same way as the DO and was incubated at 20°C for five days. At the end of the incubation period the samples were treated in the same manner as the DO samples stated above to determine the dissolved oxygen. To ensure presence of oxygen the BOD samples were diluted before incubation and the DO of the dilution water determined. DO at day 5 was determined as in dissolved oxygen above and the BOD calculated using the following: (A-B)xDF. Where: A is Initial DO of dilution water, B is DO after 5-day incubation and DF is dilution factor of sample to dilution water
Phosphate: Phosphate was determined using the stannous chloride method [16]. A volume of 50ml sample was added with mixing 2.0ml ammonium molybdate reagent and 0.2ml stannous chloride reagent. After 10 minutes but before 12 minutes from addition of stannous chloride, the absorption of the treated sample was read on Spectronic 21D at 690nm. Phosphate level was obtained by reading off absorption level from standards curve of known standards treated as the samples. The detection limit is 0.05mg/l.
Diversity formulas: Three ecological statistics were used in
this study to ascertain the diversity indices:
a) Margalef Index(d): This index measures species richness of an
area and is expressed as: Margalef (1958)
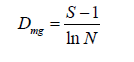
where S=number of species, N=number of individuals.
b) Shannon-Wiener diversity index (H’): This index measures plankton diversity and gives the degree of uncertainty involved in predicting the species identified from randomly selected individuals. It is calculated using the following equation as given by Magurran: Shannon-Wiener Index
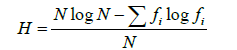
Where H=index of species diversity/degree of uncertainty, N = total number of individuals, f1 = proportion of total sample belonging to ith species
c) Taxa richness: The maximum possible diversity for a given set of data consisting of K category is given as

Where K=number of categories
d) The Evenness or Homogeneity, Expressed as equitability index, E

Evenness/Equitability Index (E)=These measures how evenly distributed species are in an area and is expressed as:

Where: H=Shannon Wienner Index, InS=natural log of number of species of zooplankton in the sample
Statistical analysis
Data on water quality parameters were subjected to one-way Analysis of Variance (ANOVA) at probability level of p<0.05 to determine mean differences using IBM SPSS, version 25 (SPSS Inc., USA). Microsoft Excel 2016 was employed for graphical illustrations of plankton abundance and composition across the sites. The community structure (Margalef’s species diversity, Shannon- Wiener’s index and species evenness) was calculated using PAST software version 3.2 (Hammer, Oslo, Norway).
Results
Physico-chemical parameters
The mean results of the physico-chemical parameters of Eagle Island Creek are presented in Table 1.
Table 1:Mean concentration of physico-chemical parameters across stations.

Figure 1:pH concentrations of eagle island creek.

pH
During the study period, the mean pH across the stations ranged from 9.56±0.42 in station 3 to 9.76±0.81 in station 1. Across the months, April had the least concentration with 7.59±0.015while September was highest with 11.72±.027as shown in Table 1 and Figure 1. A One-Way Analysis of Variance (ANOVA) showed that the difference in mean pH between stations and months were not significant at (p>0.05).
Dissolved Oxygen (DO)
The mean dissolved oxygen across the stations was lowest in station 2 with 4.72±0.16mg/L and highest in station 1 with 5.28±0.25mg/L (Table 1) and (Figure 2). Across the months, the month of August recorded the least Dissolved Oxygen concentration 4.53±.067mg/L while the month of April recorded the highest with 4.83±0.26mg/L. Statistical Analysis of Variance (ANOVA) result revealed that there was no significant difference in the mean dissolved oxygen at (P< 0.05) across the stations.
Figure 2:Dissolved oxygen (mg/l) concentrations of eagle island creek.

Electrical conductivity(μs/cm)
Electrical conductivity observed across the stations and months revealed that there was no much variation throughout the period sampled as presented in Table 1 and Figure 3. The Table 1 shows that the variation in conductivity values ranges from 8486.67±1490μs/ cm in Station 2 to8551.83±2587μs/cm in Station 1. The maximum mean value of 14637.00±45.67μs/cm was recorded in the month of July, while the minimum value of 3291.00±1073.13μs/cm was recorded in the month of April. One way analysis of variance revealed that conductivity is not significantly different (p>0.05) across the various stations.
Figure 3:Electrical conductivity.

Temperature (ºC)
The mean monthly surface water temperature ranged from 30.13±0.36ºC in station 2-30.47±0.34 ºC in Station 3. Across the months, the highest mean temperature (31.67±0.11 0C) was recorded in the month of May, while the lowest mean temperature was observed in September (28.37±0.03ºC) as shown in Table 1 and Figure 4. An Analysis of Variance (ANOVA) showed that there was no significant difference across months and stations in temperature (p>0.05).
Figure 4:Temperature (oC) at eagle island creek.

Total Dissolved Solids (TDS)
Total dissolved solids TDS concentration collected across the stations and the months revealed that there were variations throughout the period sampled as presented in Table 1 and Figure 5. The Table 1 showed that variations in TDS values ranged from 5434.03±851.98 mg/L in station 3-5681.43±1885.96mg/L in station 1. The lowest value across the months was recorded in September (511.33±3.72 mg/l) and was highest in the month of July (10246.00±32.01mg/l). One way Analysis of Variance revealed that TDS is not significantly different (p>0.05).
Figure 5:Total dissolved Solids (mg/l) concentrations of eagle island creek.

Salinity (ppt)
Salinity recorded across the stations and months showed slight variations throughout the study period as presented in Table 1 and Figure 6. The Tables shows that variations in salinity values ranged from 0.79±0.03ppt in station 3-0.80±0.05ppt in station 1. Monthly variation in salinity was highest in the month of April (1.01±0.00 ppt) while the minimum value 0.69±0.01 ppt was recorded in July. One way Analysis of Variance revealed that salinity in the various stations of the month sampled were not significantly different (p>0.05).
Figure 6:Salinity concentrations (ppt) of eagle island creek.

Phosphate (mg/l)
Across the stations, the concentration of Phosphate ranged from 0.775±0.127mg/L to 0.925±0.306mg/L in Stations 3 and 1. These are presented in Table 1. Across the months, Phosphate ranged from 0.15±0.02 mg/L to 1.03±0.02 mg/L in April and July as presented in Figure 7. There was no significant difference in the spatial variation of phosphate in the study area (p>0.05).
Figure 7:Phosphate (mg/l) concentration at eagle island creek.

Sulphate
The concentration of Sulphate across the stations ranged from 93.000±2.521mg/L in station 3 to 107.667±4.821mg/L in station 1 as presented in Table 1. Across the months, Sulphate ranged from 87.33±1.67mg/L to 111.33±1.50mg/L in April and July as presented in Figure 8. A One-Way Analysis of Variance (ANOVA) revealed that there was significant difference in the concentration of sulphate across the stations (p<0.05).
Figure 8:Sulphate (mg/l) concentration at eagle island creek.

Nitrates (mg/l)
The mean concentration of nitrates across the stations ranged from 3.067±0.716mg/L to 4.454±1.785mg/L in Stations 3 and 1. These are presented in Table 1. Across the months, the concentration of Nitrates (NO2) ranged from 0.10±0.00 mg/L in the month of May to 8.47±0.01mg/L in July as presented in Table 1 and Figure 9. There was no significant difference in the spatial variation of nitrates in the study area (p>0.05). Plankton in the creek
Figure 9:Nitrate (mg/l) concentration at eagle island creek.

Plankton in the creek
Phytoplankton: The phytoplankton recorded during the study are presented in Table 2 and Figure 10. The results revealed a total of four hundred and twenty-seven (427) across the study area, and a total of two hundred and twenty-three (223) in station 1, One hundred and forty-one (141) in station 2 and ninety-eight (98) in station 3 belonging to seven (7) taxonomic groups. The diatoms (Bacillariophyceae) were the most dominant with 51%, followed by Cyanophyceae with 21% and Chlorophyceae (20%), while the least dominant groups are Xanthophyceae and Euglenophyceae with 3% each, Pyrrophyceae (2%) and Chrysophyceae (0%) as presented in Figure 10. A total of forty-four (44) species from 7 taxonomic groups were observed. Bacillariophyceae had the highest number (17) followed by the Chlorophyceae (10), Cyanophyceae (8). The least number was from Pyrrophyceae was represented by 1 species. In terms of station abundance, Bacillariophyceae were 87 for station 1, 92 for station 2, 57 for station 3 making a total of 236 individuals of diatoms. This was followed by Cyanophyceae with 96 individuals consisting of 60 for station 1, 21 for station 2 and 15 for station 3, while Chlorophyceae was made up of 57 for station 1, 19 for station 2 and 19 for station 3 making a total of 95 individuals. Other phytoplankton taxa included Euglenophyceae which had 9 in station 1, 3 in station 2 and 1in station 3. Xanthophyceae had 4 in station 1, 4 in station 2 and 4 in station 3, Pyrrophycea had 5 in station 1, 2 in station 2 and 1 in station 3 and Chrysophyceae with only 2 individuals in stations 1 and 3. The diversity indices of phytoplankton showed that Shannon-Wiener diversity ranged between 3.153 in station 3 to 3.304 in station 1, having a stationby- station trend of Station 3>2>1. Margalef’s species richness varied between 6.668 in station 2 to 7.583 in station 1. Simpson’s Dominance (D) was between 0.944 in station 2 and 0.947 in stations 1 and 3, Evenness ranged between 0.648 in station 1 to 0.731 in station 3 (Table 3).
Figure 10:Percentage abundance of phytoplankton groups.

Table 2:Checklist of phytoplankton across the study area.

Table 3:Diversity index of phytoplankton in the study area.

Zooplankton: The results for zooplankton recorded during the study are presented in Table 4. The results revealed a total of one hundred and ninety-nine zooplankton belonging to 8 taxonomic groups which are Copepoda 111 (51%), Rotifera 11 (5%), Cladocera 20 (10%), Protozoa 20 (10%), Insecta 6 (3%), Decapoda 25 (13%) and Nematoda 6 (3%) (Table 4) and (Figure 11). The abundance of zooplankton obtained at each station during the study period were one hundred and thirteen (113) in station 1, fifty-four (54) in station 2 and thirty-two (32) in station 3 belonging to groups (8) and 36 species. Copepoda showed the highest abundance at all sampling stations compared to other groups. The highest abundance of Copepoda occurred in station 1 and the least abundance of Copepoda occurred in station 3. Some identified species of copepod included Canthocaptus typreus, C. staphylinus, Cyclops strenunous, Macrocyclops distintus, Nitrocra lacustris, Nuphius diaptomus, Paracyclops fimbriatus, Ctenocalanus vanus, Harpacticoida sp, Actodiaptomus, Mesochra boeck. The Cladocerans observed were Hyocryptus sordidus, Colurella obtuse, Moinodapnia bidentata, Diaphanosoma aspinosoma, Diaphnia magna. Rotifera species include Asplancha girodi, Monostylah amata, Brachionus angularis, B. urceus, Diurella porcellus (Table 4). The diversity indices of zooplankton in the study area showed that Shannon-Wiener diversity ranged between 2.35 in station 3 to 3.302 in station 1, having a station-by-station trend of Station 3>2 >1. Margalef’s species richness varied between 4.040 in station 3 to 7.404 in station 1(Figure 12). Simpson’s Dominance (D) was between 0.869 in station 3 and 0.950 in station 1, Evenness ranged between 0.699 in station 3 to 0.755 in station 1 (Table 5).
Table 4:Checklist of zooplankton across the study area.

Figure 11:Percentage abundance of zooplankton taxa.

Figure 12:Common phytoplankton and zooplankton species at eagle island:
a) Polychaete larva
b) Herpaticoida
c) Ulothrix sp
d) Spirogyra sp
e) Navicula sp

Table 5:Diversity index of zooplankton in the study area.

Discussion
Physico-chemical Parameters
The physico-chemical conditions of a water body are very important in assessing the composition of any aquatic biota and also their sensitivity to pollution [17]. The mean concentration of pH (9.56±0.42-9.76±0.81) across the stations in this study were alkaline and higher than the WHO/FMEnv permissible limits of 6.5-8.5 for surface water. These results are higher than the 5.5- 7.8 reported by Zabbey and Hart [18] in Woji Creek, 6.07±0.54 by Davies in the Upper Reaches of Orashi River, Nigeria and 6.72 and 6.37 by Dienye and Woke [19] in the upper and lower reaches of the New Calabar River. The obvious alkalinity observed in this research may be due to the impact of dry season on the ambience of the river. It may also be due to the reduced rainfall in the dry season during which the research was conducted, thus also a reduced flow of acid sulphate from the soil into the river. The pH of an aquatic system is an indicator of the water quality and the extent of pollution in the water shed. The alkalinity of pH during this study may be due to the influx of abattoir wastes and other human activities around the area. Change in pH may hold dire consequences for the health of aquatic organisms since most of their metabolic activities are pH dependent [20]. The temperature ranged from 30.13±0.36oC to 30.47±0.34oC is in agreement with other works in the Niger Delta by Chindah [21] who reported temperature range between 26°C and 30.5°C, Zabbey and Hart [18] recorded between 26.3°C and 30.4°C, [22] reported a range between 26.64oC and 30.83oC and 25.9ºC and 32.4ºC by Ansa [23]. It also aligns with the earlier reports on works in the Niger Delta water by Abowei [24] who reported temperature range of between 27oC-31oC.This result is slightly higher than the results of Ogolo at the Iwofe and Buguma tributaries of New Calabar river who documented 27.7oC to 29.9oC. The temperature observed in the present study was high which may be due to influx of organic materials, industrial effluents, debris, and municipal waste into the river from nearby communities. Also, the study area has also been excluded from tidal renewal from lowing tide from the sea. The effects of water temperature on plankton have been examined in many aquatic ecosystems and it was found that water temperature strongly regulates the seasonal variation of phytoplankton [25]. Also, solubility of oxygen is influenced by basically water temperature. In Eagle Island Creek the temperature across the stations showed no significant difference and was within the WHO standard. The similar water temperatures across the three sampling stations are a reflection of the prevailing weather conditions. This function as a regulator of physiological and ecological parameters of aquatic life.
The concentration of Dissolved Oxygen (DO) in aquatic systems depend on the physical, chemical and biochemical activities in the water body. DO values (4.72±0.16-5.28±0.25mg/l) recorded in this study is within the WHO limit of >4.0mg/l. Dissolved Oxygen is very vital for aquatic life’s survival and it is also used to evaluate the degree of freshness of a river. A DO level as low as between 1-5mg/l will slow down the growth of fishes when continuously exposed, while levels below 1mg/l are reported to be lethal to aquatic lives [20]. Nitrate was quite high and ranged between 0.89±0.00mg/l to 8.47±0.01mg/l. Sulphate ranged between 87.33±1.67mg/l to 111.33±1.50mg/l. These high nutrients may not be far-fetched from the anthropogenic inputs from the nearby areas of the creek particularly those of abattoir wastes and municipal substances from nearby arable land. This result is slightly higher than the reports of Daka and Moslen [26] who reported that nitrate and sulphates normally give an indication of the nutrient level in the study area and could be of domestic waste sources from human settlements near these stations also surface run-offs into the creek could be responsible for the significantly high nutrient level recorded at these stations of Eagle Island Creek. The conductivity values recorded in this study ranged between 3291.00±1073.13μS/ cm to 14637.00±45.67μS/cm. This high conductivity may be due to the influx of materials rich in ionic radicals into the river. This was beyond WHO [27] permissibility limit. The conductivity levels observed in this study is in agreement with the conductivity variation recorded in Ekerekana creek. However, Chindah [21] attributed higher values of conductivity to high precipitation and evaporation rate. The Total Dissolved Solids (TDS) values recorded in this study ranged from 511.33±3.72mg/L to 10246.00±32.01mg/L. It was higher than WHO [27] acceptable range. This can be as a result of the influx of organic matter, debris and other materials that eventually dissolved in the water thereby increasing the total dissolved solids in the rivers investigated. This high TDS observed may be attributed to the turbulence stemming from the impacts of anthropogenic activities such as dredging activity, and also wave currents which disturb the organisms.
Phytoplankton and zooplankton species
The plankton of an aquatic environment is essential to its sustenance. While they constitute the preliminary point of energy transfer, they are very sensitive to externally imposed changes in the environment. A total of 462 phytoplankton and 199 zooplankton individuals were observed from 9 families, 28 Genera and 34 species. The family Bacillariophyceae (diatom) was the most abundant phytoplankton group. Previous research has shown the abundance of Bacillariophyceae in open waters. The population of phytoplankton is influenced by water temperature, velocity of current, availability of nutrient and light penetration into the water. The dominance of Bacillariophyceae in this study is an expected occurrence. Eight zooplankton groups comprising of 36 species were identified in this study. This result was similar on species that was reported by Zabbey [28]. The uniqueness observed in numerical values of zooplankton species in this study and previous studied was linked to either natural conditions of water bodies, time of sampling or rate of pollution in studied ecosystem. FAO (2000) had earlier reported distributions of zooplankton vary from place to place and year to year due to the dynamic nature of aquatic systems. The type of zooplankton, its numerical value, its distribution in an aquatic environment provides hints on persistent chemical and physical conditions of that specific habitat. Hence, the association among different environmental indices was either be good for growth or death of zooplankton, both in space and time. Zooplankton was underlined as bio-indicators of aquatic environmental perturbation that might be of their easy identification during period of high density and high sensitivity to aquatic environmental change compared to other aquatic fauna [29]. Copepoda was dominant species across all stations and sampling period with about 83% contribution. Simpson’s index for both phytoplankton and zooplankton were highest in stations 1 and lowest in station 3. Similarly, the Shannon Weiner diversity index of 3.153 and 3.304 in stations 3 and station 1 for phytoplankton, 2.35 in station 3 to 3.302 in station 1 for zooplankton and was higher than those of Onuoha [29] who reported the Shannon Weiner diversity index of the Bonny estuary to range from 2.00-2.86, this he attributed to oil pollution. The Margalef diversity indices of phytoplankton and zooplankton showed that the stations were ecologically diverse. The Margalef index for phytoplankton was lowest in station 2 (6.668) and highest in station 1 (7.583), while in zooplankton, the Margalef’s index was lowest in station 3 and highest in station 1. Margalef (1958) indicated that stations with higher diversity index were more stable or expressing less stress than stations with lower values. Margalef index of more than 3 usually depicts good diversity [30,31].
Conclusion
The results of physico-chemical parameter like dissolved oxygen and temperature are within the WHO/FMEnv standards and can therefore support life. However, the results of pH, electrical conductivity, dissolved oxygen and total dissolved solids in the study area were above the suitable range for aquatic organisms and drinking water. Variation in water quality parameters, plankton densities and compositions in the Eagle Island Creek have been influenced by natural phenomena and human activities. Generally, a fair diversity and composition was observed in the plankton. This can be as a result of other environmental impacts aside physico-chemical parameters. This study provides a fundamental knowledge of the variation in the density of the major plankton groups, community structure and their relationship with associated water characteristics in the Eagle Island Creek. Understanding such variation provides a basis for further study of the distribution and density of upper aquatic predators, fish and other aquatic organisms.
Recommendations
Based on the results of this study, it is therefore recommended
that:
a) Anthropogenic activities should be minimized around Eagle
Island Creek so as to reduce its effect on aquatic biota.
b) There should be a continuous monitoring of the Eagle Island
Creek so as observe any changes.
c) Research in other aspects of quality evaluations such
as microbial quality evaluation among others is highly
recommended.
d) Government should evaluate and monitor the ways by which
most of the abattoir and other human activities disposes their
waste in the marine environment.
e) Government at each level (Federal, State and Local) should
carry out regular environmental monitoring to ascertain the
water quality per time.
References
- Bellinger EG, Sigee DC (2010) Freshwater algae identification and use as bioindicators. Wiley Blackwell.
- Maranon E (2015) Cell size as a key determinant of phytoplankton metabolism and community structure. Annual Review of Marine Science 7: 241 264.
- Acevedo TE, Maranon E, Merico A (2018) Phytoplankton size diversity and ecosystem function relationships across oceanic regions. Proceedings of Royal Society B: Biological Sciences 285(1879): 20180621.
- Maranon E, Cermeno P, Latasa M, Tadonleke RD (2012) Temperature, resources, and phytoplankton size structure in the ocean. Limnology and Oceanography 57(5): 1266 1278.
- Behrenfeld MJ, O Malley RT, Boss ES, Westberry TK, Graff JR, et al. (2015) Revaluating ocean warming impacts on global phytoplankton. National Climate Change 6: 323 330.
- Zannatul F, Muktadir AKM (2009) A review: Potentiality of zooplankton as bioindicator. Am J Appl Sci 6(10): 1815 1819.
- Philip EJ, Badylak S, Grosskopf T (2001) Factors affecting the abundance of phytoplankton in a subtropical lagoon, the Indian tropical lagoon, Florida, USA. Estuarine, Coastal and Shelf Science 55: 385 402.
- Vorosmarty CJ, Mc Intyre PB, Gessner MO, Dudgeon D, Prusevich A, et al. (2010) Global threats to human water security and river biodiversity. Nature 467: 555 561.
- Huang J, Zhan J, Yan H, Wu F, Deng X (2013) Evaluation of the impacts of land use on water quality: A case study in the chaohu lake basin. Scientific World Journal.
- Igbinosa EO, Uyi OO, Odjadjare EE, Ajuzie CU, Orhue PO, et al. (2010) Exploring biodiversity as bioindicators for water pollution. national conference on biodiversity, development and poverty alleviation. Uttar Pradesh State Biodiversity Board.
- Ding J, Jiang Y, Fu L, Liu Q, Peng Q, et al. (2015) Impacts of land use on surface water quality in a subtropical river basin: A case study of the dongjiang river basin, southeastern China. Water 7: 4427 4445.
- Zamani M, Sadoddin A, Garizi AZ (2012) Assessing land cover / land use change and its impacts on surface water quality in the Ziarat catchment, IRAN. 2012 International Congress on Environmental Modelling and Software Managing Resources of a Limited Planet.
- Ekong F, Jacob A, Ebong S (2012) Water resource management in the niger delta region of Nigeria: The role of physical planning. International Household Survey Network 3(1): 51.
- Verlencar XN, Dhargalkar VK, Ingole BS, Kavlekar D (2004) Phytoplankton identification manual. National Institute of Oceanography.
- APHA (1998) American public health association, standard methods for the examination of water and wastewater. Washington DC.
- Arimoro FO, Iwegbue CM, Osiobe O (2008) Effect of industrial waste water on the physical and chemical characteristics of warri river, a coastal water body in the niger delta, Nigeria. Research Journal of Environ. Science 2(3): 209 220.
- Zabbey N, Hart AI (2005) Influence of some physico chemical parameters on the composition and distribution of benthic fauna in Woji creek, Niger Delta, Nigeria. Global J Pure Appl Sci 2(1): 1 15.
- Dienye HE, Woke GN (2015) Physico chemical parameters of the upper and lower reach of the new calabar river niger delta. Journal of Fisheries and livestock production 3(154): 2.
- Okorafor KA, Effanga EO, Andem AB, George UU, Amos DI (2013) Spatial variation in physical and chemical parameters and macro invertebrates in the intertidal regions of calabar river, Nigeria. Greener Journal of Geology and Earth Sciences 1(2): 63 72
- Chindah AC (2003) The physicochemical, phytoplankton and periphyton of swamp forest community of swamp forest stream in the lower niger delta. Journal of Science Africa 1(2): 1 4.
- Braide SA, Izonfuo WAL, Adukwu PU, Chindah AC, Obinwo CC (2004) Water quality of miniweja stream, a swamp forest stream receiving non-point source waste discharge in eastern niger delta, Nigeria. Scientia Africana 3(1): 1 8.
- Ansa EJ, Sikoki FD, Francis A, Allison ME (2007) Seasonal variation in interstitial fluid quality of the Andoni flats, niger delta Nigeria. J Appl Sci Environ Manage 11(2): 123 127.
- Abowei JFN (2010) Salinity, dissolved oxygen, pH and surface water temperature conditions in nkoro river, niger delta, Nigeria. Advanced Journal of Food Science and Technology 2(1): 16 21.
- Richardson TL, Gibson CE, Heaney SI (2000) Temperature, growth and seasonal succession of phytoplankton in lake baikal, Siberia. Freshwater Biol 44: 431 440.
- Daka ER, Moslen M (2013) Spatial and temporal variation of physico chemical parameters of sediment from azuabie creek of the upper bonny estuary, niger delta. Research Journal of Environmental and Earth Sciences 5(4): 219 228.
- WHO (2012) Technical material for water resources assessment. Technical Report Series pp. 1-122.
- Abowei JFN, Sikoki FD (2005) Water pollution management and control, Double trust Publication Co p. 236.
- Onuoha GC (2008) Phytoplankton productivity in the Orika port harcourt sector of bonny estuary, Nigeria. Global Journal of Agricultural Sciences 7(2): 207 220.
- Cottenie K (2005) Integrating environmental and spatial processes in ecological community dynamics. Ecol Lett 8(11): 1175 1182.
- Obot OI, Etim L, David GS (2016) Review of physical and chemical properties of some Nigerian creeks. Nigerian Journal of Agriculture, Food and Environment 12(4): 82 90.
- Zabbey N, Sikoki FD, Edoghotu J (2008) Plankton assemblages and environmental gradients in the middle reaches of the Imo River, Niger Delta, Nigeria. Afr J Aquat Sci 33: 241 248.
© 2024 Aroloye O Numbere. This is an open access article distributed under the terms of the Creative Commons Attribution License , which permits unrestricted use, distribution, and build upon your work non-commercially.
Editor In Chief


.jpg)


Signup for Newsletter

Quick Links
 Editorial Board Registrations
 Submit your Article
 Refer a Friend
 Advertise With Us
Our Recent Edition

.jpg)


Top Editors


.jpg)


.bmp)
.jpg)
.png)
.jpg)


.jpg)


.png)

.png)


.png)


Financial Support

Sponsors

Latest e-Books

Latest Video

 a Creative Commons Attribution 4.0 International License. Based on a work at www.crimsonpublishers.com.
Best viewed in
a Creative Commons Attribution 4.0 International License. Based on a work at www.crimsonpublishers.com.
Best viewed in