- Submissions

Full Text
COJ Reviews & Research
Potential Impact of Agrometeorological Parameters Changes on Pearl Millet Yield in Niger River Regions
Mansour Mahamane1,2*, Issiaka Issahsrou Matchi1, Mahamadou Kossomi Agi2 and Rassa Et Siradji Abdoulaye Abdou3
1Institute in Environment and Ecology, University of Diffa, Niger
2Centre Regional AGRHYMET, Niger
3Abdou Moumouni University, Niger
*Corresponding author:Mansour Mahamane, Institute in Environment and Ecology, University of Diffa, BP 78 Diffa, Niger
Submission: September 29, 2025; Published: October 27, 2025

ISSN 2639-0590Volum4 Issue5
Abstract
In Sahel, Food production, particularly Pearl millet is vulnerable to climatic variability and extreme events. The aim of this study is to evaluate pearl millet yield in a context of agro-meteorological factors changing. The approach was based on an interannual analysis of rainfall, temperature and seasonal agroclimatic parameters. The results showed that the temperature series are not homogeneous, due to the significant changes in averages observed between 1981 and 2023, with variations ranging from 0.4 °C to 0.8 °C for maximum temperatures. The findings also showed that the earliest date of the start of rains is May 13 in the extreme south of Gaya which is more humid and the latest date of rains is June 20 in northern Tillaberi more dry area. The correlation observed between the late end of the season and its length highlights the need to integrate these dynamics into agricultural planning for better productivity.
Keywords:Agrometeorological parameters; Climate change; Variability; Pearl millet yield; Niger river regions; Sahel
Introduction
The Sahel region is considered one of the most vulnerable ecosystems in the world and the majority of the population is highly dependent on the natural resources for their livelihood [1]. Agriculture is the backbone of the Sahel’s economy and its productivity is declining due to climate change. Indeed, the region is highly vulnerable to climate change and variability due to, a great interannual variability of climatic parameters such erratic rainfall and higher occurrence of extreme weather events, environmental degradation and desertification that disrupt agriculture and pastoral livelihoods [2]. This, coupled with conflict and population growth, exacerbates food insecurity and displacement of communities. It is the most exposed to the adverse consequences of climate change in the form of outright crop failure caused by the positive nexus between intensifying temperatures and plant’s lowering growth phases [3-6]. Despite all the scientific and technological developments in enhancing the yields, the success of agricultural production has remained highly reliant on climate [7] due to intensifying CO2 mainly for C3 plants [8] varying temperature and fluctuating precipitation [9] altering harvests along the 21st century [10]. These figures have seriously affected the agricultural production in the regions located in the southwest of the Niger country called “river regions”. Therefore, the pearl millet (Pennisetum glaucum (L.) R. Br.) production, like other rainfed crops in this area, is subject to spatio-temporal variability in climatic parameters (rainfall, temperature) and Pearl millet is the crop suited of the Sahel. However, this climate variability and extreme weather phenomena compromise harvests and intensify the risks of food insecurity [11]. Droughts are one of the most recurrent climatic hazards that affect pearl millet production in Niger republic [12]. Still, pearl millet can play a key role in food security. The yields are very low and stationary because the production of this crop is faced with numerous constraints which are biotic, namely attacks from pest and disease such as insects, fungi, weeds, birds. The investigation on the potential impacts of agrometeorological services in the agricultural sector is necessary in Niger (Sahel region) and the analyzing of climate trends and pearl millet yield to facilitate decision-making in the region. Hence, the main objective of this study is to evaluate the pearl millet yield in a context of climate variability.
Materials and Methods
Research area
Figure 1:Location map of the study area in Niger and Africa.
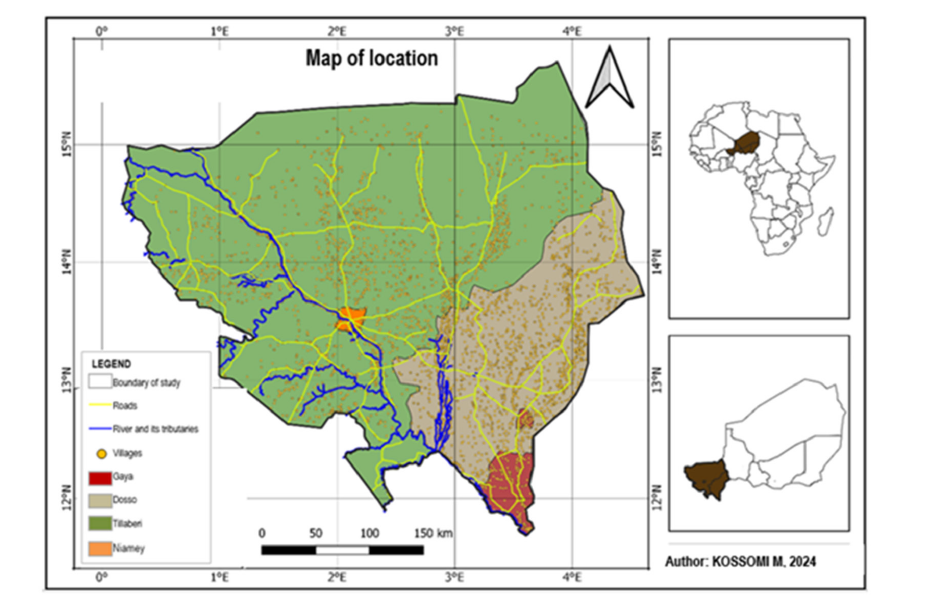
The study site covers an area about 118,506Km2 and is located in the southwestern Niger between 11°69’ and 15°70’ N and 00°16’ and 04°61’ E. It is called “river regions” because three regions (Dosso, Tillaberi and Niamey) are crossed by Niger River (Figure 1). The study is conducted in the river regions because it represents a third of national pearl millet production and was affected by hydrometeorological disasters and desertification in recent years [13] and it is subdivided into two seasons (November- April) dry season and the rainy season (May-October). In the study area, populations were estimated around 6,508,805 inhabitants and agriculture and livestock rearing are their main activities (INS, 2020).
Observed weather data and investigation
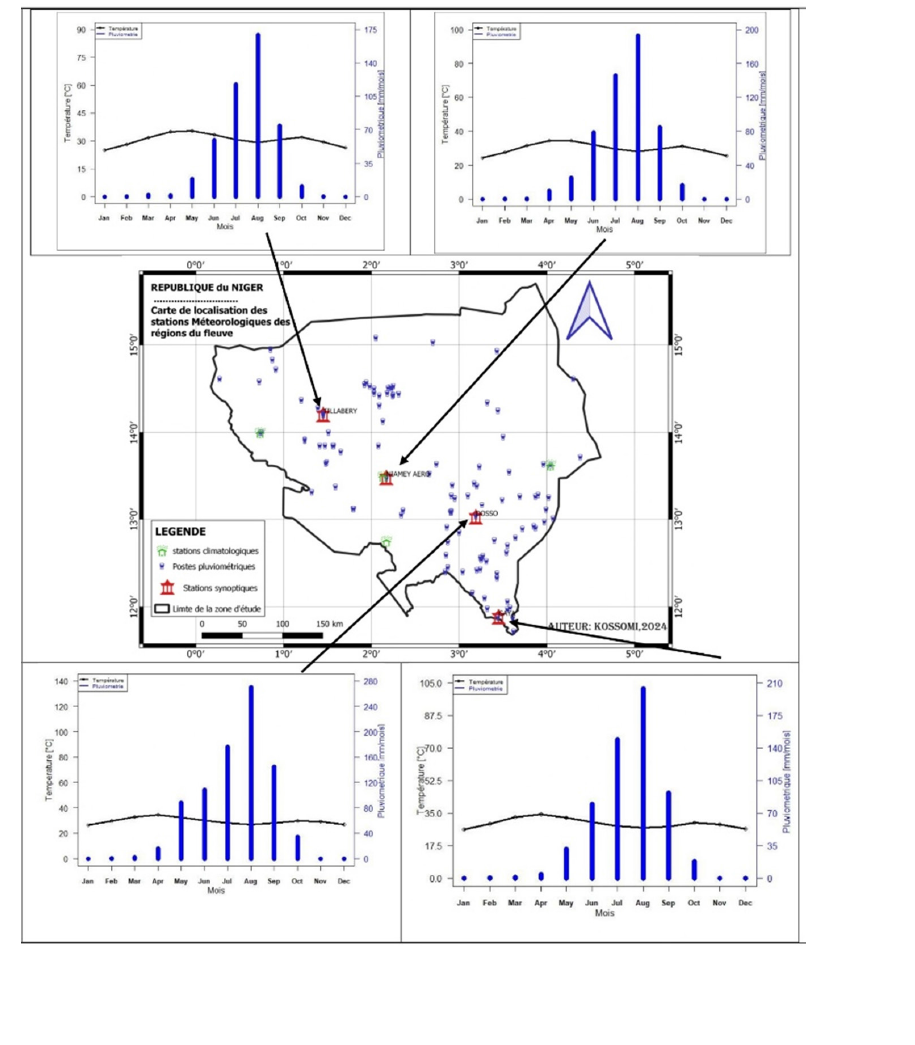
The meteorological data spanning from 1981 to 2023 were collected from four synoptic stations (Dosso, Gaya, Tillaberi, Niamey Airport), one agrometeorological station (Chikal), four climatological stations (Dogondoutchi, Niamey city, Tamou, Téra) and some rainfall stations. These data were acquired from the National Directorate of Meteorology. Data on daily rainfall and daily maximum temperatures were used. A preliminary analysis was performed using Rclimdex software for the identification of possible errors. The parameters selected for this study were precipitation, air temperatures (minimum and maximum), and Evapotranspiration of reference (ETo) during the historical period (1986-2005). We calculated the Standardized Precipitation Index (SPI) to highlight the interannual variability of rainfall (interannual rainfall anomalies) (Bergaoui and Alouini, 2001). In addition, maximum temperatures and other agroclimatic parameters trends were assessed. Furthermore, we applied Pettitt tests [14] to the data for change point detection It is a non-parametric approach to detect change points. The start date of the rainy season was determined using the method developed by Sivakumar, (1988). When analyzing the effects of climate change on agricultural production, it is important to consider the variations in the length of the growing season (Alexandrov and Hoogenboom, 2000). The length of the rainy season is the difference between the end and start dates of the rainy season. As for the number of rainy days, it was calculated using INSTAT software for each year by considering any amount of rain greater than or equal to 1mm. To study drought, we calculated the duration of the longest dry spell at the start of the season. It is the longest number of consecutive dry days during the 50 days after the start of the season. The longest dry spell could lead to a risk of re-seeding at the start of the season and to a delay in completing the crop cycle (Sarr, 2006) at the end of the season. The dry spells during the pearl millet crop development phases «Haini Kirai Precoce (HKP)» was also calculated. The interannual variability of these parameters has been studied.
Crop and soil data and analysis
For crop analysis, we used the Relative data on the variety of pearl millet -HPK (Haini Kirei Précoce) created by INRAN and Grain yields from the agricultural statistics department of Niger republic over the period 2008-2023. Soil classes were determined based on the results of Morel (1992), Sivakumar (1993) and the INRAN report (2003). This made it possible to identify, at the level of the synoptic reference stations, the major types of soils that are ferruginous sediment in Dosso region, Hydromorphic to pseudogel, tropical ferruginous in Gaya and Niamey area and Tropical ferruginous, raw minerals, Pseudogley, poorly evolved in Tillabery region (Figure 2).
Figure 2:Location of meteorological stations and ombrothermal curves in the study area.
Results and Discussion
Interannual variability of precipitation and temperature
For interannual variability (Figure 3), of precipitation, (Figure 3a), a downward trend in precipitation with a significant abrupt change (P-value=0.008) was observed in 1967 in Dosso synoptic station. The analysis highlights the first series from 1950 to 1967 with an average of 680mm characterizing the wet period then the second series characterized by a deficit of 122mm (18%) from 1968 to 2023 with an average rainfall of 558mm (Figure 4). It should be noted that years with the highest rainfall are observed in 1953, 1954, 1976 and 1994 but the rainfall are decreased in 1970, 1972, 1984 and 2011 (Figure 4a). In Gaya synoptic station (Figure 3b), a slightly increasing trend of annual rainfall was observed. Results showed a non-significant abrupt change (P-value=0.541) in 1970 which divides the series into two series: A first series from 1950 to 1969 with an average of 862mm and a second from 1970 to 2023 with an average of 817mm, characterized by a decrease of 45mm or 5%. We can notice significant accumulations above the averages in particular in the years 1953, 1964, 2003, 2018 and 2019 but also accumulations below the normal observed in 1958, 1973, 1984 and 1987 (Figure 4b). At the Niamey synoptic station (Figure 3c), a downward trend in precipitation with a significant abrupt change (P-value=0.024) was observed in 1969. Due to this abrupt change, two data series were found. For the first series from 1950 to 1969, the average precipitation was 648 mm indicating wet years conditions observed particularly in 1953, 1965, 1968, 1998 and 2017. The second series showed rainfall deficits from 1970 to 2023 with an average rainfall of 520 mm, thus indicating a decrease of 128mm (19.7%) driest conditions in 1972, 1982, 1984 and 2022 (Figure 4c).
Figure 3:Interannual evolution of rainfall in the study area.
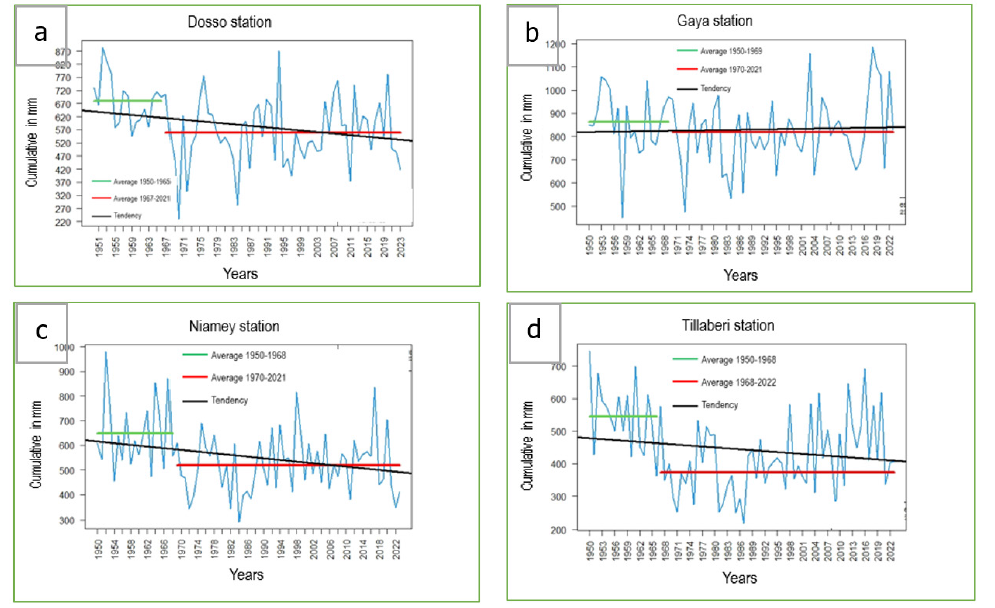
With regards to Tillaberi synoptic station (Figure 3d), a downward trend in annual precipitation with a significant change point (P-value=0.003) detected in 1967, producing two series: the mean annual precipitation for the first series from 1950 to 1967 was 544mm and 372mm for the second series from 1968 to 2023. A decrease of 172mm (corresponding to 32%) was noticed. Results revealed also years marked by significant increase in rainfall such as 1950, 1952, 1961, 2012 and 2016 while benefiting some food crops like millet, rice, wheat and maize. The years of considerable declines as well: 1971, 1981, 1987 and 2009 (Figure 4d). During this period, decreased crop yields and other negative impacts on local agriculture and food supply were noted. Rainfall is the main climatic parameter characterized with great spatial-temporal variations. According to our results, it appears that cumulative rainfall tends to decrease in all the studied stations. This trend is in line with the conclusions of Moron (1996), who observed a decrease in precipitation between 1968 and 1993 in the Sahelo-Sudanian zone. A decrease in precipitation in the study area leads to drought and water shortage, negatively impacting local agriculture production, ecosystem’s services and water availability. Those factors are main parameters in the area for the food insecurity. Temperatures are the second most important climatic variables and trends are presented hereafter. At the Dosso station (Figure 5a), the trend is significantly (P-value=0.065) towards an increase in maximum temperatures with negative anomalies (cold periods) from 1981 to 2001 then a second period characterized by positive anomalies (warm periods) from 2002 to 2023 (Figure 5a). The analysis of the change point in the data series using the Pettitt test at the 5% threshold revealed an abrupt change in 2005 for maximum temperatures (probability of exceedance of 0.0002). The average maximum temperature for the period 1981-1997 is 35.3 °C, less than 0.8 °C compared to the 1998-2023 average.
Figure 4:Precipitation anomaly in the study area.
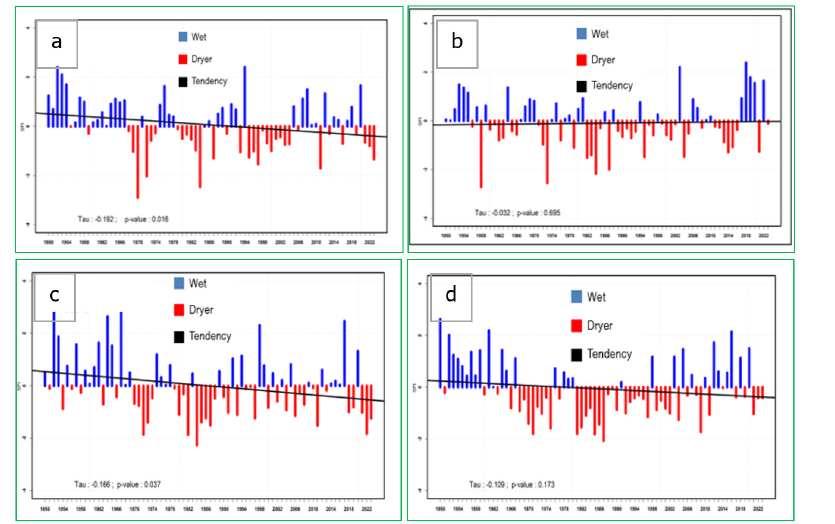
Figure 5:Anomaly of maximum temperatures at the Gaya (a), Dosso (b), Niamey (c) and Tillaberi (d) station over the period 1981-2023.
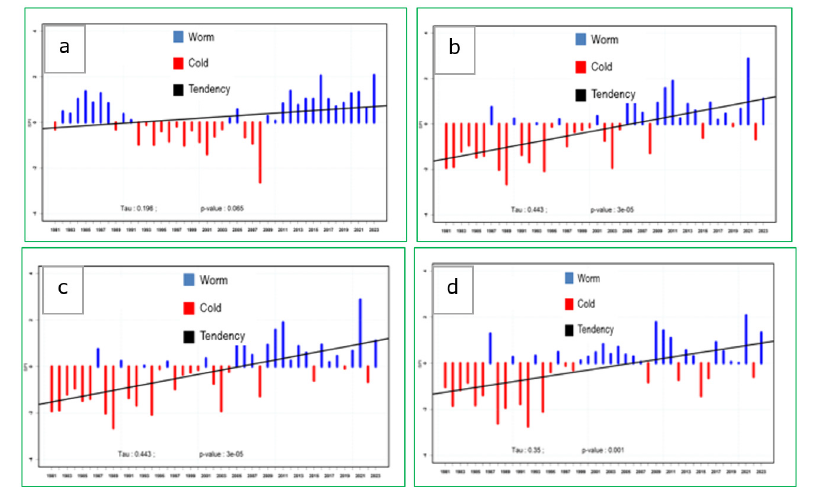
In Gaya (Figure 5b), the trend is significantly upward (P-value=0.00002) with a first period characterized by negative anomalies (cold) from 1981 to 2004 then a second from 2005 to 2023 characterized by positive anomalies indicating warmer conditions. Furthermore, the change point was detected in 2004 (P-value>0.00002) splitting the series into two periods: one from 1981 to 2003 with an average of 35.4 °C and the other from 2004 to 2023 with an average of 36 °C, indicating an increase of 0.6 °C. In Niamey (Figure 5c), we found an increasing trend (P-value=0.0004) with an almost cold period from 1981 to 2004 but also warm from 2005 to 2023 with more values above normal 1991-2020. The Pettitt test detected a significant change point in 2004 (P-value>0.001). Thus, two were observed, the first series (from 1981 to 2003) is characterized by a mean annual temperature of 36.2 °C and the second series (from 2004 to 2023) with mean annual temperature 36.7 °C showing an increase of 0.5 °C. In Tillaberi (Figure 5d), overall, the trend is upwards (P-value=0.0004) but a cold period from 1981 to 1998, a warm period from 1999 to 2007 were noticed and an alternation of the two periods from 2008 to 2023. Pettitt test noted a significant abrupt change in 1995 (P-value>0.002) allowing to have two series: a first series from1981 to1994 with an average of 36.9 °C and the second series from 1995 to2023 recording an average maximum temperature of 37.5 °C, with an increase of 0.6 °C. Overall, the results showed that the temperature series are not homogeneous, due to the numerous changes in terms of averages observed between 1981 and 2023, with differences ranging from 0.4 °C to 0.8 °C for maximum temperatures. It should be noted that the average maximum temperatures over the period 1991-2020 vary from 35.8 °C in Gaya to 37.4 °C in Tillaberi, while minimum temperatures fluctuate between 22.4 °C in Dosso and 23.7 °C in Tillaberi. These observations are in agreement with those of Roudier et al. (2011) and Sultan et al. (2015), who noted a notable increase in temperatures in West Africa and the Sahel region. In addition, these results are consistent with those of Sarr (2011), who noted a difference of 0.53 °C for maximum temperatures and 1.44 °C for minimum between 1951-1979 and 1990-2007 in Niger. Furthermore, CNEDD (2020) [15] also confirms a rising trend in maximum temperatures between 1990 and 2019, compared to the average of the last thirty years. Average maximum temperatures vary from 36 °C in Dosso to 37.4 °C in Tillaberi, and minimum from 22 °C in Dosso to 23.6 °C in Tillaberi according to CNEDD (2020).
Spatial distribution of the agroclimatic parameters
Figure 6:Average start (a), end dates of the season (b), length of the season (c) and number of rainy days (d) in the study area over the period 1991-2020.
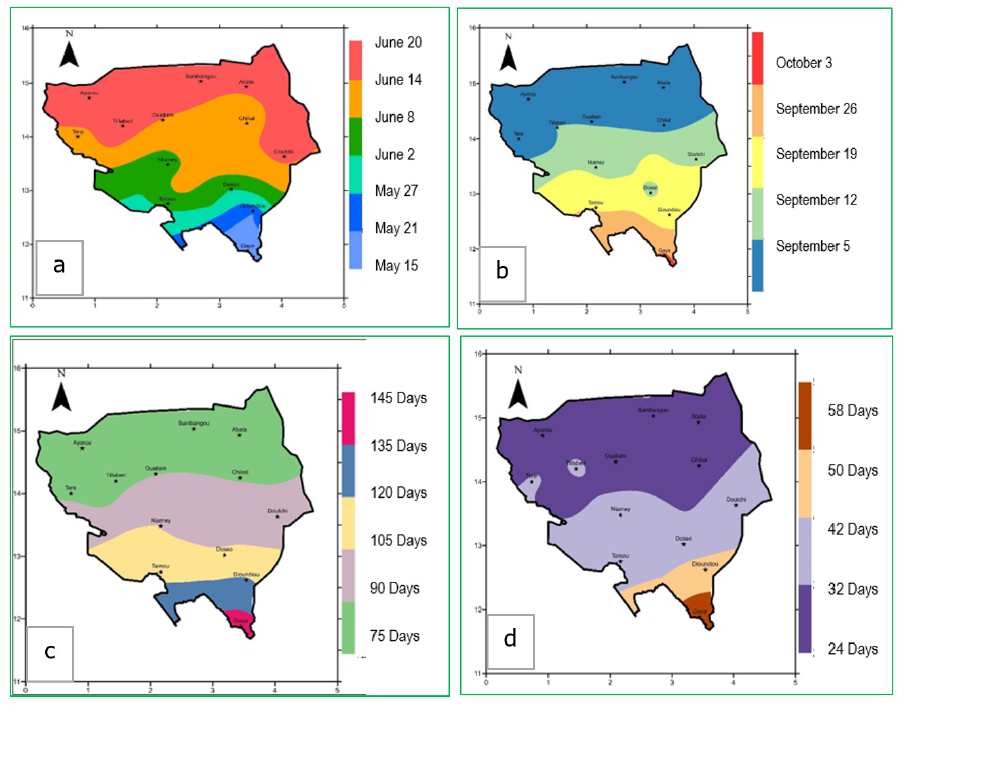
In this study, the agroclimatic parameters include start, and cessation dates of the rainy season, length of the rainy season and number of rainy days in the season. Our results revealed that the average start date of the rainy season varies along a North-South gradient (Figure 6a). On the same latitude, it is earlier in the East than in the West. In the extreme South (south of latitude 14° in the areas of Tillaberi, Ayorou, Doutchi and Bankilaré), the first rains are observed on average between June 14 and June 20. In the center (Téra, Niamey, Tamou and Dosso), the first rains are recorded at the latest in the first half of June (June 2 to June 14). The earlier start dates of the rainy season are observed on latitude 12° between by May 13 and 21 in the Gaya department. The average start date of the rainy season for the study area is June 9 with a standard deviation of 9 days. Regarding the cessation date of the rainy season (Figure 6b), it starts on average in the first decade of September in the north of Tillaberi region (Tillaberi, Téra, Ayorou). At the center of the study area between latitudes 13° and 14°, the rainy season ends between September 12 and 26, while, in the South, (Falmey and Gaya), it varies between 3 and 26 October. Furthermore, the overall average cessation date of the rainy season corresponds to September 18 with a standard deviation of 8 days. Our findings revealed that the length of the rainy season increases from North to South (Figure 6c). It varies from 75 to 90 days in the north of the Tillaberi region (Ayorou, Tillaberi, and Téra). At the center of the study area located between latitude 14° and 13° (Niamey, Doutchi, Dosso and Tamou), the rainy season lasts between 90 and 120 days. In addition, in the extreme southeast, the length of the rainy season remains longer and can reach 145 days. The results showed that the average length of the rainy season for the entire study area is 103 days with a standard deviation of 16 days. As for the number of rainy days (Figure 6d). It remains very weak (between 24 and 31 days of rain) in the north of the regions of Tillaberi and Dosso (Ayorou, Bankilaré, Ouallam) except the departments of Tillaberi and Téra. Most of the area between latitudes 12.3° and 14° indicates that the number of rainy days varies between 32 and 49 days (Niamey, Doutchi, Dosso, Tamou). It is in the extreme south of Dosso region (Gaya), that the number of rainy days remains the greatest (between 50 and 58 days) [16]. We found that the average number of rainy days in the study area is 35 days with a standard deviation of 7 days. Furthermore, agricultural production in West Africa remains particularly vulnerable to the start and end dates of rainy season as well as to the variability of the length of the season (Dodd et al., 2001).
Spatial distribution of average dry spells at the beginning and end of the rainy season
In General, the dry spells at the start of the rainy season correspond to the initial stage or germination (Figure 7a). Pearl millet seedlings suffer on average dry spells of 9 to 11 days in almost the whole study area. Likewise, the dry spells at the end of the rainy season occur during the flowering stage (Figure 7b), and during this phenological stage the water demand of crops is very high (carbon assimilation for grain formation), thus, the pearl millet crops suffer on average 10 days of dry spells in the area. During flowering, the longest dry spells of 13 days on average are recorded in the extreme southeast of the Dosso region. The risk of observing dry spells during the pearl millet initial stage increases from South to North in our study area. In the Sahelian band with a probability of 52%, pearl millet is likely to suffer water stress for more than 7 days at the seedling stage in Dosso, Niamey and Tillaberi (Table 1). In the south, the Sudanian zone, pearl millet crops are likely with a probability of 65% to suffer a dry spell of more than 7 days at the seedling stage. However, at the flowering stage, the risk of dry spells occurrence of more than 15 days exists but at a very low percentage, respectively 2% in Dosso and 10% in Tillaberi both located in the Sahelian strip. However, there is no risk of dry spells occurrence of more than 15 days at flowering stage in the Sudanian zone, thus, cropping pearl millet is less exposed in this area. Numerous studies have shown that dry spells can have significant consequences on agricultural yield, particularly if they occur during critical phases of crop development, such as flowering or initial stage (Sultan et al., 2005).
Figure 7:Average length of the longest dry spells at the beginning (a) and end (b) of the season in the Nger river regions.
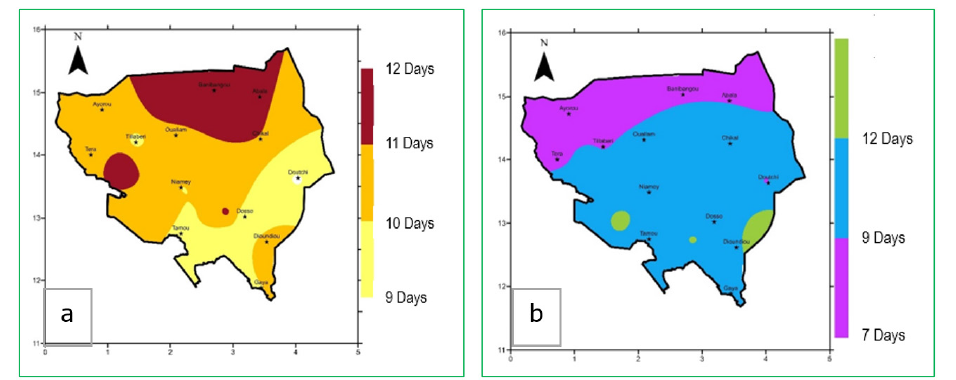
Table 1:Probability (pr) of having dry spells (ds) of 7, 10 and 15 days at initial and flowering stages of pearl millet in the river regions.

Relationship between different agroclimatic parameters
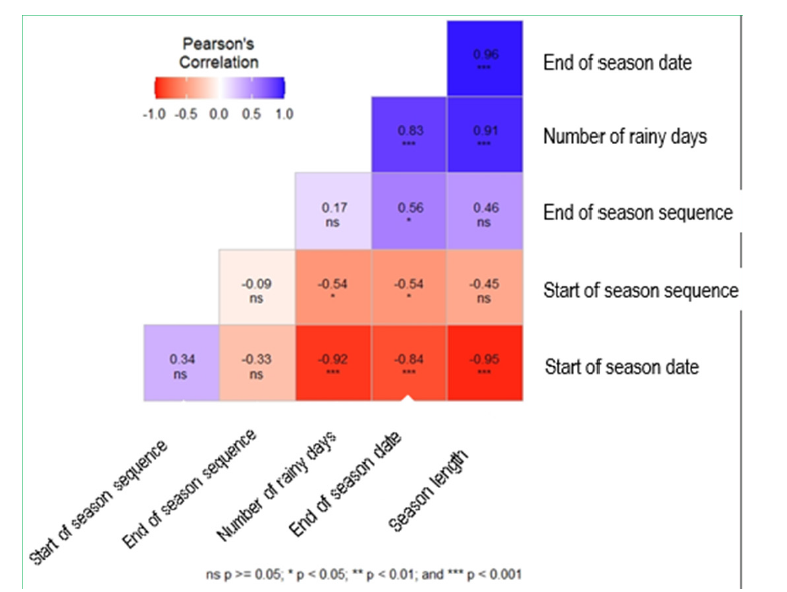
The Pearson correlation analysis between the different agroclimatic parameters (Figure 8) showed that the correlation between the Start Dates of the Rainy Season (SDS) and the cessation Dates of the Rainy Season (DES) is of -0.79 with a P-value of 1.53e-05 (significantly negative). The later the start of the season, the earlier the end of the season. Similarly, there is a strong positive correlation between the end date of dry spells (ds) and the Cessation of the Rainy Season Dates (EFS) (0.57 with a P-value of 6.87e-03, significantly positive). The Length of the Rainy Season (LS) strongly depends on the cessation of the rainy season. The correlation is of 0.94 and very significant (P-value of 5.96e-11). This trend means that a later end of the season is associated with a longer season. Furthermore, the most significant relationships between agroclimatic parameters show that a later start of the season is strongly associated with a shorter season but a later end of the season is strongly associated with a longer season. This can have significant implications for agricultural planning, resource management and understanding the adverse effects of climate changes on pearl millet growing seasons.
Figure 8:Correlogram between the agroclimatic parameters of the season in the Niger river regions.
Conclusion
Agroclimatic analysis of the Niger river regions highlights significant variations in precipitation and temperatures over recent decades. Indeed, the synoptic stations studied reveal an overall decrease in precipitation in Dosso, Niamey and Tillaberi regions, while Gaya shows a slight, non-significant increase. Furthermore, the study sites are experiencing temperatures rising trend, accompanied by significant abrupt changes in the time series. These figures influence the start and end dates of the rainy season, increasing the risk of water stress, particularly for pearl millet crops. Finally, the correlation observed between the late end of the season and its length highlights the need to integrate these dynamics into agricultural planning for better productivity to order to cope with the effects of climate change and ensure food security for rural communities.
References
- Mahamane M (2014) Assessing soil erosion risk in the Tillabery landscape Niger. African Journal of Environmental Science and Technology 9(3): 176-191.
- Ozer P, Hountondji Y, Laminou MO (2009) Evolution of rainfall characteristics in eastern Niger from 1940 to 2007. Geo-Eco-Trop: International Journal of Tropical Geology, Geography and Ecology 33: 11-30.
- Abubakar IR, Dano UL (2020) Sustainable urban planning strategies for mitigating climate change in Saudi Arabia. Environ Dev Sustain 22(6): 5129-5152.
- Ayers J, Huq S, Faisal AM, Hussain ST (2014) Mainstreaming climate change adaptation into development in Bangladesh Clim Dev 6(4): 293-305.
- Hasan M, Abedin MZ, Amin M, Nekmahmud M, Olah J (2023) Sustainable biofuel economy: A mapping through bibliometric research. Journal of Environmental Management 336: 117644.
- Hossain MS, Arshad M, Qian L, Zhao M, Mehmood Y, et al. (2019) Economic impact of climate change on crop farming in Bangladesh: An application of Ricardian method. Ecol Ecom 164: 106354.
- Aggarwal P, Vyas S, Thornton P, Campbell BM, Kopff M (2019) Importance of considering technology growth in impact assessments of climate change on agriculture. Global Food Security 23: 41-43.
- Magazzino C, Pakrooh P, Abedin MZ (2023) A decomposition and decoupling analysis for carbon dioxide emissions: Evidence from OECD countries. Environ Dev Sustain 26: 28539-28566.
- Brown G, Emma L, Claude M (2023) Climate change and variability impacts on agricultural production and food security for the smallholder farmers in Rungwe, Tanzania. Environ Manag 71(1): 3-14.
- Meyfroidt P (2017) Trade-offs between environment and livelihoods: Bridging the global land use and food security discussions. Global Food Security 16: 9-16.
- Tankari AM, Bacci M, Mounkiala H, Faustin AG, El IN, et al, (2018) Characterization of agricultural production systems in the Dosso region. ANADIA Project.
- Mahamane M, Hochschild V, Schultz A, Kuma J (2015) Monitoring desertification in the Tillabery landscape (Sahel Region) using change detection methods and landscape metrics. International Journal of Applied Research 1(10): 312-321.
- Pettitt A (1979) Non parametric approach to the change point problem. Applied statistics 28(2): 126-135.
- (2020) National Institute of Statistics (INS) of Niger. Niger in figures 2020.
- Ahmed T, Rahman MM, Aktar M, Gupta AD, Abedin MZ (2023) The impact of economic development on environmental sustainability: Evidence from the Asian region. Environ Dev Sustain 25: 3523-3553.
- Lona I (2015) Climatic risks and cultivation practices of millet and sorghum in Niger. Doctoral thesis. Abdou Moumouni University, Niamey, Niger p. 209.
© 2025 Mansour Mahamane. This is an open access article distributed under the terms of the Creative Commons Attribution License , which permits unrestricted use, distribution, and build upon your work non-commercially.
 a Creative Commons Attribution 4.0 International License. Based on a work at www.crimsonpublishers.com.
Best viewed in


.jpg)


 Editorial Board Registrations
 Submit your Article
 Refer a Friend
 Advertise With Us
.jpg)


.jpg)


.bmp)
.jpg)
.png)
.jpg)


.jpg)


.png)

.png)


.png)


