
- About Us
- Information
-

The Author ensures that the research has been conducted responsibly and ethically with adherence to all relevant regulations. read more..
- For Authors
- For Reviewer
- Manuscript Guidelines
- Membership
- Publication Ethics
-
- Journals
- Reprints
- e-Books
- Videos
- Policies
- Contact Us
 COVID-19
- Submissions


Full Text
COJ Robotics & Artificial Intelligence
Fairness Analysis of Classification Machine Learning Model CatBoost
Ahmed Rashed1* Abdelkrim Kallich1 and Mohamed Eltayeb2,3
1Department of Physics, Shippensburg University of Pennsylvania, USA
2Islamic University of Madinah, Saudi Arabia
3University of Khartoum, Sudan
*Corresponding author: Ahmed Rashed, Department of Physics, Shippensburg University of Pennsylvania, USA
Submission: October 16, 2025;Published: November 14, 2025

ISSN:2832-4463 Volume5 Issue1
Abstract
Machine Learning (ML) algorithms play a vital role in decision-making across multiple sectors such as healthcare, finance, education, and law enforcement. Despite their widespread use, concerns about fairness and bias within these systems present critical ethical and social challenges. To address these issues, three major fairness libraries-Microsoft’s Fair-learn, IBM’s AIF360, and Google’s What-If Tool-were utilized. These frameworks offer comprehensive capabilities for assessing fairness, visualizing outcomes, and implementing bias mitigation techniques. This study focuses on evaluating and mitigating bias in a structured dataset using the CatBoost Classifier model. Its primary objective is to compare the performance of mitigation algorithms from two fairness libraries, applying them individually across the three stages of the ML lifecycle (pre-processing, in-processing, and post-processing), as well as sequentially across multiple stages. The results indicate that certain sequential applications improve bias reduction while preserving model performance. A publicly available dataset from Kaggle was used for experimentation, providing a realistic context for examining fairness within machine learning workflows.
Keywords:Machine learning fairness; Bias analysis
Introduction
Machine learning algorithms are increasingly applied across diverse domains such as entertainment, retail, healthcare, finance, education, law enforcement, and critical decision-making areas like loan approvals [1] and hiring processes [2,3]. These systems offer significant advantages, including consistent performance and the capacity to analyze large numbers of variables simultaneously [4,5]. However, despite their benefits, algorithms can also manifest biases that result in unfair or discriminatory outcomes [6,7]. Such biases are particularly concerning when decisions have direct implications for individuals or communities. Ensuring fairness in machine learning is therefore crucial to uphold ethical and equitable decision-making, as biased algorithms undermine this principle by favoring or disadvantaging specific groups based on inherent or acquired characteristics. The concept of “fairness” in algorithmic systems is heavily influenced by the so-ciotechnical context. Various types of fairness-related harms have been identified:
Allocation harm: Unfair distribution of opportunities, resources, or information, such as an algorithm selecting men more often than women for job opportunities [8].
Quality-of-service harm: Disproportionate failures affecting certain groups, e.g., facial recognition misclassifying Black women more often than White men [9], or speech recognition underperforming for users with speech disabilities [10].
Stereotyping harm: Reinforcement of societal stereotypes, such as image searches for “CEO” predominantly showing photos of White men [8].
Denigration harm: Offensive or derogatory outputs from systems, like misclassifying people as gorillas or chatbots using slurs [8].
Representation harm: Over-or under-representation of
certain groups, e.g., racial bias in welfare fraud investigations or
neglect of elderly populations in public-space monitoring [8].
Procedural harm: Decision-making practices violating social
norms, such as penalizing job applicants for extensive experience
or failing to provide transparency, justification, or appeals for
algorithmic decisions [11].
These harms often overlap and are not exhaustive, emphasizing the need for careful consideration of fairness from the development stage of algorithmic systems. Integrating machine learning fairness techniques into research as practical industry applications is crucial for promoting the adoption of ethical AI practices. Fairness libraries offer powerful tools to evaluate and mitigate biases in machine learning models, meeting the increasing demand for equity as industries become more dependent on AI-driven decision-making. These tools are particularly valuable in domains such as finance, banking, and healthcare, where fairness and accountability are paramount. By enabling intuitive, interactive analysis of model behavior, fairness frameworks help stakeholders understand and manage fairness trade-offs effectively. Demonstrating their practical use bridges the gap between academic research and realworld implementation, advancing the creation of transparent and equitable AI systems. This study presents use cases utilizing three leading fairness libraries-Microsoft’s Fair learn, IBM’s AIF360, and Google’s What-If Tool-to evaluate and mitigate bias in machine learning models prior to deployment. The goal is to guide industry practitioners in integrating these tools into their workflows, thereby fostering fairness across diverse AI applications.
In this study, we performed a comparative analysis of two approaches to bias mitigation in machine learning models. The first approach involved applying individual mitigation algorithms independently, while the second explored the sequential application of multiple algorithms across different stages of the ML lifecycle pre-processing, in-processing, and post-processing. The sequential strategy aims to leverage the complementary strengths of algorithms at each stage, offering a more holistic and effective framework for reducing bias.
To conduct this study, a publicly available dataset [12] from Kaggle was selected. Kaggle datasets offer diverse and realistic contexts for evaluating machine learning models, making them well-suited for fairness research. The dataset underwent preprocessing and was utilized to build classification models-a standard machine learning task focused on predicting discrete labels from input features. Classification problems are especially significant in fairness analysis, as biased predictions can lead to unequal treatment or adverse impacts on specific groups.
To assess and mitigate potential biases, three advanced fairness libraries were utilized: Fair learn by Microsoft, AIF360 by IBM, and the What-If Tool by Google. These frameworks offer comprehensive functionalities for fairness evaluation, including quantitative metrics, visualization tools for interpreting model behavior, and bias mitigation algorithms. By employing these libraries, this study systematically examines the fairness of classification models and investigates methods to reduce bias in their predictions. A similar fairness analysis for unstructured datasets involving computer vision and natural language processing models was conducted in our previous work [13].
While prior research has largely focused on implementing
fairness interventions at individual stages of the Machine Learning
(ML) lifecycle, this study advances the field by introducing a
sequential, lifecycle-based approach that integrates fairness
techniques across all three stages-pre-processing, in-processing,
and post-processing. This comprehensive framework enhances
bias mitigation by addressing fairness holistically, reducing the
propagation of bias during model development, and minimizing
residual disparities that often persist when interventions
are applied in isolation [14,15]. By applying this integrated
methodology to real-world datasets, our research provides strong
empirical evidence of its effectiveness. Ultimately, this work bridges
the gap between theoretical fairness principles and their practical
implementation, encouraging broader adoption of lifecycleoriented
fairness strategies in AI development [16]. The objectives
of this research are:
A. The central objective is to demonstrate how a sequential
application of fairness mitigation algorithms across the ML
lifecycle stages, pre-processing, in-processing, and postprocessing,
leads to superior mitigation of biases compared to
applying these methods in isolation.
B. To assess the extent of bias present in machine learning models
trained on the selected structured dataset.
C. To compare the performance and effectiveness of the three
fairness libraries in identifying and mitigating bias.
D. To provide actionable insights into the application of fairness
tools in real-world machine learning workflows.
The remainder of this paper is organized as follows: Section 2 provides a review of related work on machine learning fairness. Section 3 describes the methodology, including the dataset, preprocessing steps, and model development process. Section 4 discusses the implementation of fairness analyses using the selected libraries and their capabilities. Section 5 presents a comparative analysis and results of the libraries. Finally, Section 6 concludes with a summary of findings.
Review of Related Work
Bias in Machine Learning (ML) models has emerged as a growing concern, especially as these systems play an expanding role in high-impact domains such as healthcare, employment, and criminal justice. Extensive research has investigated the sources, manifestations, and mitigation strategies of bias, establishing a solid foundation for understanding and addressing this critical challenge.
A major area of research centers on the identification and characterization of biases in machine learning models. Mehrabi N et al. [17] presents a comprehensive taxonomy that classifies biases into three main categories: historical, representation, and measurement biases. Historical bias arises from pre-existing inequities embedded in the data, even before any machine learning techniques are applied. Representation bias occurs when certain groups are disproportionately represented in the training dataset, resulting in skewed or unbalanced model predictions [18]. Measurement bias develops when the features or labels used for training fail to accurately capture the intended target variable due to flawed or inconsistent measurement processes.
Another line of research has focused on methods for detecting bias. Common approaches include disparate impact analysis [19] and fairness metrics such as demographic parity, equal opportunity, and disparate mistreatment [20]. In the context of structured datasets, studies typically examine both group and individual fairness. Group fairness aims to ensure that predefined demographic groups are treated equitably, whereas individual fairness focuses on providing similar treatment to similar individuals [21]. As noted in [22], these fairness definitions can sometimes conflict, requiring applicationspecific trade-offs.
The literature also highlights the technical challenges involved in mitigating bias. A common strategy is pre-processing, which tackles biases directly within the dataset. For instance, Kamiran F et al. [23] suggests re-weighting samples or modifying labels to promote fairness prior to training. In-processing approaches, such as adversarial debiasing [24], embed fairness constraints within the model training itself. Post-processing methods, on the other hand, adjust model outputs to meet fairness criteria, exemplified by the re-ranking techniques in [20]. Nevertheless, [25] emphasizes that different fairness metrics can conflict, showing that enhancing fairness often comes at the expense of accuracy.
Bias analysis in structured datasets has attracted significant attention due to the prevalent use of tabular data in decisionmaking systems. Such datasets often contain hidden biases arising from historical inequities or systemic discrimination. The COMPAS dataset, widely used in criminal justice, illustrates these issues, with studies revealing racial disparities in its predictive outcomes [26]. Research in this area also underscores the influence of feature selection and data preprocessing on either exacerbating or mitigating biases. For example, [27] investigates how correlations between features and sensitive attributes affect fairness and proposes strategies to disentangle these relationships.
Recent studies have investigated the role of interpretability in bias analysis. Ribeiro MT et. al. [28] introduced LIME (Local Interpretable Model-agnostic Explanations), which helps stakeholders understand model predictions and uncover biased decision-making patterns. [29] Further developed SHAP (SHapley Additive exPlanations), offering consistent and locally precise measures of feature importance. These interpretability tools have proven valuable for detecting bias in structured datasets, allowing detailed analysis of how individual features influence potentially unfair predictions.
Moreover, researchers are increasingly integrating intersectionality into bias analyses. [30] Highlights the importance of assessing models across multiple demographic dimensions, showing how performance gaps can accumulate for intersectional groups, such as Black women in facial recognition systems. In the context of structured datasets, studies like [31] propose fairness interventions that account for multiple subgroups simultaneously, mitigating the limitations of single-axis fairness evaluations.
The literature on bias in machine learning covers a broad spectrum, including foundational definitions, detection methods, mitigation strategies, and interpretability tools. Despite considerable advances, challenges persist in applying these approaches to structured datasets, especially when balancing fairness with other objectives like accuracy and interpretability. This review highlights the need for ongoing research into holistic, context-aware strategies for analyzing and mitigating bias in machine learning models.
Dataset and Model Details
We used two datasets in this work to generalize our conclusion
as much as possible. The first data is a loan dataset [12]. The
dataset is designed to automate the real-time loan eligibility
process based on customer details provided during the online
application form submission. These details include Loan ID, Gender,
Married, Dependents, Education, Self Employed, Applicant Income,
Co-applicant Income, Loan Amount, Loan Amount Term, Credit
History, and Property Area. Feature definitions are as follows:
a. Loan˙ID: Unique Loan ID
b. Gender: Male/Female
c. Married: Applicant married (Y/N)
d. Dependents: Number of dependents
e. Education: Applicant Education (Graduate/ Under Graduate)
f. Self Employed: Self employed (Y/N)
g. Applicant Income: Applicant income
h. Coapplicant Income: Co-applicant income
i. Loan Amount: Loan amount in thousands
j. Loan˙Amount˙Term: Term of loan in months
k. Credit˙History: credit history meets guidelines
l. Property˙Area: Urban/ Semi Urban/ Rural
m. Loan˙Status: (Target) Loan approved (Y/N)
The primary objective is to determine eligibility for granting a home loan (Yes/No) by predicting loan eligibility based on the provided information. Gender is considered a sensitive feature in the analysis. The dataset comprises 614 samples with a total of 11 features.
Figure 1:(a) General configuration experimental set up, (b)-(d) Robot position during path implementation (e) Resulting path using AFSA, (f) Resulting path using ACO [11].

The second dataset is a job application one [12]. The
“Employability Classification of Over 70,000 Job Applicants”
dataset provides detailed information about job applicants and
their employability scores, aiming to assist organizations in
evaluating candidates for various employment opportunities.
Leveraging machine learning techniques, it offers insights into
factors influencing employability, enhancing the efficiency of the
hiring process. The dataset, compiled from job portals, career
fairs, and online applications, spans diverse industries, roles, and
qualifications, ensuring broad applicability. It includes features
such as age, education level, gender, professional experience, coding
expertise, previous salary, and computer skills, with “Employed”
serving as the target variable indicating whether the applicant was
hired. Feature definitions are as follows:
1. Age: age of the applicant, ¿35 years old or ¡35 years old
(categorical)
2. EdLevel: education level of the applicant (Undergraduate,
Master, PhD. . .) (cat-egorical)
3. Gender: gender of the applicant, (Man, Woman, or NonBinary)
(categorical)
4. Main Branch: whether the applicant is a professional
developer (categorical)
5. Years Code: how long the applicant has been coding (integer)
6. Years Code Pro: how long the applicant has been coding in a
professional context, (integer)
7. Previous Salary: the applicant’s previous job salary (float)
8. Computer Skills: number of computer skills known by the
applicant (integer)
9. Employed: target variable, whether the applicant has been
hired (categorical)
This structured dataset represents applicants through rows, with attributes organized into columns, making it a valuable resource for analyzing employability trends.
To process the datasets, categorical variables were encoded
using techniques such as one-hot encoding, and continuous
variables were normalized to ensure compatibility with the
machine learning models. The dataset was split into training and
testing subsets using an 80-20 split to evaluate model performance.
For the model, the pipeline employed several machine learning
algorithms, including Logistic Regression, Decision Trees, CatBoost,
and Gradient Boosting. CatBoost [32] emerged as the most effective
algorithm for the classification task. Model parameters have been
considered with their default values:
(iterations=None, learning rate=None, depth=None, l2 leaf
reg=None, model size reg=None, rsm=None, loss function=None,
border count=None, feature border type=None, per float feature
quantization=None, input borders=None, output borders=None,
fold permutation block=None, od pval=None, od wait=None,
od type=None, nan mode=None, counter calc method=None,
leaf estimation iterations=None, leaf estimation method=None,
thread count=None, random seed=None, use best model=None,
verbose=None, logging level=None, metric period=None,
ctr leaf count limit=None, store all simple ctr=None, max ctr
complexity=None, has time=None, allow const label=None, classes
count=None, class weights=None, auto class weights=None,
one hot max size=None, random strength=None, name=None,
gnored features=None, train dir=None, custom loss=None, custom
metric=None, eval metric=None, bagging temperature=None, save
snapshot=None, snapshot file=None, snapshot interval=None, fold
len multiplier=None, used ram limit=None, gpu ram part=None,
allow writing files=None, final ctr computation mode=None,
approx. on full history=None, boosting type=None, simple ctr=None,
combinations ctr=None, per feature ctr=None, task type=None,
device config=None, devices=None, bootstrap type=None,
subsample=None, sampling unit=None, dev score calc obj block
size=None, max depth=None, n estimators=None, num boost
round=None, num trees=None, colsample bylevel=None, random
state=None, reg lambda=None, objective=None, eta=None, max
bin=None, scale pos weight=None, gpu cat features storage=None,
data partition=Nonemetadata=None, early stopping rounds=None,
cat features=None, grow policy=None, min data in leaf=None, min
child samples=None, max leaves=None, num leaves=None, score
function=None, leaf estimation backtracking=None, ctr history
unit=None, monotone constraints=None, feature weights=None,
penalties coefficient=None, first feature use penalties=None, model
shrink rate=None, model shrink mode=None, langevin=None,
diffusion temperature=None, posterior sampling=None, boost
from average=None, text features=None, tokenizers=None,
dictionaries=None, feature calcers=None, text processing=None,
fixed binary splits=None)
The study evaluated the model using standard classification metrics such as accuracy, precision, recall, and F1-score. In addition, fairness metrics such as demographic parity and disparate impact were calculated to analyze potential biases. Results highlighted disparities in prediction accuracy across demographic groups, with notable differences between different subgroups in the sensitive features. These findings underscored the importance of incorporating fairness evaluations into traditional performance assessments for machine learning models.
Implementation of Fairness Analyses
In recent years, the increasing reliance on Machine Learning (ML) in various sectors has led to growing concerns over fairness and bias in classification models. As these models can significantly influence decision-making processes in critical areas such as healthcare, finance, and criminal justice [33], ensuring their fairness has become imperative. Bias in ML models can manifest due to various factors, including skewed training data, model selection, and underlying societal biases, ultimately leading to discriminatory outcomes against marginalized groups [6].
To address these challenges, several libraries and tools have been developed to assist practitioners in analyzing and mitigating bias in their models. Among them, Fairlearn, AIF360, and What- If Tool stand out as comprehensive resources that offer unique functionalities for fairness evaluation and enhancement.
Fairlearn [34]
Developed by Microsoft, this toolkit helps data scientists assess and improve the fairness of their AI models by providing a suite of metrics to evaluate fairness and algorithms for mitigating unfairness. Fairlearn emphasizes the importance of both social and technical dimensions of fairness in AI systems. It facilitates the understanding of how different aspects of a model contribute to disparities among groups.
In this analysis, we will use the fairness metric Demographic Parity Difference (DPD) that measures the disparity between the selection rates of two or more groups. It’s calculated by finding the difference between the largest and smallest group-level selection rate. A lower value indicates less disparity. Different mitigation algorithms will be used to mitigate the bias in the model. There are algorithms work on different ML life cycle stages such as preprocessing, in-processing, and post-processing levels. The best algorithms that will work good for our use cases are Exponentiation Gradient and Threshold Optimizer.
The Exponentiated Gradient (EG) is designed to reduce unfairness in machine learning models by framing the problem as a constrained optimization task. The algorithm seeks to minimize loss (maximize predictive accuracy) while satisfying constraints related to fairness. Exponentiated Gradient works by iteratively finding a weighted combination of models (or classifiers) that achieves the best trade-off between accuracy and fairness constraints. This combination forms a probabilistic ensemble, where models are assigned, weights using an exponentiated updates scheme. The ensemble is then used for predictions. The fairness constraints are typically defined in terms of statistical fairness metrics, such as demographic parity, equalized odds, or disparate impact. These constraints are enforced within a specified tolerance level.
The Exponentiated Gradient method addresses the following optimization problem [35]:
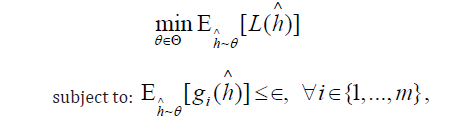
where Θ is the set of all possible classifiers, L(h)∧ is the loss function measuring predictive performance (e.g., log-loss or mean squared error), gi(h)∧ are the fair-ness constraint functions, quantifying the extent to which fairness conditions (e.g., equal opportunity) are violated for the i − th constraint, ∈ is the allowed constraint violation margin, and h∧ is a hypothesis (or classifier).
The Threshold Optimizer in the Fairlearn library is a fairness mitigation algorithm designed to adjust decision thresholds of a pre-trained model to satisfy fairness constraints. Instead of retraining the model, it modifies how the model’s predictions are converted into decisions, making it efficient and easy to integrate into existing workflows.
Threshold Optimizer takes the predicted scores from a model and applies group- specific thresholds to ensure that fairness constraints are met. This approach is particularly useful for binary classification tasks, where decisions are based on whether a prediction exceeds a threshold. The algorithm assigns different thresh- olds for different demographic groups, balancing fairness and predictive performance.
Fairness constraints, such as demographic parity or equalized odds, are specified, and the algorithm ensures that the decisionmaking process respects these constraints. The optimization minimizes a loss function (e.g., error rate) while satisfying fairness conditions.
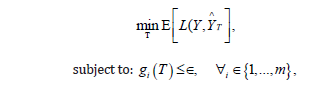
Threshold Optimizer solves the following constrained optimization problem for a binary classification setting [36,37]:
where  = is the set of thresholds, one for each
demographic group
= is the set of thresholds, one for each
demographic group  is the loss function, comparing true
labels Y and predicted labels Y∧T derived using thresholds T,gi(T)
are fairness constraint functions that quantify fairness violations
(e.g., difference in true positive rates between groups), and ∈ is the
tolerance for constraint violations. By adjusting thresholds instead
of retraining, Threshold Optimizer provides a straightforward and
computationally efficient method to ensure fairness in decisionmaking.
is the loss function, comparing true
labels Y and predicted labels Y∧T derived using thresholds T,gi(T)
are fairness constraint functions that quantify fairness violations
(e.g., difference in true positive rates between groups), and ∈ is the
tolerance for constraint violations. By adjusting thresholds instead
of retraining, Threshold Optimizer provides a straightforward and
computationally efficient method to ensure fairness in decisionmaking.
AIF360 [38]
This comprehensive library offers a wide range of metrics for assessing fairness and techniques for mitigating bias across the entire AI application lifecycle. Developed by IBM, AIF360 includes methods that can be integrated into different stages of the machine learning pipeline to facilitate fairness-aware modeling. It includes metrics for evaluating fairness across different societal demographics and offers re-parameterization strategies to improve model robustness.
Two successful mitigation algorithms will provide very good results in reducing the bias in the ML model with maintaining the metric chosen to measure the performance which is Average Odds Difference (AOD). These algorithms are Reweighing and Equalized Odds.
Reweighing is a preprocessing technique that assigns weights to the data instances to reduce biases associated with sensitive attributes, such as race, gender, or age. The reweighing process ensures that different groups are treated fairly in terms of representation when training a machine learning model [23].
The main idea of Reweighing is to balance the dataset so that the proportion of favorable and unfavorable outcomes is equal across different demographic groups defined by the sensitive attribute. The algorithm does this by computing instance weights based on the joint distribution of sensitive attributes and class labels. These weights are then applied to the training dataset, allowing the model to learn a more unbiased representation. Reweighing can mitigate fairness issues such as disparate impact or statistical parity, depending on the fairness metric being addressed. This method does not modify the feature values or the labels but adjusts their importance in the training process.
Equalized Odds is a fairness mitigation method that ensures a model’s predictions satisfy the fairness criterion known as equalized odds. This criterion requires that the prediction outcomes be independent of sensitive attributes, conditional on the true outcome. In other words, the model should have the same True Positive Rate (TPR) and False Positive Rate (FPR) across all groups defined by the sensitive attribute.
The Equalized Odds approach modifies the predictions of a classifier to ensure that the TPR and FPR are approximately equal across groups [39,20]. It achieves this by adjusting decision thresholds for different groups or directly post- processing the predictions. This technique is a post-processing method, meaning it does not alter the original model but modifies its outputs to improve fairness. The algorithm is useful in applications where fairness is critical and ensures that predictions are fair across groups while maintaining as much accuracy as possible.
What-If-Tool [40]
Created by Google, this interactive visualization tool allows users to explore and analyze machine learning models without requiring any coding. It supports performance testing in hypothetical scenarios, facilitating the understanding and explanation of model behavior. It enables users to observe model performance across different demographics and explore various “what-if” scenarios. It supports users in understanding how changes in input features affect model predictions, thus empowering them to conduct deeper bias analysis.
Together, these tools are essential for researchers aiming to understand and mitigate bias in machine learning classification models, equipping them with the methodologies to ensure equitable AI systems and informed decision-making processes.
Results and Discussion
In this section, we present and analyze the results obtained from each fairness library. The primary objective of our analysis is to conduct a comparative study on the effectiveness of applying individual mitigation algorithms versus applying multiple algorithms sequentially across the three stages of the ML lifecycle. The results demonstrate that, in some cases, sequential applications yield better outcomes compared to individual ap- plications, while in others, they perform worse. These outcomes are evaluated based on their ability to improve fairness metrics while maintaining or enhancing performance metrics. The details for each library are provided below. The codes and details can be found in [41]. The sensitive feature in the loan and job application datasets that we measured the bias in is gender, and we used the CatBoost algorithm [32] in the classification model. The model of the loan dataset predicts the eligibility of the applicant for a loan, and the model of the job applicant dataset predicts the eligibility of employment. For both models, we use the accuracy as the model performance metric. We investigate the model if it is biased against any group (male/ female) in gender.
For Fairlearn, we use demographic parity difference as a fairness metric to evaluate the bias in the machine learning model. To address and mitigate the detected biases, we applied mitigation algorithms at three stages of the machine learning pipeline: preprocessing, in-processing, and postprocessing. Preprocessing techniques involved modifying the training data to reduce bias before feeding it into the model. For example, sensitive features in a dataset may be correlated with non-sensitive features. The Correlation Re-mover addresses this by eliminating these correlations, while preserving as much of the original data as possible, as evaluated by the least-squares error. In-processing methods integrated fairness constraints into the model training process, with approaches such as exponentiated gradient ensuring that the model learned fairer decision boundaries. Postprocessing focused on adjusting the predictions after model training, ensuring that the final outputs adhered to fairness criteria without retraining the model such as thresh- old optimizer which is built to satisfy the specified fairness criteria exactly and with no remaining disparity [20,36].
Beyond these individual techniques, we also explored the use
of combined mitigation approaches, where two algorithms were
applied in series to enhance fairness outcomes. For instance,
preprocessing adjustments were complemented by postprocessing
tweaks, leading to improved alignment with both accuracy and
fairness objectives. This combined approach aimed to leverage the
strengths of each mitigation stage to produce more equitable and
reliable model predictions. The design of the sequential algorithms
are as following:
1. Correlation remover + Exponentiate gradient: We first
applied the pre-processing mitigation algorithm Correlation
Remover to reduce the bias in the sensitive features in the
dataset. Next, we applied the postprocessing mitigation
algorithm Exponentiate Gradient to fair classification
described in a reductions approach to fair classification.
2. Correlation remover + Grid search: We first applied the
preprocessing mitigation algorithm Correlation Remover to
reduce the bias in the sensitive features in the dataset. Next,
we applied the postprocessing mitigation algorithm Grid
Search to fair classification described in a reductions approach
to fair classification.
3. Correlation remover + Threshold optimizer: We first
applied the pre-processing mitigation algorithm Correlation
Remover to reduce the bias in the sensitive features in the
dataset. Next, we applied the postprocessing mitigation
algorithm Threshold Optimizer that is based on the paper
Equality of Opportunity in Supervised Learning [20].
The evaluation process identify the best algorithm/s as the one that achieve a dual objective: minimizing bias metrics like demographic parity difference while maintaining performance metrics such as accuracy, precision, and recall. Our findings highlight the importance of an integrated approach to fairness, where multiple strategies are utilized in conjunction to address complex biases inherent in structured datasets.
Figure 1 presents the results of fairlearn mitigation algorithms applied one at a time and in a sequential order to the two datasets.
Below is the discussion of the results of the loan dataset:
1. Original model
a) Demographic Parity Difference: 6.72%
b) Accuracy: 78.18%
I. The original model shows moderate unfairness with
relatively high accuracy.
II. This imbalance is typical-the model optimizes purely for
accuracy, which often results in unequal outcomes across
demographic groups.
2. Correlation remover
a) Demographic Parity Difference: 34.20%
b) Accuracy: 73.94%
I. This significant increase in disparity suggests that
removing correlated features (e.g., features correlated
with sensitive attributes) may have dis-torted predictive
relationships.
II. Sometimes, this preprocessing method can remove
informative variables that incidentally correlate with
both the target and the sensitive attribute, leading to
poorer generalization and worsened fairness.
3. Exponentiated gradient
a) Demographic Parity Difference: 3.17%
b) Accuracy: 76.38%
I. A strong improvement in fairness with only a slight drop
in accuracy.
II. This algorithm directly enforces fairness constraints
during model training, balancing between accuracy and
fairness.
III. The model likely reweighted predictions to reduce
differences in positive outcomes between groups.
4. Grid search
a) Demographic Parity Difference: 5.49%
b) Accuracy: 78.99%
I. Maintains high accuracy while modestly improving
fairness.
II. This method explores multiple combinations of
constraints and model parameters, optimizing both
fairness and performance.
III. The result implies it found a near-optimal trade-off
without over-correcting bias.
5. Threshold optimizer
a) Demographic Parity Difference: 3.98%
b) Accuracy: 74.92%
I. This postprocessing method adjusts classification
thresholds after training to align outcomes across
groups.
II. The notable fairness gain with a moderate accuracy drop
suggests successful balancing-effective especially when
base model probabilities are well-calibrated.
6. Correlation remover + Exponentiated gradient
a) Demographic Parity Difference: 12.91%
b) Accuracy: 74.43%
I. The mixed result suggests that preprocessing removed
informative features, limiting the Exponentiated
Gradient’s ability to optimize fairness effectively.
7. Correlation Remover + Grid Search
a) Demographic Parity Difference: 18.01%
b) Accuracy: 74.27%
1) Again, combining feature removal with model-level
fairness constraints may have introduced conflicting
effects-less discriminatory features but also less
predictive signal.
8. Correlation Remover + Threshold Optimizer
a) Demographic Parity Difference: 22.05%
b) Accuracy: 74.43%
i. Postprocessing methods depend heavily on the model’s
predicted prob-abilities. Since the base model was
weakened by feature removal, the threshold adjustments
couldn’t fully equalize group outcomes.
Below is the discussion of the results of the job dataset:
1. Original model
A. Demographic Parity Difference: 10.46%
B. Accuracy: 83.78%
a) The original model shows a moderate fairness gap,
meaning one demo- graphic group received favorable
outcomes more often.
b) However, the accuracy is strong and stable, as the model
was optimized for predictive performance, not fairness.
2. Correlation remover
A. Demographic Parity Difference: 9.91%
B. Accuracy: 83.73%
a) Only a slight improvement in fairness occurred, with
minimal accuracy loss.
b) The Correlation Remover removes linear dependencies
between features and the sensitive attribute.
c) The small change suggests that most bias was not
strongly correlated with the features removed, or that
the model quickly re-learned those patterns from other
correlated inputs.
3. Exponentiated Gradient
A. Demographic Parity Difference: 0.85%
B. Accuracy: 83.72%
a) This shows a drastic improvement in fairness with
virtually no impact on accuracy.
b) The Exponentiated Gradient algorithm imposes fairness
constraints during optimization, adjusting the model to
reduce outcome disparities while maintaining predictive
performance.
c) This result suggests the Job Applicants dataset allows for
effective fair- ness trade-offs-fairness can be achieved
without sacrificing much ac- curacy.
4. Grid search
A. Demographic Parity Difference: 10.46%
B. Accuracy: 83.78%
a) This result mirrors the original model, suggesting that
the Grid Search fairness constraints may not have been
strong enough or were optimized toward accuracy
rather than fairness.
b) It’s possible the fairness parameter chosen prioritized
performance consistency.
5. Threshold optimizer
A. Demographic Parity Difference: 0.63%
B. Accuracy: 83.69%
a) Another excellent fairness outcome with a minimal drop
in accuracy.
b) As a postprocessing technique, it adjusts decision
thresholds per demo-graphic group to equalize
outcomes.
c) This approach is often effective when the model’s
predicted probabilities are well-calibrated, which
appears to be the case here.
6. Correlation remover + Exponentiated gradient
A. Demographic Parity Difference: 0.99%
B. Accuracy: 83.64%
a) Combining preprocessing and in-training methods
retained most of the fairness gains, though not as strong
as when Exponentiated Gradient was used alone.
b) This may be due to the Correlation Remover reducing
useful signal that the in-training method could have
leveraged.
7. Correlation Remover + Grid Search
A. Demographic Parity Difference: 9.68%
B. Accuracy: 83.71%
a) Little improvement in fairness-indicating that Grid
Search’s optimization objective did not effectively
exploit the reduced correlations introduced by the
preprocessing stage.
8. Correlation remover + Threshold optimizer
A. Demographic Parity Difference: 0.38%
B. Accuracy: 83.69%
i. The best overall fairness improvement with minimal
accuracy loss.
ii. This combination likely worked well because the
preprocessing step simplified relationships with
sensitive attributes, and postprocessing fine- tuned
outcome balancing.
Notably, overall performance of some individual application of the mitigation algorithms is better than the sequential algorithms as we see from Figure 1 plots. Both exponentiated gradient and threshold optimizer reduced the bias in the models and maintained their performance. On the other hand, there is no sequential algorithms hold a good performance across the two datasets (Figure 1).
For AIF360, we employ both individual mitigation algorithms as well as two distinct mitigation algorithms within each stage of the machine learning pipeline to comprehensively address bias. We use the fairness metrics Statistical Parity Difference, Average Odds Difference, Equal Opportunity Difference, Theil Index, and Generalized Entropy Index. We employ the mitigation algorithms Reweighing, Disparate Impact Remover, Adversarial Debiasing, and Calibrated EqOdds.
In the preprocessing stage, Reweighing assigns weights to instances based on their representation in different demographic groups. This approach ensured a balanced distribution of data, directly addressing biases embedded in the training dataset.
In the post-processing stage, Equalized Odds imposes constraints during model training to ensure that predictive outcomes were not disproportionately distributed across sensitive attributes such as race or gender. By enforcing parity in true positive and false positive rates, Equalized Odds can enhance fairness without significantly compromising model performance.
In addition to examining individual techniques, we investigated combined mitigation strategies, where two algorithms were applied sequentially to improve fairness outcomes. For example, preprocessing modifications were followed by postprocessing adjustments, resulting in better alignment between accuracy and fairness goals. This integrated approach sought to capitalize on the advantages of each mitigation stage to achieve more equitable and dependable model predictions.
The design of the sequential algorithms are as following:
1. Disparate impact remover + Adversarial debiasing: We
first applied the preprocessing mitigation algorithm Disparate
Impact Remover to reduce the bias in the sensitive features
in the dataset. Next, we applied the in-processing mitigation
algorithm Adversarial Debiasing to reduce the bias in the
hyperparameter tuning.
2. Adversarial debiasing + Calibrated EqOdds
postprocessing: We first applied the in-processing mitigation
algorithm Adversarial Debiasing to reduce the bias in the
hyperparameter tuning. Next, we applied the postprocessing
mitigation algorithm Calibrated EqOdds Postprocessing to
fair classification described in a reductions approach to fair
classification.
3. Reweighing + Calibrated EQODDS Postprocessing: We first
applied the preprocessing mitigation algorithm Reweighing to
reduce the bias in the sensitive features in the dataset. Next,
we applied the postprocessing mitigation algorithm Calibrated
EqOdds Postprocessing to fair classification described in a
reductions approach to fair classification.
By looking at the two plots in Figure 2, one can recognize that the mitigation algorithms are not effective in reducing bias in the models as much as the ones of the Fairlearn library as shown in Figure 1. Figure 2 shows a pattern for the impact of the mitigation algorithm applications to the model performance both in individual and sequential order. The best algorithms in maintaining the model performance are Reweighing, Disparate Impact Remover, and Calibrated EqOdds in individual order, as well as Reweighing+ Calibrated EqOdds in sequential order where the accuracy of the original model is 78.18% for the loan dataset and 83.78% for the job applicant dataset and after applying these mitigation algorithms the accuracy did not change much. Regarding the bias in the models, both individual and sequential algorithms do not show much impact in reducing bias. On the contrary, some individual and sequential algorithms have increased the bias in the models.
Figure 1:The results of applying Fairlearn to loan and job application datasets with classification model after applying the mitigation algorithms one at a time and in sequential order.
Figure 2:The results of applying AIF360 to loan and job application datasets with classification model after applying the mitigation algorithms one at a time and in sequential order.

Our findings underscore the importance of selecting appropriate mitigation strategies tailored to specific stages of the machine learning pipeline. By leveraging the effective mitigation algorithms, we demonstrated that it is possible to achieve a balanced trade-off between fairness and accuracy, highlighting the potential of integrated approaches to bias mitigation in structured datasets (Figure 2).
In the What-If Tool, there is no mitigation algorithms to reduce the model bias. Therefore, we do not discuss this library here in the paper for comparing between mitigation algorithms. Instead, we demonstrate that the bias may change by adjusting the threshold for the labeled class that impacts both the model’s performance and its bias metrics. The optimal thresholds identified for this model were 0.2 and 0.4. At these thresholds, the model performance metric (Accuracy) increased from 0.33 to an average of 0.62, representing a 29% improvement, while the bias metric (Demographic Parity Difference) decreased from 0.19 to 0.01, reflecting an 18% reduction. These results are summarized in (Table1).
Table 1:The results by applying What-If-Tool library to the classification model.

Conclusion
This work examined the fairness of machine learning models with classification tasks using structured datasets, focusing on how biased predictions can reinforce systemic inequalities. Kaggle datasets were analyzed to provide the model fairness, utilizing two fairness libraries Fairlearn (Microsoft) and AIF360 (IBM) to evaluate and mitigate bias. We discussed a comparative study of applying the mitigation algorithms of these libraries individually one at a time in one of the ML stages including pre-processing, in-processing, and post-processing versus applying the mitigation algorithms in a sequential order at more than one stages at the same time.
For the Fairlearn library, we observed that applying the mitigation algorithms both individually and in a sequential order have a good power in reducing the bias in the model. Some individual applications such as exponentiated gradient and threshold optimizer showed better performance in reducing bias and maintaining the model performance over the sequential application of the algorithms. However, no sequential algorithm consistently maintained high performance across both datasets. For the loan dataset, the best algorithm performance is Exponential Gradient at demographic parity of 3.17% and accuracy of 76.38%, where the worst algorithm performance is Correlation Remover at demographic parity of 34.20% and accuracy of 73.94%. For the job dataset, the best algorithm performance is Correlation Remover + Threshold Optimizer at demo- graphic parity of 0.38% and accuracy of 83.69%, where the worst algorithm performance is Grid Search at demographic parity of 10.46% and accuracy of 83.78%.
In contrast, the AIF360 library’s mitigation algorithms showed less effectiveness in reducing bias while maintaining model performance. Sequential algorithms in AIF360 had minimal impact on bias reduction and, in some cases, increased bias in the models. For the loan dataset, the best algorithm performance is Calibrated EpOdds Postprocessing at fairness metrics average of 9.91% and accuracy of 79.67%, where the worst is Reweighing at fairness metrics average of 19.50% and accuracy of 78.86%. For the job dataset, the best algorithm performance is Reweighing at fairness metrics average of 9.55% and accuracy of 83.97%, where the worst algorithm performance is Disparate Impact Remover at fairness metrics average of 26.83% and accuracy of 79.83%.
Overall, the study demonstrated that Fairlearn algorithms outperform those in AIF360 in balancing fairness and model performance.
References
- Mukerjee A, Biswas R, Deb K, Mathur AP (2002) Multi-objective evolutionary algorithms for the risk-return trade-off in bank loan management. International Transactions in Operational Research 9(5): 583-597.
- Bogen M, Rieke A (2018) An examination of hiring algorithms, equity and bias. Help Wanted, Technical Report, Upturn, USA.
- Cohen L, Lipton ZC, Mansour Y (2019) Efficient candidate screening under multiple tests and implications for fairness, ArXiv.
- Danziger S, Levav J, Avnaim-Pesso L (2011) Extraneous factors in judicial decisions. Proceedings of the National Academy of Sciences (PNAS) 108(17): 6889-6892.
- O Keeffe A, McCarthy M (2010) The routledge handbook of corpus linguistics. (2nd edn), Routledge, England, UK, p.754.
- Angwin J, Larson J, Mattu S, Kirchner L (2016) Machine bias: There’s software used across the country to predict future criminals. And it’s biased against blacks, Benton Institute for Broadband & Society, USA.
- O’Neil C (2016) Weapons of math destruction: How big data increases inequality and threatens democracy. Crown Publishing Group, New York, USA, p. 272.
- Madaio MA, Stark L, Vaughan JW, Wallach H (2020) Co-designing checklists to understand organizational challenges and opportunities around fairness in AI. CHI 20: CHI Conference on Human Factors in Computing Systems, USA, pp. 1-14.
- Buolamwini J, Gebru T (2018) Gender shades: Intersectional accuracy disparities in commercial gender classification. Proceedings of the 1st Conference on Fairness, Accountability and Transparency, Proceedings of Machine Learning Research (PMLR), USA, pp. 77-91.
- Guo A, Kamar E, Vaughan JW, Wallach H, Morris MR (2019) Toward fairness in AI for people with disabilities: A research roadmap. ArXiv.
- Rudin C, Wang C, Coker B (2018) The age of secrecy and unfairness in recidivism prediction. ArXiv pp. 1-46.
- Datasets used in the study: https://www.kaggle.com/datasets/shaijudatascience/loan-prediction-practice-av-competition, https://www.kaggle.com/datasets/ayushtankha/70k-job-applicants-data-human-resource
- Rashed A, Kallich A, Eltayeb M (2024) Analyzing fairness of computer vision and natural language processing models, ArXiv p. 25.
- Bolukbasi T, Chang KW, Zou J, Saligrama V, Kalai A (2016) Man is to computer programmer as woman is to homemaker? Debiasing word embeddings, ArXiv, pp. 4356-4364.
- Rystsov D (2018) CASPaxos: Replicated state machines without logs. ArXiv.
- Greenlees JPC (2017) The balmer spectrum of rational equivariant cohomology theories. ArXiv.
- Mehrabi N, Morstatter F, Saxena N, Lerman K, Galstyan A (2021) A survey on bias and fairness in machine learning. ACM Computing Surveys 54(6): 1-35.
- Suresh H, Guttag JV (2021) A framework for understanding sources of harm throughout the machine learning life cycle. Proceedings of the 1st ACM Conference on Equity and Access in Algorithms, Mechanisms, and Optimization, USA, 17: 1-9.
- Feldman M, Friedler SA, Moeller J, Scheidegger C, Venkatasubramanian S (2015) Certifying and removing disparate impact. Proceedings of the 21st ACM SIGKDD International Conference on Knowledge Discovery and Data Mining (KDD), USA, pp. 259-268.
- Hardt M, Price E, Srebro N (2016) Equality of opportunity in supervised learning. Proceedings of the 30th Conference on Neural Information Processing Systems (NeurIPS), USA, pp. 3323-3331
- Dwork C, Hardt M, Pitassi T, Reingold O, Zemel R (2012) Fairness through awareness. Proceedings of the 3rd Innovations in Theoretical Computer Science Conference, USA, pp. 214 -226
- Binns R (2018) Fairness in machine learning: Lessons from political philosophy. Proceedings of the 2018 Conference on Fairness, Accountability, and Transparency (FAT), ArXiv.
- Kamiran F, Calders T (2012) Data preprocessing techniques for classification without discrimination. Knowledge and Information Systems 33(1): 1-33.
- Zhang BH, Lemoine B, Mitchell M (2018) Mitigating unwanted biases with adversarial learning. Proceedings of the 2018 AAAI/ACM Conference on AI, Ethics, and Society (AIES), USA, pp: 335-340
- Chouldechova A (2017) Fair prediction with disparate impact: A study of bias in recidivism prediction instruments. Big Data 5(2): 153-163.
- Angwin J, Larson J, Mattu S, Kirchner L (2016) Machine Bias-There’s software used across the country to predict future criminals. And it’s biased against blacks, ProPublica, New York, USA.
- Xu D, Yuan S, Zhang L, Wu X (2020) FairGAN: Fairness-aware generative adversarial networks. ArXiv.
- Ribeiro MT, Singh S, Guestrin C (2016) Why should i trust you? Explaining the predictions of any classifier. Proceedings of the 22nd ACM SIGKDD International Conference on Knowledge Discovery and Data Mining (KDD), USA, pp. 1135-1144
- Lundberg SM, Lee SI (2017) A unified approach to interpreting model predictions. Proceedings of the 31st Conference on Neural Information Processing Systems (NeurIPS) USA, pp. 4768-4777.
- Buolamwini J, Gebru T (2018) Gender shades: Intersectional accuracy disparities in commercial gender classification. Proceedings of Machine Learning Research 2018 Conference on Fairness, Accountability, and Transparency (FAT), USA, pp. 1-15.
- Kearns M, Neel S, Roth A, Wu ZS (2018) Preventing fairness gerrymandering: Auditing and learning for subgroup fairness. Proceedings of the 35th International Conference on Machine Learning (ICML), Proceedings of Machine Learning Research (PMLR), USA.
- Prokhorenkova L, Gusev G, Vorobev A, Veronika Dorogush A, Gulin A (2018) CatBoost: Unbiased boosting with categorical features. Proceedings of the 32nd International Conference on Neural Information Processing Systems, USA, pp. 6639-6649.
- Barocas S, Hardt M, Narayanan A (2019) Fairness and accountability in machine learning. Proceedings of the 2019 Conference on Fairness, Accountability, and Transparency, Association for Computing Machinery, USA.
- (2020) Improve fairness of AI systems, Fairlearn.
- Agarwal A, Beygelzimer A, Dudik M, Langford J, Wallach H (2018) A reductions approach to fair classification. ArXiv.
- Weerts H, Royakkers L, Pechenizkiy M (2022) Does the end justify the means? On the moral justification of fairness-aware machine learning. ArXiv.
- Mittelstadt B, Wachter S, Russell C (2023) The unfairness of fair machine learning: Levelling down and strict egalitarianism by default. ArXiv.
- IBM (2018) Introducing AI Fairness 360.
- Pleiss G, Raghavan M, Wu F, Kleinberg J, Weinberger KQ (2017) On fairness and calibration. Proceedings of the 31st International Conference on Neural Information Processing Systems, USA, pp. 5684-5693.
- What-If Tool by Google, GitHub.
- (20204) Fairness in machine learning: Identifying and mitigation of bias, GitHub.
© 2025 Ahmed Rashed. This is an open access article distributed under the terms of the Creative Commons Attribution License , which permits unrestricted use, distribution, and build upon your work non-commercially.
Editor In Chief


.jpg)


Signup for Newsletter

Quick Links
 Editorial Board Registrations
 Submit your Article
 Refer a Friend
 Advertise With Us
Our Recent Edition

.jpg)


Top Editors


.jpg)


.bmp)
.jpg)
.png)
.jpg)


.jpg)


.png)

.png)


.png)


Financial Support

Sponsors

Latest e-Books

Latest Video

 a Creative Commons Attribution 4.0 International License. Based on a work at www.crimsonpublishers.com.
Best viewed in
a Creative Commons Attribution 4.0 International License. Based on a work at www.crimsonpublishers.com.
Best viewed in