
- About Us
- Information
-

The Author ensures that the research has been conducted responsibly and ethically with adherence to all relevant regulations. read more..
- For Authors
- For Reviewer
- Manuscript Guidelines
- Membership
- Publication Ethics
-
- Journals
- Reprints
- e-Books
- Videos
- Policies
- Contact Us
 COVID-19
- Submissions


Full Text
Biodiversity Online J
The Genus Category: Its Natural Status and Conceptual Foundations
Johann Hohenegger*
Institute of Paleontology, University of Vienna, Austria
*Corresponding author:Johann Hohenegger, Institute of Paleontology, University of Vienna, 1090 Wien, Austria
Submission: September 22, 2025; Published: October 24, 2025

ISSN 2637-7082Volume5 Issue 5
Abstract
This article presents an approach to define a natural category for the genus within the Linnean taxonomic hierarchy using an agglomerative hierarchical classification method. The term classification refers to the process of grouping objects based on their characters, resulting in a system of classes. The methodology begins with the species as the fundamental object for the classification process, focusing on exploratory species like the biological and ecological species, both are identified through phenetic homogeneity within temporally bound evolutionary lineages. Only monophyletic species must be considered in the classification analysis, where species are grouped into classes based on decreasing homogeneity. Discontinuities during class formation serve as indicators of natural categories. The initial discontinuity in the rate of class formation following identity is employed to delineate the natural genus category.
Keywords: Characters; Genus; Binomen; Hierarchical classification; Class formation rate; Natural category
Introduction
Within the framework of binomial nomenclature, wherein organisms are designated by both genus and species names, delineating the genus as a categorical rank within the taxonomic hierarchy presents ongoing challenges, primarily due to the lack of universally accepted criteria for its definition and boundaries. This lack of clarity results in inconsistencies within classification systems and influences the understanding of biodiversity and evolutionary relationships. In 1758, Linnaeus [1] created the hierarchical classification system introducing the binomial nomenclature, assigning organisms a genus and species name. He classified the species according to morphological characteristics and their reproductive stability. The genus, however, was characterized as a collection of closely related species that possess a substantial number of shared morphological traits. Darwin [2], from an evolutionary perspective, defined the genus as a “collection of species descended from a common stock”, thereby emphasizing the monophyletic nature of genera. Mayr [3] characterized the genus as a group of biological species that share a close evolutionary relationship and occupy a similar ecological niche. Similarly, Simpson [4] expanded Mayr’s conceptualization by describing the genus as comprising several species that inhabit a distinct adaptive zone over a significant time period. Hennig’s [5] phylogenetic systematics rigorously applied the principle of monophyly, defining the genus as consisting of a common ancestor and all its descendants. Although this approach enhances conceptual clarity, inconsistencies persist regarding the precise placement of the genus name as a clade within the phylogenetic tree. Consequently, Linnaean taxonomy is set aside in favor of Phylogenetic Taxonomy [6], wherein the traditional genus and higher-level categories are replaced by the Phylocode, and the use of genus names is replaced accordingly. While species are recognized as the fundamental unit of evolution and biodiversity, the concept of the genus as part of the binomen remains imprecise and lacks universally accepted, objective criteria for delineation. Based on the categorial rank of the genus in Linnean taxonomy and the application of binomial nomenclature for a species, the identification of a natural genus category within the hierarchical classification is necessary and will be discussed in the following article. The concept of natural categories has engaged the author’s attention for four decades [7-11].
Objects,/
The formal recognition of objects like organisms or organism groups is guided by two definitions:
Definition 1: Characters are information units.
Definition 2: An object is any entity that contains at least one character
Following the second definition, an object need not be tangible but may also be abstract, such as a word. Consequently, recognition can be defined as the process of assigning characters to an object. According to these definitions, the placement of objects within a hierarchical classification system can be described as follows:
a) First-order objects are distinguished by character set 1.
b) Second-order objects consist of first-order objects specified by
character set 2.
c) nth-order objects are defined as (n-1)th order objects that are
characterized by character set n.
Based on this order, characters can be categorized as follows:
a) Basic characters have fixed character states that define objects
b) Classificatory characters display varying character states
between objects.
In evolutionary biology, first-order objects are referred to as organisms, which are identified by life as the basic character. Life itself is defined by a subset of characters like
a) Organization
b) Growth
c) Development
d) Response to stimuli
e) Reproduction
f) Homeostasis
g) Metabolism
While life is the basic character for organisms, classificatory characters of organisms can be broadly applied to all attributes pertaining to shape and size. Classifying organisms based on similarities in shape and size allows for the identification of secondorder objects known as species, which serve as fundamental units within the hierarchical system of organisms. Determining basic characters of species that are both universally applicable and consistent across all organisms has led to extensive discussion lacking a solution [12]. The proposed species concepts can be generalized by four groups based on different relations between organisms [13].
Phylogenetic relations: These are defined by the idea that all species arise when a parent species splits into two daughter species (bifurcate speciation) [14]. In this approach, species are identified as clades of the lowest rank within a phylogenetic tree. In practice, phyletic (not phylogenetic) trees are constructed using either morphological or molecular-genetic characteristics, considering ancestral (plesiomorphic, generalized) and derived (apomorphic, specialized) states [14].
Reproductive (genetic) isolation: Described as the original biological species concept, this approach focuses on causes for reproductive isolation along either sexual or asexual processes [2,12,15]. In practical terms, isolation is assessed by analyzing heterogeneities in the frequency distributions of traits, which are evaluated using quantitative population genetics.
Ecological (functional) differentiation: This perspective defines species as groups of organisms occupying specific ecological niches through adaptation [16]. Adaptation occurs via epigenetic mechanisms during development influenced by the environment. Evolutionary patterns are explained by species adapting to changing environments. Practically, ecological species are inferred from constant homogeneity in frequency distributions of traits caused by stable environments, or by distributions shift in response to environmental change.
Phenetic (morphological) differentiation: This view is based solely on morphological similarity, primarily introduced by Linnaeus [1] and later discussed by Sokal & Crivello [17]. It is demonstrated by homogeneity in the frequency distributions of morphological traits.
Both reproductive isolation and ecological differentiation are considered explorative approaches to defining species, as they describe factors involved in the formation of a species. They can be operationally identified using frequency distributions of traits interpretable by population genetics. The phylogenetic concept does not address the causes of creating a species clade. This concept focuses on speciation through bifurcation and does not include models such as gradual, punctuated equilibrium, steady quantum, gradual quantum, and reticulate speciation, which have been supported by the fossil record [4,18]. Phylogenetic trees that use bifurcate speciation are called phyletic trees, and can be constructed with cladistic methods, applying morphological characters or molecular-genetic sequences.
Hierarchies
There are two types of hierarchies that can depict the ranking of species within the system of organisms. These hierarchies are distinguished by relationships established between the classified entities, which may be formalized by
a) A n-ary relation on a set O of objects is a subset of On
b) for n=1 getting characters
c) for n=2 getting binary relations characterized by
Symmetric relation: xRy⇒ yRx
Asymmetric relation: xRy⇒¬yRx
Linear hierarchy: Characterized by asymmetric relationships, connection points denote objects arranged in a single, ranked sequence. Family trees exemplify this concept (Figure 1A) with each subsequent generation originating from a common ancestor, thereby forming the hierarchical structure. Phylogenetic trees, which consider species as fundamental units, also illustrate linear hierarchies. Specific segments of these trees, referred to as phyletic trees, are constructed via cladistic analysis, which relies on the principle that every species derives from an ancestor-paired with a sister species. Through this process, species continuously diverge from their ancestral lineages.
Nested hierarchy: Symmetric relations form the basis for grouping objects into classes, organized according to decreasing levels of connectivity. Within the biological system, species are classified at the fundamental level and further grouped by varying degrees of homogeneity, often illustrated in hierarchical agglomeration analyses through a dendrogram (Figure 1B). Hierarchical structure is exemplified in Linnaean Taxonomy, where higher levels of connectivity in shape and size correspond to a distinct categorical rank.
Figure 1:The difference between linear and nested hierarchies demonstrated by generations.

Phylogenetic relationships represented in linear hierarchies can also be illustrated through nested hierarchies that use symmetrical phylogenetic relations. For example, if A is described as the cousin of B and vice versa, this indicates sharing a relationship at the cousin level of connectivity (Figure 1B). The Linnean system of categories representing a nested hierarchy is based on symmetrical phylogenetic relationships as indicated by correspondence in size and shape. The classification of animals and plants by Linne based on morphology creating five categories was expanded to eight hierarchical categories: Dominium, Regnum, Phylum/Divisio, Classis, Ordo, Familia, Genus, and Species. As it incorporates phylogenetic relationships, this is referred to as the Evolutionary System [3]. To reflect a species’ phylogenetic position within the evolutionary system, the basic taxonomic categories are insufficient. instead, additional sub- and super-categories were established. This requirement has resulted in a significant increase in the number of categories and missing names for additional implemented subcategories, as evidenced by the placement of the lion (Panthera leo) within the evolutionary system (Table 1). Species adhere to the principle of hierarchical organization as second-order entities and can be identified as natural units because being parts of nature, thus objectively (intersubjectively) determinable. Higher taxonomic categories cannot be viewed as nth order objects; instead, they reflect changing assemblages of the basic objects, the species, that exhibit decreasing morphological connection. The assignment of taxonomic ranks as categories is inherently subjective and may vary depending on the selection and weighting of diagnostic characters. Thus, categories above the species level in biological systematics are considered arbitrary or artificial constructions created by the human mind [20]. The classification of Eukaryotes proposed by Adl [20], based on Hennig’s [5] phylogenetic classification, avoids Linnean categories and instead indicates partitions within the phylogenetic relations through a series of points.
Table 1:The lion in the linnean order.

Natural categories
The question is whether natural categories are present in agglomerative hierarchical systems and how to identify them. In agglomerative hierarchical classification analysis, objects are clustered according to their degree of homogeneity. Classificatory objects share the highest level of homogeneity by identity. The classification process starts combining objects into classes with highest degrees in homogeneity after identity. As classification advances, intra-class homogeneity progressively decreases, while heterogeneity increases, culminating in the final cluster, which integrates all objects with the lowest overall homogeneity values. In the classification process of n objects, the number of classes k is represented by a decreasing stepwise function depending on homogeneity h, formalized by
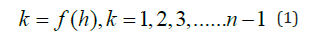
and can be modeled using various growth functions.
The rate of class formation, represented by the first derivative
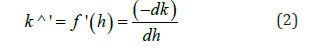
serves as an indicator for assessing the consistency of class number reduction throughout the classification process (Figure 2). Discontinuous decreases in the class number function, expressed in extended intervals with constant class number, are characterized by interruptions in the class formation rate. Since the number of classes remains constant throughout these intervals, they can be considered as objectively defined natural categories (Figure 2).
The procedure for identifying natural categories within dendrograms is demonstrated in Figure 2. While both dendrograms exhibit identical topologies - indicating that cluster groupings remain consistent -, the construction of clusters varies in terms of homogeneity. As illustrated, the stepwise function in the frequency function for the left dendrogram based on intervals in homogeneity exhibits a continuous decline to zero (represented by the black line). Similarly, the chamber formation rate shows a steady decrease, as indicated by the grey shaded areas. This trend is supported by several growth models: here, the logistic function
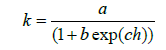
and its first derivative
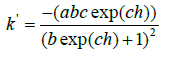
Figure 2:Dendrograms of identical topology with different class formation rates and explanation in the text.

are applied, as depicted by the red lines. The right dendrogram, in contrast to the left, illustrates concentrations of class buildings distributed along the homogeneity scale. This concentration is reflected in the frequency function (black line) by extended intervals where the class number remains constant. Similarly, the class formation rate (shaded area) exhibits substantial gaps, indicating periods with no new class formations. Furthermore, there are pronounced deviations between the observed chamber number function and its theoretical counterpart, as well as notable differences between the observed and theoretical chamber formation rates (red lines). Discontinuities in the class formation rate among groups with similar levels of homogeneity differentiate them from clusters exhibiting lower degrees of homogeneity. This clear distinction enables an objective, second order grouping of objects into classes that can be considered as natural categories. Therefore, the dendrogram to the right enables objective grouping into higher-level categories, while the left diagram allows only subjective grouping, except for the final division into two classes. When employing biological species as objects in agglomerative hierarchical classifications based on measures of homogeneity, the initial significant discontinuity in the rate of class formation can serve as the natural category corresponding to the genus designation.
Example
Figure 3 displays a hypothetical phylogenetic tree, where each species is represented by circles with differing sector distributions, each sector measuring 15 degrees. Extinct species are indicated in yellow, while extant species are depicted in blue. The data matrix assigns each sector based on its cosine and sine values. The phylogenetic tree illustrates the basic species A undergoing reticulate speciation that leads to the emergence of four distinct species, with species K lacking subsequent descendants. Species C and S further demonstrate instances of reticulate speciation, while B, G, J, and P exhibit bifurcate speciation events. The line M→N→O can be attributed to various mechanisms responsible for generating evolutionary trends composed of discrete entities, such as quantum evolution [4]. In contrast, the line P→Q→R depicts the punctuated equilibrium model [21], as both terminal taxa are considered extant. For the agglomeration method in classification analyses, the size-independent cosine measure of similarity [22] was applied to assess increasing heterogeneity (negative homogeneity: h-1) throughout the classification process. Clusters were generated using UPGMA (Unweighted pair group method using averages, [25]). The dendrogram constructed using both extinct and extant species reveals two distinct discontinuities in the class formation rate that delineate groups of species (Figure 4). The first of these discontinuities, associated with lower heterogeneity values, can be interpreted as representing the genus level. This effectively distinguishes the three evolutionary groups identified in the phylogenetic tree, each originating from species B, J, and P. Due to the classification methodology employed, both the ancestral form A and its sole derivative K are included within the genus that begins with species J (Figure 3). Additionally, the genus comprising species N and O is clearly demarcated; it does not possess the plesiomorphic character found in species A, which is present in the other species. The diagram illustrating the class formation ratio, derived from the dendrogram limited to living individuals, reveals discontinuities that divide three clusters. These clusters include the same members as those found in the genera when extinct species are included. In this context, the monospecific genus composed of O is noteworthy.
Figure 3:Theoretical phylogenetic tree. Extant in blue, extinct in yellow circles and explanation in the text.

Figure 4:Dendrograms based on hierarchical classification (UPGMA) using the Cosine as heterogeneity measure, together with histograms of the class formation rate. Left: Extinct and extant species; Right: Extant species and explanation in the text.

The phyletic trees presented in Figure 5 were constructed using the same cosine measures applied in UPGMA, calculated via the neighbor joining method [24]. These trees effectively reconstruct the underlying phylogenetic relationships. However, as they are based on the principle of bifurcating speciation, such trees cannot illustrate reticulate speciation events, as depicted in the phylogenetic tree originating from S or C (Figure 3). Nonetheless, the outcomes of reticulate speciation (T, U, V, W) are clear in the phyletic tree of extant species (Figure 5). Establishing nodes at key branching points and analyzing subsequent branch lengths may provide guidance for genus designation (Figure 5), although this approach lacks objective validation, even when it produces genera consistent with those identified in both cluster analyses. Objective genus determination requires finding breaks in class formation rates via hierarchical agglomeration, using homogeneity as a foundation. In contrast, defining genera by nodes in phyletic trees is subjective and lacks objective verification.
Figure 5:Phyletic trees based on the neighbor joining method. Above: Extinct and extant species, Down: Extant species and explanation in the text.

The genus concept
Based on the criteria described above, the genus concept can be divided into a general (explorative) and operational concept. The theorems of the explorative genus concept are
a) The genus is a group of monophyletically related explorative
species.
b) All extinct and extant species belonging to this group are the
classifying objects.
c) The genus is a natural category within the nested hierarchical
class system of species based on symmetric phylogenetic
relations.
d) Classification characters must not be changed during the
classification process.
e) Genera are defined by the first significant discontinuity in the
class building rate after identity.
This theoretical concept should be transferred into an operational framework that can be effectively managed. The theorems for an operational genus concept are:
a) The genus is a group of monophyletically related operational
species.
b) All described and emended species belonging to this group are
the classifying objects.
c) The genus is a natural category within the nested hierarchical
class system of species based on symmetric phenetic relations.
d) Classification characters must not be changed during the
classification process.
e) Genera are defined by the first significant discontinuity in the
class building rate after identity.
Ad theorem 1: The proposed monophyly is supported by the presence of ancestral (plesiomorphic) traits, which serve as basic characters defining the species group.
Ad theorem 2: The morphological species, interpreted as the ecological species [16], is considered as the most effective operational species. Under this interpretation, species should be defined within a single time frame as follows [18]:
a) Character homogeneity
b) Ontogenetic cohesion
c) Homogeneous niches and between contiguous time horizons
d) Evolutionary lines, which are objectively separated from other
lines
Ad theorem 3: The phenetic relations described are based on the properties of measurable characters, which include qualitative and quantitative (meristic) types. Qualitative characters are further categorized into two-state (present-absent), multi-state, and ranked characters. In addition to their location parameters such as mode and median, measures of dispersion like ‘entropy’ for multi-state characters and ‘deviations between percentiles’ for ranked characters are also relevant, as species differences based on second-order characters require statistical validation. Parameters such as mean, variance, and their derivatives should be applied characterizing species by meristic characters [18].
When utilizing various character measurements for describing a species, the issue of character weighting emerges. This can be addressed by either reducing higher-level measurements to lower scales, such as converting meristic data into rank-ordered categories, or elevating multi-state characters to a higher level. Gower [26] developed a specialized dissimilarity measure that accommodates these differing scales.
Character homogeneity is essential, as statistical validation of interspecific differences in characters is required prior to classification. This becomes challenging when species are identified using different types of character properties. No additional commentary is required regarding theorems 4 and 5 within the framework of the operational genus concept.
Conclusion
This article outlines a method defining the natural category for the genus within the Linnean categorial system by employing an agglomerative hierarchical classification structure. The process begins by designating species as the classification objects, using only explorative species such as biological and ecological species, both identified through phenetic cohesion in time limited evolutionary lines. Only monophyletic species are included in the classification procedure, which assorts species into classes based on decreasing homogeneity (the opposite of increasing heterogeneity). Discontinuities during class formation suggest the presence of natural categories. The first discontinuity in the class building rate following identity is used to define the natural genus category. This theoretical concept is supplemented by a more practical one, because assessing phenetic cohesion in practice can be challenging. The group of phenetic characters that defines a species may include a mixture of classificatory, topological, and metrical properties. Different proportions of properties can make it difficult to determine the degree of homogeneity when grouping species into classes. In this case, character weighting is necessary. Differences in character combination between species must be statistically validated before classification. This method applies only to monophyletic species groups and can be used to regulate the number of genus names both currently and in the future.
References
- Linnaeus K (1758) Systema naturae.
- Darwin C (1859) On the origin of species by means of natural selection or the preservation of favored races in the struggle for life.
- Mayr E (1942) Systematics and the origin of species. Columbia University Press, USA.
- Simpson GG (1944) Tempo and mode in evolution. Columbia University Press, USA.
- Hennig W (1966) Phylogenetic systematics. University of Illinois Press, USA, p. 280.
- Queiroz K, Gauthier J (1994) Toward a phylogenetic system of biological nomenclature. Tree 9: 27-30.
- Hohenegger J (1988) Proceedings of the vienna academy of sciences, mathematical and natural sciences class. Department 1, 197.
- Hohenegger J (1990) On the way to the optimal suprageneric classification of agglutinating Foraminifera. In: Christoph H, Michael AK, Wolfgang K, David BS (Eds.), Paleoecology, Biostratigraphy, Paleoceanography and Taxonomy of Agglutinated Foraminifera, pp. 77-104.
- Hohenegger J (1992a) The species as a basal element of the system of organisms, a classification problem. In: Goebl H, Schader M (Eds.), Data analysis, classification and information processing. pp. 11-19.
- Hohenegger J (1992b) Species as the basic units in taxonomy and nomenclature. pp. 15-30.
- Hohenegger J (2015) The species and genus categories in biological systematics reconsidered. pp. 42-44.
- Queiroz DK (2007) Species concepts and species delimitation. Systematic Biology 56(6): 879-886.
- Pigliucci M, Kaplan J (2006) Making sense of evolution: The conceptual foundations of evolutionary biology. The University of Chicago Press, UK, pp. 236-308.
- Platnick N (1979) Philosophy and the transformation of cladistics. Systematic Zoology 28: 537-546.
- Simpson GG (1951) The species concept. Evolution 5: 285-298.
- Van Valen LM (1976) Ecological species, demes, and subspecies. Taxon 25(2-3): 233-239.
- Sokal RR, Crovello TJ (1970) The biological species concept: A critical evaluation. The American Naturalist 104(936): 127-153.
- Hohenegger J (2014) Species as the basic units in evolution and biodiversity: Recognition of species in the recent and geological past as exemplified by larger foraminifera. Gondwana Research 25(2): 707-728.
- Mayr E (1963) Animal speciation and evolution. Harvard University Press, USA.
- Adl S, Simpson GB, Lane CE, Lukes J, Bass D, et al. (2012) The revised classification of eukaryotes. Journal of Eukaryotic Microbiology 59(5): 429-493.
- Eldredge N, Gould SJ (1972) Punctuated equilibria: An alternative to phyletic gradualism. In: Schopf TJM (Eds.), Models in Paleobiology. USA, pp. 82-115.
- Mc Quitty LL (1961) Elementary linkage analysis for isolating orthogonal and oblique types and factors. Educational and Psychological Measurement 21(4): 807-814.
- Saitou N, Nei M (1987) The neighbor-joining method: A new method for reconstructing phylogenetic trees. Molecular Biology and Evolution 4: 406-425.
- Hohenegger J (2021) Evolution, motor of the changing biosphere. In: Nishimura K, Murase M, Yoshimura K (Eds.), Creative Complex Systems. pp. 275-289.
- Sokal RR, Michener CD (1958) A statistical method for evaluating systematic relationships. University of Kansas Science Bulletin 38(2): 1409-1438.
- Gower JC (1966) Some distance properties of latent root and vector methods used in multivariate analysis. Biometrika 53(3-4): 325-338.
© 2025 Johann Hohenegger. This is an open access article distributed under the terms of the Creative Commons Attribution License , which permits unrestricted use, distribution, and build upon your work non-commercially.
Editor In Chief


.jpg)


Signup for Newsletter

Quick Links
 Editorial Board Registrations
 Submit your Article
 Refer a Friend
 Advertise With Us
Our Recent Edition

.jpg)


Top Editors


.jpg)


.bmp)
.jpg)
.png)
.jpg)


.jpg)


.png)

.png)


.png)


Financial Support

Sponsors

Latest e-Books

Latest Video

 a Creative Commons Attribution 4.0 International License. Based on a work at www.crimsonpublishers.com.
Best viewed in
a Creative Commons Attribution 4.0 International License. Based on a work at www.crimsonpublishers.com.
Best viewed in