- Submissions

Full Text
Biodiversity Online J
Monitoring Real-Time Flood Risk Zones in Australia by Combining Open- Source Data and Participatory GIS
Kithsiri Perera* and Thakshila Gunawansa
University of Southern Queensland, Australia
*Corresponding author:Kithsiri Perera, University of Southern Queensland, West Street, Toowoomba, 4350 QLD, Australia
Submission: May 29, 2023; Published: June 21, 2023

ISSN 2637-7082Volume3 Issue5
Abstract
The application of open-source data in the research field of disaster risk reduction is increasing. Flood hazard is a leading natural disaster and a significant threat to communities and infrastructure in Australia. Between 1967 and 2013, Australia suffered an annual economic loss of A$943 million due to the high frequency of flood occurrence. When dealing with flood disasters in Australia, it is vital to understand their deadly nature, trends in flood occurrence, and flood behaviour in local areas. This study discussed an innovative yet highly cost-effective platform that utilizes multiple open-source data for real-time flood monitoring and disseminates image-based flood information to the public at no cost. The methodology suggests combining data from various sources such as cloud imagery from NASA MODIS, JMA’s Meteorological Satellite Centre, NASA SRTM digital elevation, Google Earth, and GPS mobile applications to collect GPS, together with Participatory Geographic Information Systems (PGIS) to produce real-time flood mapping and flood warnings. The role of the PGIS can be highlighted in the methodology since ground-level input from participants in flood-affected regions can be a reliable source of data to enrich flood-risk contents. The study aims to provide the public with flood maps and the latest flood relation satellite imagery, primarily through social media. The process assumes widespread smartphone usage among residents in flood-risk zones in Australia. The effectiveness of the approach described in this study can be enhanced by delivering micro-level, real-time flood risk information to bolster disaster awareness and preparedness in flood-prone areas.
Keywords:Flood risk map; GIS, Himawari; MODIS; Google Earth; GPS
Opinion
Most floods occur from heavy rainfall when water carrying capacity exceeds in rivers and creeks. According to Australia’s geography, floods may spread over thousands of square kilometres and last several weeks [1]. In November 2011, the Australian Government introduced a standard definition of flood for certain insurance policies. For this purpose, a flood is defined as the covering of normally dry land by water that has escaped or been released from the normal confines of any lake, or any river, creek, or other natural watercourses, whether or not altered or modified, or any reservoir, canal, or dam [2]. In Australia’s recorded history, the costliest floods occurred 2010-11, with extensive flooding in the Lockyer Valley, Ipswich, and Brisbane in January 2011. The 2010-11 flooding cost A$6.64 billion, killing 35 people, and 20,000 people were homeless. Between 1967 and 2013, the average direct annual damage of flooding was estimated at A$943 million [1]. Due to the deadliest and most costly nature of the flood, understanding flood occurrences, how potential flood events behave in the locality, and exchanging local flood information is an important, timely matter. This short study emphasizes the value of freely available spatial data (satellite imagery and GIS data), participatory GIS (PGIS), and a mobile App in investigating occurring of floods and groundlevel flood movements.
Open-Source Data for Flood Monitoring
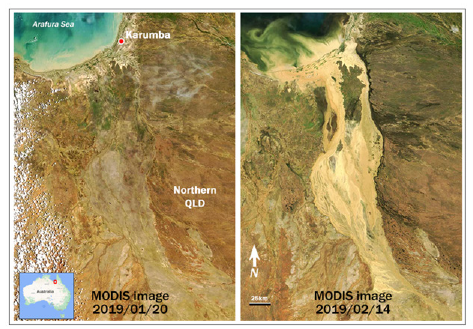
Open-source spatial data and GIS software are interlinked components and can freely be accessed by any user. USCS Library notes [3] listed a number of open-source GIS software and datasets, including QGIS (Quantum GIS), DIVA-GIS, and Natural Earth Data. These open-source spatial data resources range from the global scale to a country or state scale. For flood monitoring, it is essential to have data sources which are updated on a regular basis. Satellite data sources are not labelled as open source due to the complicated technical aspect of the data production process, but most satellite missions made data publicly available. Concerning flood monitoring, there are two major satellite data products that cover the whole of Australia on a real-time or daily basis, MODIS and Himawari 9 (Figure 1).
Figure 1:Flood monitoring with NASA MODIS 250m imagery. The 14th Feb 2019 presents the flooded Karumba region in northern Queensland, Australia.

NASA MODIS Mission
NASA’s MODIS Aqua and Terra satellite mission is one of these key satellite missions at the global scale and releases data daily [4]. MODIS (or Moderate Resolution Imaging Spectroradiometer) is a key instrument aboard the Terra (originally known as EOS AM-1) and Aqua (originally known as EOS PM-1) satellites. MODIS acquires data at three spatial resolutions, 250m, 500m, and 1,000m [4]. Terra MODIS and Aqua MODIS view the entire Earth’s surface every 1 to 2 days, acquiring data in 36 spectral bands or groups of wavelengths (see MODIS Technical Specifications) between 0.405 and 14.385μm. Flood monitoring can be effectively conducted with 250m spatial resolution MODIS data to identify possible risk areas, developments of floods and extensive cloud cover images for a large country like Australia.
Himawari-8 and 9 Satellite Data
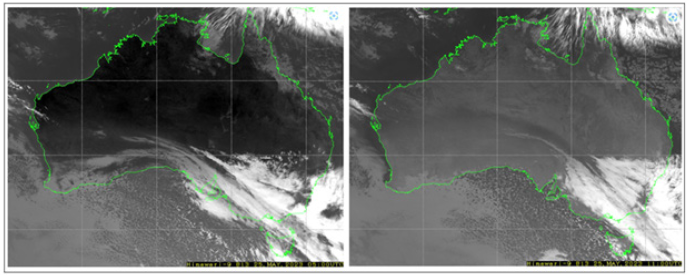
The second vital satellite mission for Australian flood-related studies is the Himawari mission, the new generation geostationary JMA (Japan Meteorological Agency) meteorological satellite mission data. This is a joint project between JMA and WMO (World Meteorological Organization) to provide real-time weather satellite data to several East Asian, South Asian, and Western Pacific Region countries [5]. The Himawari-8 mission became operational in July 2015, and the 1st image of Himawari-9 was released in January 2017 [6]. Presently, Himawari-9 is in full operation, and Himawari-8 uses as a backup mission. The Himawari-9 has reserved one of its subregion imaginary over Australia, and Figure 2 shows the infrared (Band 13) image produced by Himawari-9 for Australia on 25th May 2023. The Australian weather forecast widely uses Himawari-8 and 9 weather satellite imagery. The Himawari satellite is located around 140° east, observing East Asia and the Western Pacific. The most valuable function of geostationary meteorological satellites is their ability to monitor atmospheric phenomena continuously and uniformly over areas where surface-based observation is difficult such as seas, deserts, and mountains. With the enhanced 16-band (channel) observation capability, Himawari-8 is expected to improve meteorological services by National Meteorological and Hydrological Services in the region for weather forecasting, climate monitoring, disaster risk reduction and safe transportation. Apart from these two satellite missions, among other satellite data providers essential for the context of Australia are NASA’s Landsat mission and ESA’s (European Space Agency) Sentinel mission. These missions provide imagery with mission-specific spatial and temporal resolutions. The Suttle Radar Topography Mission is another precious raster data resource essential to identify possible flood directions and their volume according to land surface conditions [7]. Among other spatial open-source data providers, Google provides a great raster and vector data platform environment for displaying topic-specific information.
OpenStreetMap is another widely popular vector database that covers the entire world [8] and provides data in GIS-friendly shapefiles format. Natural Earth data and DIVA are popular opensource data resources among cartographers [9].
Figure 2:Himawari 9, Australia image (Band 13 Infrared) was taken at 05.00 UTC ((left image) and 11.00 TUC on 25th May 2023. These Himawari cloud image updates every 10 minutes and can be used to monitor real-time cloud behaviour to support weather and flood forecast (image credit, JMA).

How Participatory can GIS (PGIS) be Involved in Flood Monitoring?
In this short report, the value of PGIS mentioned with regard to the generation and contribution of local-level flood information through mobile phones to data-gathering stations/authorities. A mobile App can disseminate flood condition satellite information to the public and invite the public to input local flood information through the App. When the App provides flood-affected areas or heavily clouded area images, the participants can check detailed ground information using the Google platform. The combination of real-time data and Google infrastructure data helps the participants to record and report any ground-level observation. The user can link the location through an app which provides ground spot elevation and GPS (Lat/Long) readings of the specific location and report the GPS location of ground-level flood conditions and possible developments. The potentiality of this mechanism has a massive impact on accurate flood risk and damage assessments since participants in the data network experience real-time disaster conditions in their respective local areas [10].
Conclusion
This study discusses open-source and freely accessible, reliable, and readily available spatial data to build a platform for the public to contribute to ground-level flood monitoring. A combination of real-time cloud cover data from NASA MODIS satellite data, Meteorological Satellite Centre of JMA, NASA SRTM digital elevation data, Google Earth GPS and elevation data, GPS location and elevation mobile Aps (GPS), and input from participatory GIS (PGIS) to use in flood monitoring are discussed. Any person operating a smartphone in the regions of potential flood risk can add input to the flood risk map and compare it with the flood warning from BOM. With regards to the context of Australia, the study assumes residents are using smartphones to access information through Apps to exchange information about flood conditions with research conductors. Based on ground-level data, satellite images can be enriched with flood information and disseminated through social media. Creation and maintenance of the flood risk map need a user who has access to a computer, internet, and Google mapping application skills to attend to the data and content coordination role. The results will produce micro-level flood risk information on the Google platform while delivering graphical flood information to residents in disaster-prone areas.
References
- (2021) Where do floods occur in Australia?
- (2011) Standard definition of flood.
- USCS Library notes (2023) GIS: Open Source Data.
- MODIS (2023) National Aeronautics and Space Administration.
- WMO (2016) Facilitating the use of new Himawari-8 satellite data.
- JMA (2023) Meteorological Satellite Senter of JMA.
- NASA Earth data (2023) Suttle radar topographic mission (SRTM).
- Openstreetmap (2023).
- Natural Earth (2023).
- Worldview Earthdata (2023).
© 2023 Kithsiri Perera. This is an open access article distributed under the terms of the Creative Commons Attribution License , which permits unrestricted use, distribution, and build upon your work non-commercially.
 a Creative Commons Attribution 4.0 International License. Based on a work at www.crimsonpublishers.com.
Best viewed in


.jpg)


 Editorial Board Registrations
 Submit your Article
 Refer a Friend
 Advertise With Us
.jpg)


.jpg)


.bmp)
.jpg)
.png)
.jpg)


.jpg)


.png)

.png)


.png)


