- Submissions

Full Text
Aspects in Mining & Mineral Science
Valuation of a Gold Mine
Piroz Zamankhan*
Arctic Greenhouse Research Unit (AGRU), Finland
*Corresponding author:Piroz Zamankhan, Arctic Greenhouse Research Unit (AGRU), Ounasjoen itapuolentie 5617,97340 Meltaus, Finland
Submission: October 11, 2025: Published: October 27, 2025

ISSN 2578-0255Volume14 Issue 3
Abstract
To estimate the value of a gold mine, we considered several key factors, including the size and grade of the resources, which indicate the number of gold ounces available on the ground. It is also crucial to assess the cost structure, including mining and operating expenses, as well as the potential cash flow, which we measure using Net Present Value (NPV). These metrics helped us to determine the value of gold within the mine. Standard valuation methods typically include the following. Per-ounce valuation: This approach applies multiples to the ounces of gold. Market approach: This method compares the mine to similar transactions in the industry. Discounted Cash Flow (DCF): This technique involves projecting future earnings and discounting them to determine their present value. Using these methods, we can better estimate the overall value of a gold mine.
Keywords:Gold mine; Mineralogical analysis; Flotation testing; Pressure oxidation (cyanidation testing); Reactive granular metmaterial
Introduction
This report details the steps required to evaluate a gold mine, specifically focusing on calculating the per-ounce valuation [1]. The evaluation process included the following steps: sample description, mineralogical analysis [2], whole-ore cyanidation, flotation testing [3], pressure oxidation (cyanidation testing) [4], bio-oxidation (cyanidation testing), neutralization testing and stability testing [5]. Approximately 150kg of ore was crushed to a size less than 10 mesh. A sample of the head was then prepared for testing. Head analysis revealed a gold content of 2.7 grams per ton of rock, which measures the gold grade in mining and exploration. This value indicates a significant intercept. However, additional context is needed regarding the specific gold deposit in which this grade was identified. As a result, we submitted a portion of the sample for mineralogical characterization.
Mini Review
Our analysis revealed that silicate minerals including quartz, potassium feldspar and mica were the dominant components of the sample. Sulfide minerals constituted 8% of the sample, with pyrite accounting for the majority of sulfide content. Other sulfide minerals present, albeit as minor components, include arsenopyrite, galena, orpiment, realgar, sphalerite, chalcopyrite, copper sulfosalt and stibnite. The arsenic content in pyrite was measured to be between 0 and 36wt.% using electron microprobe analysis. In addition, pyrite grains frequently exhibited fractures and compositional zoning. The heavy liquid separation of the sample concentrated nearly half of the gold, achieving a concentration of 1.9wt%, primarily associated with pyrite.
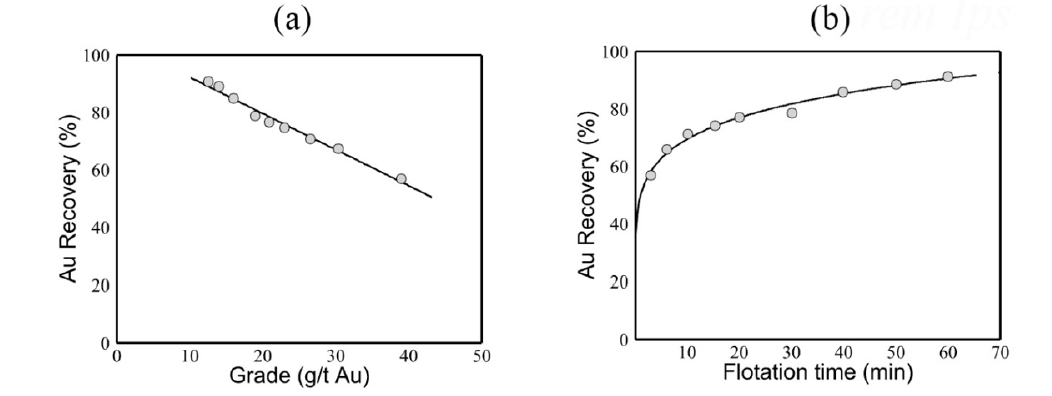
We calculated a gold grade of 94g/t; however, no visible gold was detected in the head sample. These results indicate that the majority of gold was likely present as a solid solution within the pyrite. In our whole-ore cyanidation test, we maintained a NaCN concentration of 1g/L with a particle size of K80 90mm. The gold extraction achieved was 13%, with a consumption of 0.9kg/t for both NaCN and CaO. Our flotation testing included both selective flotation and bulk sulfide flotation. In the selective flotation test, we performed a prefloat to obtain a realgar/orpiment concentrate, which effectively reduced the arsenic content in the concentrate and proceeded with further treatment for gold recovery. We successfully recovered stibnite concentrate and bulk sulfide concentrate (pyrite). During the realgar/orpiment pre-flotation process, only a frother was added. Next, lead nitrate was introduced to activate stibnite. By adding small amounts of Cytec dithiophosphate, we successfully recovered stibnite concentrate. In the final stage, potassium amyl xanthate was added to recover the remaining sulfides, specifically primary pyrite. In summary, a significant portion (24%) of the gold was recovered in the initial stage of flotation using only the addition of a frother. This indicates that fine free gold was present, making it impossible to pre-float the realgar and remove it from the downstream process. Additionally, the antimony grade of this sample was too low to produce a stibnite concentrate, leading us to conclude that further testing to produce stibnite concentrates is unnecessary. We also observed a relationship between the distribution of gold and arsenic, particularly in tailings. This correlation was expected if most of the Au was associated with the arsenical pyrite. Subsequent flotation tests were aimed at maximizing the gold recovery from the bulk sulfide concentrate. We investigated the effects of the grinding fineness, collector addition, activator presence and flotation time. Potassium Amyl Xanthate (PAX) served as the primary collector in all the tests. Figure 1 summarizes the results of one of our experiments, in which the particle size was K80×146mm. In this test, we used 225g of PAX per ton of ore to extract gold (Au). PAX acts as a collector by making the gold particles hydrophobic, allowing them to attach to air bubbles for separation.
Figure 1:Illustrates the results of one of our bulk flotation experiments, where the particle size was K80=146μm and we used it as a collector at a concentration of 225g PAX per ton of ore. Panel (a) shows the relationship between gold (Au) grade and Au recovery, while panel (b) depicts Au recovery as a function of flotation time. The solid line in the panels represents our model, referred to as 28.1554 t*f 0.1+83.4051t*f 0.2 -21.0268 t*f 0.3. In our model, the dimensionless flotation time, denoted by tf*, was defined as tf./tref, where tref=60min. Flotation kinetics are slow and a long flotation time is required to achieve these goals.

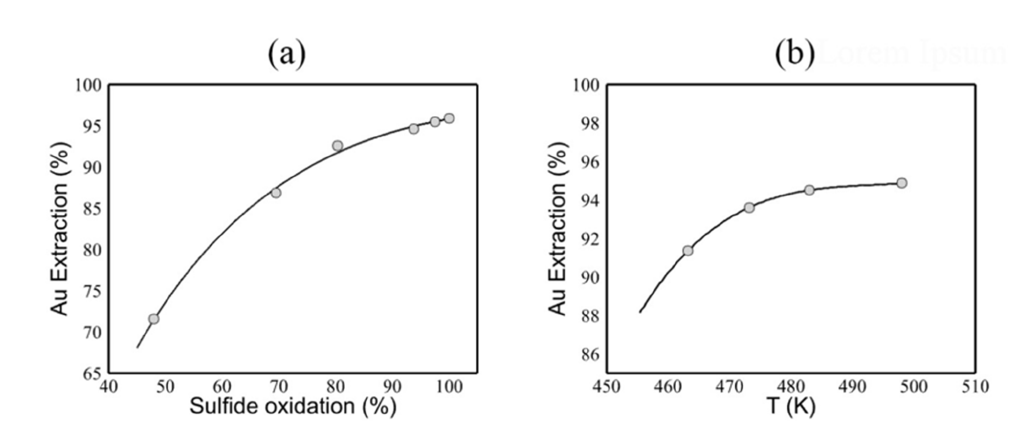
In our experiments, we found that ground fineness had a minimal impact on gold (Au) recovery. However, we observed a slight improvement in the kinetics as the grinding became finer. The best results, shown in Figure 1, were achieved for the coarsest ground size. The introduction of copper sulfate as an activator does not enhance the recovery of gold or sulfides. Fifty kilograms of ore were ground to a K80 of 136 microns and treated under the aforementioned conditions to produce a bulk flotation concentrate for further processing. The gold (Au) recovery was 88.2% in a concentrate with an assay of 12.6g/t Au, which represented 18.7% of the total weight. Pressure oxidation tests were conducted on the concentrate to investigate the recovery of gold (Au) and the relationship between sulfide oxidation and gold recovery. The effects of the temperature, oxygen overpressure, oxidation time and regrinding in an autoclave were examined. After the oxidation, the autoclave was filtered and washed. The residue was then repulped with fresh water for cyanidation, maintaining an NaCN concentration of 1g/L and a pH of 11 for 24h. It is important to note that regrinding was unnecessary to achieve the effective oxidation of sulfide minerals. Furthermore, at 498K, the oxidation of sulfides and gold recovery were comparable after 30 and 60min. We observed that reducing the oxygen overpressure from 700kPa to 350kPa resulted in a decrease in gold recovery from 95% to 86%. This reduction was attributed to a significant decline in sulfide oxidation from 99% to 70% at 498K. When the oxygen overpressure was sustained at 700kPa, sulfide oxidation remained high (above 95%), even when the temperature decreased to 473K. However, at 463K, sulfide oxidation decreased to 81%, accompanied by a drop in gold extraction from 94% to 91%.
Figure 2:Shows the results of the POX tests. (a) illustrates the relationship between sulfide oxidation and gold (Au) extraction. The solid line represents our proposed model, which is referred to as -2855.35So 0.10 +5503.91So 0.20- 2910.54So 0.25. (b) shows the extraction of gold as a function of POX temperature, with the solid line indicating the predictions made by our reactive granular metamaterial [5].

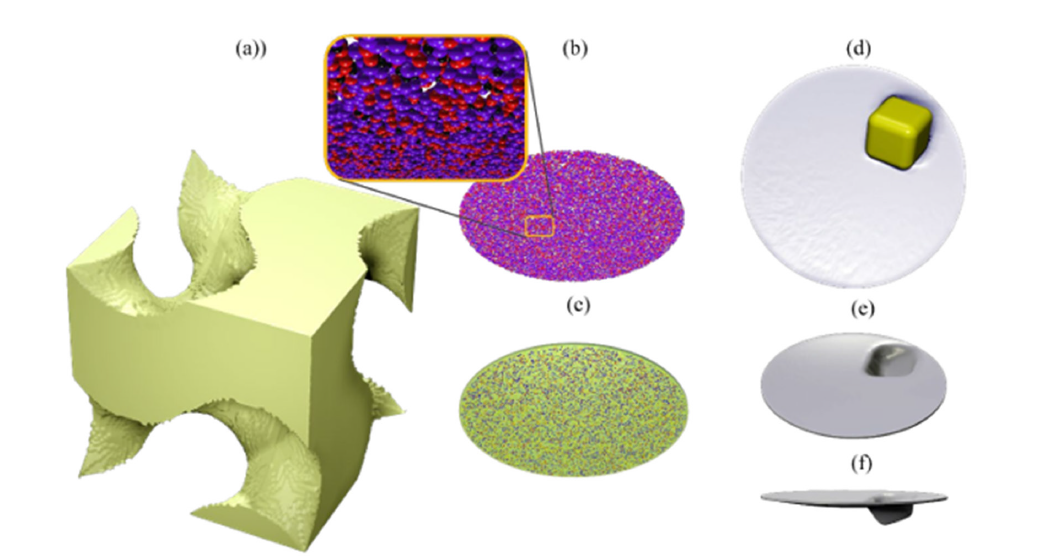
Figure 3:Standard vs. Granular Metamaterials. (a) This panel displays a typical ordered, standard metamaterial. (b) Here, we see a disordered configuration of a tertiary granular mixture within a granular metamaterial. The inset offers a magnified view of this granular mixture. (c) A thin circular plate made from granular metamaterials is shown, incorporating the grains depicted in (b). The plate is slightly transparent, which allows its inner structure to be visible. (d) A top view of a gambling die is presented, used as an intruder in the granular metamaterial. Panels (e) and (f) illustrate the crater formed due to the interaction between the gambling die and the granular metamaterial, which was employed to measure the surface energy per unit area of the dry granular assembly. Google AI incorrectly uses the term “surface energy force.” Surface energy per unit area is defined as energy per unit area, measured in joules per square meter (J/m²) according to the International System of Units (SI).

Conclusion
The cyanidation residue from the Pressure Oxidation (POX) test was mineralogically examined. Several fine sulfide inclusions within the silicate gangue were observed. In addition, some liberated pyrite grains were identified that displayed irregular grain margins. An arsenic-rich margin on one of the pyrite grains was analyzed using a scanning electron microscope. Several occurrences of jarosite were also identified, including a pyrite grain coated with jarosite. The presence of jarosite may explain the high lime consumption observed in this study.
Our Pressure Oxidation (POX) test results are summarized in Figure 2. We also conducted biooxidation amenability tests using a bulk sulfide flotation concentrate. However, to keep this report concise, we present the results of these tests in our upcoming article (Figure 2a). The solid line in Figure 2(b) was created using a reactive granular metamaterial. One of our future objectives is to employ granular metamaterials and metafluids to accurately predict the complex behaviors observed in POX tests, as illustrated in Figure 2(b). In a previous study, we successfully used granular thin films to measure the surface energy per unit area of dry granular assemblies. Figure 3 summarizes our past achievements in the utilization of granular metamaterials as measurement tools.
References
- Dougherty HN, Schissler AP (2020) SME mining engineering reference handbook (2nd edn), Society for Mining, Metallurgy & Exploration.
- König U, Pöllmann H (2022) Value of mineralogical monitoring for the mining and minerals industry. Minerals 12(7): 902.
- Verster I, Awatey B, Forbes L, Morrison A, Mankosa M, et al. (2024) Small-scale fluidised bed flotation device for ore amenability testing. Minerals Engineering 216:
- Wu J, Ahn J, Lee J (2022) Characterization of gold deportment and thiosulfate extraction for a copper‑gold concentrate treated by pressure oxidation. Hydrometallurgy 207:
- Zamankhan P (2025) Surface energy of a dry granular assembly. J Appl Phys 138: 084701.
© 2025 Piroz Zamankhan. This is an open access article distributed under the terms of the Creative Commons Attribution License , which permits unrestricted use, distribution, and build upon your work non-commercially.
 a Creative Commons Attribution 4.0 International License. Based on a work at www.crimsonpublishers.com.
Best viewed in


.jpg)


 Editorial Board Registrations
 Submit your Article
 Refer a Friend
 Advertise With Us
.jpg)


.jpg)


.bmp)
.jpg)
.png)
.jpg)


.jpg)


.png)

.png)


.png)


