
- About Us
- Information
-

The Author ensures that the research has been conducted responsibly and ethically with adherence to all relevant regulations. read more..
- For Authors
- For Reviewer
- Manuscript Guidelines
- Membership
- Publication Ethics
-
- Journals
- Reprints
- e-Books
- Videos
- Policies
- Contact Us
 COVID-19
- Submissions


Full Text
Aspects in Mining & Mineral Science
Empirical Fragility Curves for Houses in Chile Using Intensity Measures by USGS
Tamara Cabrera1*, Matías A Hube2 and Hernán Santa María2
1 Board Compliance & Governance, Chile
2 National Research Center for Integrated Natural Disaster Management (CIGIDEN), Chile
*Corresponding author:Tamara Cabrera, Board Compliance & Governance, Málaga 115, oficina 1002, las Condes Santiago, Chile
Submission: August 28, 2025: Published: October 14, 2025

ISSN 2578-0255Volume14 Issue 3
Abstract
Chile is a country affected continuously by large-scale seismic events, including those that occurred during the 2014 (Iquique, Mw=8,2) and 2015(Illapel, Mw=8,3) earthquakes. Estimating the impact of earthquakes on structure inventories can support the development of risk reduction strategies. Previous events are helpful for calibrating risk models and contribute to understanding the consequences of earthquakes. It should be noted that empirical data are available to estimate future damage in Chile. The objective of this study is to estimate the empirical fragility curves of reinforced concrete, reinforced masonry, adobe, and timber houses using damage information from the 2014 and 2015 earthquakes. The fragility curves were estimated using three Intensity Measures (IM) to identify which IM was better correlated with the observed damage and which fragility curves better adjusted the observed data using the Akaike Index Criteria value. These IMs were obtained from shake maps by the United States Geological Survey (USGS) and were used as the Intensity Measure Type (IMT) to express ground shaking. The methodology used has three steps: (1) organize the damage observed for the 2014 and 2015 earthquakes according to the Hazus damage scale (slight, moderate, extensive, and collapse); (2) consider IM are: the Peak Ground Acceleration (PGA), Peak Ground Velocity (PGV), and Spectral Acceleration at a period of 0.3 seconds (Sa(0.3)); and (3) estimate the empirical fragility curves using a Generalized Linear Model with Probit as Link function. The obtained results indicate that, for the analyzed houses, Sa(0.3) is the IM that correlates better with the observed damage. A better adjustment of fragility curves for observed damage was obtained using PGA for reinforced concrete and reinforced masonry houses, and for adobe and timber houses, using PGV.
Keywords:Fragility curves; Earthquakes; Data survey; Intensity measure; PGA; PGV; Sa(0.3)
Introduction
Damage data from the 2014 and 2015 earthquakes were obtained from a database compiled by the Ministry of Housing and Urbanism (MINVU), which was complemented by the exposure model developed by Santa María et al. [1] to estimate non-damaged houses. Figure 1 shows the rupture zones and regions affected by the two earthquakes. The assessment of earthquake-induced damage was conducted utilizing the Hazus damage scale, which delineates four distinct damage states: slight, moderate, extensive, and collapse. Each structure was assigned a damage level based on the repair cost ratio, defined as the proportion of repair costs relative to the building’s replacement cost, as established by Hill & Rossetto [2]. The damage classification thresholds employed in this study are as follows: slight damage (S) corresponds to a lost cost repair of less than 20%, moderate damage (M) to less than 50%, extensive damage (E) to less than 100%, and collapse (C) when the repair costs equal 100% of the lost cost repair. Additionally, structures with no damage (N) are characterized by a lost cost repair of 0%. This methodology provides a standardized framework for evaluating structural damage severity, facilitating consistent and comparable assessments across different structures and scenarios.
Figure 1:Affected regions after the 2014 and 2015 earthquakes and their associated rupture characteristics.

Damage data from the 2014 Iquique earthquake was obtained from a database compiled by MINVU. This database contains housing information regarding 1,218 reinforced concrete, 7,034 reinforced masonry, 366 adobe, and 467 timber-damaged houses (Nds) located in the two regions affected by the earthquake, as highlighted in Figure 1 (Regions I and XV). According to the exposure model developed by Santa María et al. [1], 96,469 houses are located in this region (Nem). Therefore, this database with damage information represents 9,42% of the total inventory of houses. These houses have one or two floors and are between 45m2 and 55m2. It is important to note that this information is self-reported, which means that victims of the earthquake reported damage directly to MINVU. The database provides a comprehensive overview of the distribution of reinforced concrete and timber houses, as detailed in Table 1. Additionally, Figure 2 illustrates the data segmented by MINVU and the study conducted by Santa María et al. [1].
Table 1:Damage information of houses by building class as a result of the 2014 earthquake.

Figure 2:Geographical distribution of houses for the 2014 earthquake (regions I and XV).

The damage assessment data for houses following the 2015 earthquake was sourced from a comprehensive database maintained by MINVU. This database encompasses detailed records of 1,418 reinforced concrete houses, 2,165 reinforced masonry structures, 3,848 adobe dwellings, and 1,249 timber houses affected in the Coquimbo region. According to the exposure model developed by Santa Maria et al. [1], the total number of houses in this region was estimated at 201,402, indicating that approximately 3.69% of the housing stock experienced damage during the seismic event. The affected houses predominantly feature one or two floors and have an area ranging between 45 and 55 square meters. It is noteworthy that the damage reports are self-reported by residents, which may introduce some degree of reporting bias. The data presented in Table 2 provides a detailed breakdown of the number of reinforced concrete and timber houses within the database. Additionally, Figure 3 illustrates the distribution of damage reports as compiled by MINVU and the estimates provided by Santa Maria et al. [1], offering a comparative perspective on the impact assessment.
Table 2:Damage information of houses by building class as a result of the 2015 earthquake.

Figure 3:Geographical distribution of houses for the 2015 earthquake (region IV).

The analysis indicates that in both seismic events, structures constructed with adobe material experienced the most significant damage. Conversely, buildings utilizing reinforced concrete and timber materials demonstrated comparatively lower levels of damage, with reinforced concrete being associated with the least damage among the materials studied. These observations highlight the importance of material selection in seismic-resistant construction, emphasizing the superior performance of reinforced concrete and timber in earthquake-prone regions.
Ground Motion Intensity
Peak ground motion parameters, including Peak Ground Acceleration (PGA), Peak Ground Velocity (PGV), and Peak Ground Displacement (PGD), are frequently employed as Intensity Measures (IM) in empirical fragility and vulnerability assessment studies. These parameters serve as quantitative indicators of seismic impact on structures, facilitating the evaluation of potential damage. In addition to these, spectral acceleration (Sa) and spectral displacement (Sd) at the fundamental vibration period are also utilized as intensity measures. However, their application is less prevalent in practice, as noted in studies such as Rossetto et al. [3]. Among the various IMs, PGA and spectral acceleration at the fundamental period (Sa (T)) are the most commonly adopted for the development of fragility curves, as evidenced by research from Suzuki et al. [4,5]. However, it is important to recognize that these measures do not necessarily exhibit the strongest correlation with observed structural damage, highlighting the need for comprehensive assessment approaches that consider multiple parameters and contextual factors for accurate vulnerability evaluation.
The selection of Intensity Measures (IMs) for estimating fragility curves in this study was based on their availability and reliability. The primary IMs considered were Peak Ground Acceleration (PGA), Spectral Acceleration at 0.3 seconds (Sa (0.3)), and Peak Ground Velocity (PGV). These measures were chosen due to the accessibility of comprehensive recordings and the extensive USGS ShakeMaps, as documented by Worden & Wald [6]. The raw ground shaking data, published by the United States Geological Survey (USGS), are publicly accessible through their official website (USGS Earthquake Hazards), providing detailed point-by-point intensity measure values for various seismic parameters. To facilitate spatial analysis, the point-based IM data were interpolated using Geographic Information System (GIS) software, specifically QGIS (Open-Source Geospatial Foundation project, https://qgis.org). This process generated continuous IM fields across the study area, enabling more precise spatial correlation with structural damage data. The interpolated IM values were then assigned to individual buildings, both damaged and undamaged, based on data from the MINVU damage database and exposure models developed by Santa Maria et al. [1], respectively. This methodology ensures a comprehensive and spatially resolved assessment of seismic intensity, which is critical for accurate fragility curve estimation and seismic risk analysis.
The earthquake that occurred off the northern coast of Chile on April 1, 2014, was characterized by a magnitude of Mw=8,2. The event’s epicenter was situated in the offshore region near Iquique and Pisagua. This seismic activity was significant due to its high magnitude and the potential for widespread impact in the region. The USGS provided detailed information and generated intensity maps, as illustrated in Figure 4, which depict the spatial distribution of seismic intensities associated with this earthquake. On September 16, 2015, other significant seismic event with a magnitude of Mw=8.3 was recorded off the coast of Coquimbo, in northern Chile. This earthquake’s epicenter was located offshore, contributing to its potential for widespread impact. The event was characterized by intense seismic activity, as documented by the USGS. Figure 5 illustrates the intensity Maps results derived from data published by the USGS, providing a detailed visualization of the seismic wave propagation and ground displacement associated with this earthquake. These maps are instrumental in understanding the spatial distribution of seismic intensity and the extent of ground deformation caused by the event. The provided Table 3 illustrates the Pearson correlation coefficients (𝜌), as detailed in Equation 1, across various taxonomies and IM. The analysis indicates that the highest correlation (the value near to 1 or -1) value was achieved using the parameter Sa (0.3) for reinforced concrete and timber residential structures. This suggests a significant relationship between the specified parameter and the structural performance of these building types, highlighting its potential relevance in structural assessment and design considerations.
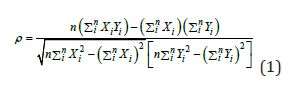
Figure 4:(a) PGA, (b) PGV, and (c) Sa (0.3) maps of the 2014 earthquake.

Figure 5:(a) PGA, (b) PGV and (c) Sa (0.3) maps for the 2015 earthquake.

Table 3:Pearson correlation for each IM.

The analysis indicates that the highest correlation of the IM is consistently observed with Sa(0.3) across all material types. Conversely, the lowest correlations are identified with PGA in reinforced concrete, reinforced masonry, and adobe structures, while PGV exhibits the weakest correlation in timber constructions. These findings suggest that Sa (0.3) serves as a more reliable predictor of seismic intensity across diverse building materials, whereas PGA and PGV demonstrate limited applicability depending on the structural composition. Such insights are critical for refining seismic risk assessments and improving the accuracy of structural response predictions in various construction contexts.
Fragility Curves
Fragility functions serve as essential tools in assessing the likelihood that a structural component, element, or entire system will sustain damage under specific demand conditions. These functions are typically expressed as a probability relative to a single predictive demand parameter, such as story drift or floor acceleration, which are critical indicators in seismic risk assessments [7]. In the context of earthquake engineering, the derivation of fragility curves often relies on the assumption that earthquake-induced damage distributions can be modelled using a cumulative standard lognormal distribution function. This approach is favoured due to its mathematical simplicity and effectiveness in capturing the inherent uncertainties associated with both structural capacity and seismic demand [8,9]. The fundamental premise is that the structural capacity and seismic demand can be represented as independent and identically distributed lognormal random variables. This assumption facilitates the formulation of the fragility function, which mathematically is expressed as follows:
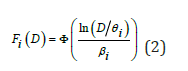
where 𝐹𝑖(𝐷) is the conditional probability that the component will be damaged to a specific damage state “i” or a more severe damage state as a function of the demand parameter D, Φ denotes the standard normal cumulative distribution function, 𝜃𝑖 Is the median value of the probability distribution, and 𝛽𝑖 Denotes the logarithmic standard deviation, shown in Figure 6. The fragility curves estimated in this study were derived using Generalized Linear Models (GLM). This method can be used to obtain both analytical and empirical fragility curves. GLM is commonly used for the regression analysis of discontinuous data. GLM are a variation of ordinary linear regression in which the predictor variable is linearly related to the response via a link function [3,9].
Figure 6:Diagram to calculate the empirical fragility curve of damaged houses at DS 𝑑𝑠𝑗: linear piecewise curve Fj ; and lognormal fragility curve 𝐹𝑗.

The GLM is made up of three parts: (i) a conditional probability distribution of the exponential family, (ii) a linear predictor, and (iii) a link function through which the linear predictor is related to the response [10]. A generic GLMs 𝑔(𝜇) can be expressed as follows
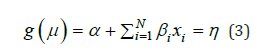
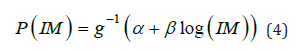
where 𝜇 is the expected response, 𝛼 is a constant, 𝑥𝑖 and 𝛽𝑖 are the 𝑖-th predictor variables, 𝑁 is the number of data, and 𝜂 is the linear predictor, which is related to the expected response through the generic link function 𝑔(∎), in this case, the function Probit as link function. In this paper, Equation 3 reduces to a single independent variable (typically, a logarithmic relation) and two linear coefficients (𝛼, 𝛽), and 𝜇 is the expected probability of exceeding a particular Damage State (DS). Then, the fragility function is developed as
The procedure for fitting a GLM entails estimating the model coefficients that optimize the likelihood function, which is formulated based on the assumptions regarding the conditional distribution belonging to the exponential family. This process involves applying statistical techniques such as maximum likelihood estimation to determine the most appropriate parameters that describe the relationship between the dependent variable and the independent variables within the specified distributional framework. The fitting process ensures that the model accurately captures the underlying data structure, facilitating reliable inference and prediction. Another critical point is to analyses whether it is possible to determine which model provides the optimal fit to the data. The Akaike Index Criteria (AIC) by Akaike [11] is a goodness of fit statistical based on the log-likelihood function with adjustment for the number of parameters estimated [3,12]. The regression model that provided the optimal fit to the data was the model with the smallest AIC value. The AIC values are presented in Table 4. The AIC is defined as
Table 4:AIC values for different house types.

The analysis of the data presented in Table 4 indicates that the most accurate adjustment of fragility curves, based on observed damage, was achieved using PGA for reinforced concrete and reinforced masonry structures. Conversely, for adobe and timber constructions, PGV provided a more precise correlation. PGA serves as a critical indicator of the force exerted on structures, particularly effective in predicting potential damage to stiff, shortperiod buildings such as low-rise concrete or masonry structures. High PGA values typically correlate with increased likelihood of structural damage in these types of constructions due to their resonance with high-frequency seismic waves. PGV provides a more comprehensive assessment of the energy and displacement demand placed on structures, especially in more flexible buildings like timber and adobe structures. PGV is often a better predictor of damage in these cases because it accounts for the displacement and energy transfer that can cause structural failure. Timber possesses a high strength-to-weight ratio, making it considerably lighter than traditional materials such as concrete and steel. This characteristic reduces the overall mass of the structure, which is particularly advantageous in seismic regions. Since seismic forces are directly proportional to the mass of a building, lighter structures inherently experience lower inertial forces during seismic events, thereby enhancing their safety and resilience. Tall or light-framed timber structures exhibit greater flexibility and possess a longer natural vibration period. This flexibility allows such buildings to endure significant deformations without experiencing structural failure. During seismic activity, flexible buildings can absorb and dissipate energy more effectively, reducing the risk of damage and increasing their ability to withstand earthquakes [13].
The structural characteristics of adobe construction reveal a combination of flexibility and vulnerability. Adobe, a dense and brittle material, exhibits low tensile strength, which influences its overall seismic performance. Traditional, adobe structures, particularly those of low-rise design, tend to respond with a degree of flexibility due to their construction methods. The use of mud mortar joints and the absence of rigid confinement systems allow these structures to undergo some deformation under seismic loads, especially in historical or traditional buildings. This inherent flexibility results in a longer natural period compared to modern, stiff concrete structures of similar height, which can influence their dynamic response during seismic events. However, despite this flexibility, adobe structures are inherently vulnerable to displacement and damage during earthquakes. Their low ductility and limited resistance to tensile stresses make them susceptible to large displacements caused by ground motions with longer periods. Common failure modes include wall separation [14], out-of-plane failures, and cracking, which can compromise the structural integrity of the building. These vulnerabilities highlight the importance of reinforcement and modern seismic design considerations when preserving or retrofitting adobe structures for improved resilience against seismic forces.
These findings suggest that the selection of seismic intensity measures should be tailored to the specific construction materials and structural types to enhance the reliability of damage prediction models. Implementing such differentiated approaches can significantly improve seismic risk assessments and inform more effective mitigation strategies across diverse building typologies [15]. The Figure 7 shown the fragility curves derived through this methodology for various construction materials, including reinforced concrete, reinforced masonry, adobe, and timber structures. These curves are presented in relation to different seismic intensity measures: PGA as shown in Figure 7.a, PGV as shown in Figure 7.b, and Sa (0.3), as shown in Figure 7.c. The analysis provides a comprehensive understanding of the structural vulnerability across different building typologies, facilitating improved seismic risk assessment and mitigation strategies.
Figure 7a:Diagram to calculate the empirical fragility curve of damaged houses at DS 𝑑𝑠𝑗: linear piecewise curve Fj ; and lognormal fragility curve 𝐹𝑗.

Figure 7b:Diagram to calculate the empirical fragility curve of damaged houses at DS 𝑑𝑠𝑗: linear piecewise curve Fj ; and lognormal fragility curve 𝐹𝑗.

Figure 7c:Diagram to calculate the empirical fragility curve of damaged houses at DS 𝑑𝑠𝑗: linear piecewise curve Fj ; and lognormal fragility curve 𝐹𝑗.

Conclusion
This study delineates the development of empirical fragility curves for various typology houses, including reinforced concrete, reinforced masonry, adobe, and timber structures. The analysis employs key seismic intensity measures such as PGA, PGV, and Sa(0.3). Data utilized for the derivation of these fragility curves were obtained from post-earthquake surveys conducted following the 2014 and 2015 seismic events, complemented by ShakeMaps sourced from the United States Geological Survey (USGS) website [16]. The methodology involves the application of a generalized linear model using probit function as link function, facilitating the estimation of damage probabilities across different structural types. These fragility functions are particularly applicable for assessing the damage potential of one- or two-story residential buildings with floor areas ranging from 45 to 55 square meters, providing a valuable tool for seismic risk assessment and mitigation planning.
The analysis of the relationship between IMs and observed structural damage was conducted using the Pearson correlation coefficient. The results indicated that Sa(0.3) exhibited the highest correlation with observed damage levels, suggesting its superior effectiveness in predicting damage outcomes. Consequently, fragility curves developed using Sa(0.3) as the IM demonstrated enhanced accuracy in estimating the number of damaged structures. Additionally, the study found that for reinforced concrete and reinforced masonry houses, PGA provided the best fit for fragility curves aligned with observed damage data. Conversely, for adobe and timber structures, PGV emerged as the most appropriate IM for accurately modelling fragility curves. These findings underscore the importance of selecting suitable intensity measures tailored to specific structural types to improve damage prediction models and inform seismic risk assessments.
Looking ahead, ongoing research efforts should focus on exploring diverse methodologies aimed at enhancing the accuracy of structural number estimations. Such continuous work is essential for refining analytical models and improving predictive capabilities within this domain. Future studies should prioritize the development of innovative techniques and the integration of advanced computational tools to achieve more precise and reliable results, thereby contributing significantly to the advancement of structural analysis and related fields. It is imperative to enhance the speed and efficiency of updating the exposure model to ensure it accurately reflects current structural data and relevant parameters, such as materiality and number of floors. An effective exposure model must incorporate the latest information to support precise risk assessment and decision-making processes. In the context of this research, the existing exposure model is deemed appropriate because it was constructed using data corresponding to the same period as the earthquakes under investigation. However, this model’s applicability diminishes for events occurring after 2017, highlighting the necessity for continuous updates to maintain its relevance and accuracy in post-2017 seismic scenarios.
In the context of seismic risk assessment, the current research primarily focuses on the development of fragility curves specific to houses. While these curves provide valuable insights into the vulnerability of houses, there is a critical need to extend this analysis to encompass a broader range of building typologies. Empirical fragility curves for various building types are essential for accurately estimating potential structural damages within urban environments, thereby enhancing the precision of risk evaluations and informing mitigation strategies.
Regarding seismic hazard mapping, the generation of GMPEs tailored to the seismic characteristics of Chile is imperative. The selection of an appropriate IM significantly influences the reliability of hazard assessments. This research highlights Sa(0.3), derived from USGS data, as the most correlatable IM with observed damage in residential structures. However, current GMPEs available for Chile predominantly utilize PGA as the IM, which may not fully capture the seismic demand relevant to structural damage. Therefore, developing and calibrating GMPEs that incorporate spectral acceleration, or other relevant IMs will improve the accuracy of seismic hazard assessments and support more resilient urban planning and construction practices.
Acknowledgement
The authors would like to thank the sponsorship by the Chilean National Agency for Research and Development (ANID) under FONDECYT #1171062, PAI 2017 T7817120013, and by the Research Center for Integrated Disaster Risk Management ANID/ FONDAP/1522A0005 (CIGIDEN).
Declaration
Ethics approval
This article does not contain any studies with human participants or vertebrates performed by any of the authors.
Funding details
The authors would like to thank the sponsorship by the Chilean National Agency for Research and Development (ANID) under FONDECYT #1171062, PAI 2017 T7817120013, and by the Research Center for Integrated Disaster Risk Management ANID/ FONDAP/15110017 (CIGIDEN), as well as financial support by Suramericana insurance company.
Informed consent
Informed consent was obtained from all individual participants included in the study.
Authorship contributions
In the study, contributions were made by Tamara Cabrera, Matías Hube, and Hernán Santa María across various critical phases, including conceptualization, design, and methodology development. Tamara Cabrera was responsible for data collection, specifically surveying damaged houses, and also handled material preparation and statistical data analysis. Additionally, she created graphical visualizations to support the study’s findings. The initial draft of the manuscript was collaboratively authored by Tamara Cabrera, Hernán Santa María, and Matías Hube, with all authors providing feedback on subsequent revisions. The final manuscript received approval from all contributing authors. Furthermore, the acquisition of funding was successfully secured through the efforts of Tamara Cabrera, Matías Hube, and Hernán Santa María, ensuring the study’s financial support and resource allocation.
References
- Santa MH, Hube MA, Rivera F, Yepes EC, Valcárcel JA (2017) Development of national and local exposure models of residential structures in Chile. Natural Hazards 86: 55-79.
- Hill MP, Rossetto T (2008) Do existing damage scales meet the needs of seismic loss estimation? The 14th World Conference on Earthquake Engineering, Beijing, China.
- Rossetto T, Ioannou I, Grant D, Maqsood T (2014) Guidelines for empirical vulnerability assessment, GEM Technical Report. GEM Foundation, p. 140.
- Suzuki A, Iervolino I (2019) Hazard-consistent intensity measure conversion of fragility curves. 13th International Conference on Applications of Statistics and Probability in Civil Engineering (ICASP), Seoul, South Korea.
- Di Pasquale E, Ju JW, Askar A, Cakmak A (1990) Relation between global damage indices and local stiffness degradation. Journal of Structural Engineering 116(5): 1440-1456.
- Worden BC, Wald DJ, Quitoriano V, Pankow KL (2016) ShakeMap Manual. USGS Technical Report, USGS, USA.
- FEMA (2012) Seismic performance assessment of buildings. Methodology, FEMA 1: P-58-1.
- Kircher CA, Nassar AA, Kustu O, Holmes W (1997) Development of building damage functions for earth. Earthquake Spectra, 13.
- Lallemant D, Kiremidjian A, Burton H (2015) Statistical procedures for developing earthquake damage fragility curves. Earthquake Engineering & Structural Dynamics 44(9): 1373-1389.
- Muller M (2004) Generalized linear models. Handbook of Computational Statistics, Springer, Berlin, Germany, pp. 681-709.
- Akaike H (1974) Stochastic theory of minimal realization. IEEE Transactions on Automatic Control 19(6): 667-674.
- Favier P, Quintana F, Magna-Verdugo C, Santa Maria H, Hube M, et al. (2017) Empirical fragility curves of RC buildings in Chile using a cumulative link model. 16th World Conference on Earthquake Engineering, Santiago, Chile,
- Barrientos S (2015) Technical Report on the Illapel Earthquake. National Seismological Center 56(2).
- Calvi GM, Pinho R, Magenes G, Bommer JJ, Restrepo-Vélez LF, et al. (2006) Development of seismic vulnerability assessment methodologies over the past 30 years. ISET Journal of Earthquake Technology 43(3): 75-104.
- Barrientos S (2014) Iquique Earthquake Technical Report.
- Yakut A, Yilmaz H (2008) Correlation of deformation demands with ground motion intensity. Journal of Structural Engineering 134(12): 1818-1828.
© 2025 Tamara Cabrera. This is an open access article distributed under the terms of the Creative Commons Attribution License , which permits unrestricted use, distribution, and build upon your work non-commercially.
Editor In Chief


.jpg)


Signup for Newsletter

Quick Links
 Editorial Board Registrations
 Submit your Article
 Refer a Friend
 Advertise With Us
Our Recent Edition

.jpg)


Top Editors


.jpg)


.bmp)
.jpg)
.png)
.jpg)


.jpg)


.png)

.png)


.png)


Financial Support

Sponsors

Latest e-Books

Latest Video

 a Creative Commons Attribution 4.0 International License. Based on a work at www.crimsonpublishers.com.
Best viewed in
a Creative Commons Attribution 4.0 International License. Based on a work at www.crimsonpublishers.com.
Best viewed in