
- About Us
- Information
-

The Author ensures that the research has been conducted responsibly and ethically with adherence to all relevant regulations. read more..
- For Authors
- For Reviewer
- Manuscript Guidelines
- Membership
- Publication Ethics
-
- Journals
- Reprints
- e-Books
- Videos
- Policies
- Contact Us
 COVID-19
- Submissions


Full Text
Aspects in Mining & Mineral Science
Flash Powder: Introduction, Risks and Experimental Tests
Danilo Coppe1 and Salvatore Impemba2*
1IRE (Istituto Ricerche Esplosivistiche), Via Giuseppe Zanardelli 17/A, Parma, Italy
2CSGI (Center for Colloid and Surface Science), Department of Chemistry, University of Florence, Via della Lastruccia 3, 50019, Sesto Fiorentino (Firenze), Italy
*Corresponding author:Salvatore Impemba, CSGI (Center for Colloid and Surface Science), Department of Chemistry, University of Florence, Via della Lastruccia 3, 50019, Sesto Fiorentino (Firenze), Italy
Submission: April 10, 2024: Published: April 24, 2024

ISSN 2578-0255Volume12 Issue3
Abstract
Flash Powder is now replacing most of the traditional uses that black powder has been reserved for more than a millennium. This is because Flash Powder has significantly better performances for the same quantity and cost. Unfortunately, the advent of Flash Powder in the industrial pyrotechnics sector has been accompanied by a dramatic increase in accidents, in most cases assessed without too much certainty regarding the causes. However, one consideration is undoubted: either all Italian pyrotechnicians have stopped implementing normal precautions or some new risk factor has arisen. In this work, we provide a brief summary of what Flash Powder is and the possible causes that can lead to more or less dramatic accidents. Furthermore, we decided to characterize a commercial aluminium powder to warn craftsmen about the risks and dangers they may encounter using certain types of very fine dust.
Keywords:Aluminium; Flash powder; Explosion; Firework
Introduction
The term “Flash Powder” (FP) refers to a mixture of oxiders and metallic fuels that burn quickly and make a loud noise regardless of their confinement in pyrotechnic field. There are multiple forms of FP, but the main common consists of potassium perchlorate (70 wt%) (KClO4) as oxidizer and aluminium (30 wt%) (Al) as fuel [1]. The Al is a metal very ductile, soft and easily oxidizable. Due to its lack of strength, Al is often used as an alloy. Alloys with copper (Cu), manganese (Mn), magnesium (Mg) and silicon (Si) are lightweight but strong. Al-based alloy is very important in the construction of aeroplanes and other forms of transport [2,3]. Furthermore, being a good electrical conductor, it is often used in electrical transmission lines to replace the more expensive copper. In Table 1 are reported the main chemical-physical properties of this metal [4].
Table 1:Chemical-physical properties of Al.

However, Al dust is classified as a dangerous substance and is provided with a safety data sheet. The greatest dangers linked to the use of Al powder arise mainly from its grain size. However, when exposed to air or in a mixture, is stable as it rapidly coats itself with a resistant layer of oxidized Al (Al2O3) which protects it from further oxidation (passivation); but when this is disturbed by friction or combinations of dense crystalline additives, the chances that the mixture will immediately decompose increase considerably. In addition to Al or Mg powder as a fuel, KClO4 is often used as an oxidizing agent, as it is more stable than others [5], while other salts can be added depending on the desired colour of the fireworks or to make the reaction more reactive and quicker. Fireworks can be coloured from violet (380-400nm) to red (620- 760nm) by adding compounds of strontium (Sr), calcium (Ca), sodium (Na), barium (Ba), and copper (Cu) or metal alloys [6-8]. Instead, although sulphur powder (S) is not a good conductor, it is frequently included because it is easily electrified and can cause instability in the mixture when there is static electricity present [9]. On the basis of fireworks, there is a combustion reaction; when the reaction becomes uncontrolled, it will give rise to a fire or explosion. In reality, these are similar phenomena from a chemical or physical point of view: the marked difference is motivated by the speed of expansion of the combustion products and by the interference exerted by the environment in which the reaction takes place. In chemistry, an oxidation reaction of metal is represented as follows:

where M is the metal that will be oxidized. Gibbs free energy (ΔG) is a state function used in thermodynamics to determine the spontaneity of a reaction at constant temperature and pressure. This is given from the equation [10]:

where ΔH and ΔS are the enthalpy and the entropy difference
between initial and final state, respectively, T the temperature of
the system. Negative values of ΔG mean that the reaction can occur
spontaneously. In a pyrotechnic device, for the reaction to occur the
presence of:
a. Fuel (gases, powders).
b. Oxidizer (oxygen into air).
c. Thermal or electrical trigger.
These three factors make up the “Combustion Triangle” (Figure 1) but are not sufficient to cause an explosion; in fact, the mixture must be composed of a specific fuel/oxidizer ratio and must fall within well-defined limits. Furthermore, the ignition energy measured in Joules (J) must surpass a specific threshold value that is distinct for every substance. The explosiveness of a powder is not a constant property but varies mainly depending on the grain size of the constituents which influences the overall contact surface available for oxidation and heat transfer. In particular, as the average particle size of a powder decreases, the danger of explosion increases, as its dispersion capacity in the air increases, the minimum ignition energy decreases and the concentration corresponding to the lower explosive limit is lowered. Each fuel is characterized by the limit mentioned above, which indicates the minimum concentration at which a suspension explodes; below this concentration the particles are too far from each other, so the heat released by the oxidation of the individual particles is not sufficient to ignite the neighbouring ones and therefore the reaction cannot propagate.
Figure 1:Combustion triangle.

From “bulk” to “nano”
The phase transformation temperature depends on particle size. Generally, this dependence is described as:

where Ttrans-nano and Ttrans-bulk correspond to the transformation temperature of nanoparticles and in passive form, d for particle diameter and α is a constant value that depend on ΔS transformation and energetic surface difference of both phases [11]. The same description, as demonstrate for the phase transformations, is for ΔH of phase transformations. Typical examples are experimental results of Eckbert for Al [12], Lai and Bottani for Sn [13,14] and Suresh and Mayo for Y doped particles with Zr [15]. However, the range of particle sizes where equation 3 applies is limited; in the case of larger particles, Coombes demonstrated that fusion begins in the first 3nm of the surface layer [16]. The existence of this surface layer was also verified by Chang and Johnson through theoretical considerations, concluding that this layer is less ordered than the particle center [17] and its thickness can be estimated through rules of classical thermodynamics [18]. So, the existence of this layer where melting begins is accepted. Now one may also ask whether there is a lower limit of particle size below which equation 3 cannot be applied. A series of experimental results were performed on several metals to answer this question. Castro reported an interesting result on Au nanoparticles which can be summarized in graph of the Figure 2. The results can be divided in two range: the first follows the equation 3, the second which is far from the expected value [19]. The linear fit of the experimental data in both ranges provides an intersection at an inverse particle size of 0.62nm-1, which coincides with a particle size of 1.6nm. Obviously for particle sizes below this intersection equation 1.1 is no longer valid. This or similar phenomenon is described quite often, as for example in the case of Na particles [20].
Figure 2:Melting temperature relative inverse particle size.

In agreement with Castro’s results, lower melting points than bulk material for Sn particles made up of approximately 10-30 atoms were found by Shvartsburg & Jarrold [21,22]. The same applies, of course, to Al, where it is recognized that the risk of explosion is extremely high, especially if the particle sizes are very small, such as those used for the production of FP, because in this case the minimum trigger energy is very low. A strong exothermic reaction that forms Al2O3 is caused by Al reacting very easily with the oxygen (O2) in the air.

The bulk metal is covered with a thin layer of very compact oxide that prevents O2 from spreading to reach the unaltered metal below and continue the reaction. The reaction heat in this case is developed in modest quantities because the exposed surface is small, and also because there is a large mass of metal capable of absorbing the heat. Consequently, the thermal stresses are almost negligible, to the point that the increase in temperature is practically not observable and the process ends naturally. If the material is finely divided, however, the powder burns easily: surface oxidation affects a much higher quantity of material, and since the mass of the particles is small, the heat developed by the reaction is not dispersed and the temperature of the particles increases significantly. This also causes an increase in the reaction speed which can lead to an explosive outcome. The risk of explosion becomes more moderate when the dust consists of particles with a diameter greater than 100μm [22,23]. Furthermore, it is recognized that a cloud of coarse aluminium particles (d>100μm) containing even just a small quantity of very fine particles is easily ignited [24,25].
Passivation of Al nanopowder
Passivation is an electrochemical phenomenon that can slow down or completely prevent the corrosion reaction of metal materials that would otherwise suffer. The phenomenon essentially consists in the formation of a thin film which adheres perfectly to the wall of the surface of the piece in contact with the environment (for example air or water). This layer is made up of corrosion products, metal oxides, substances present in the environment or O2 adsorbed on the metal surface [26]. The mechanism of Al nanopowder passivation and stabilization in different gases and liquid media has been extensively studied [27-30]. Thickness, composition and structure of the passivated layer on the particles are the main differences between nano- and micron-sized powders of Al, regarding their oxidation in heterogeneous media, since they define the diffusion rate of a gaseous oxidant at low temperatures and, moreover, an ignition temperature and the delay period of particle ignition [31]. The structure of the passivated layer for Al nanopowders defines its chemical stability and activity in other oxidation processes. The traditional method of passivation of micron-sized powders is hydrocarbon coating. For example, industrial Al powder with micron-sized flaky particles contains 2-3% by weight of paraffins [32]. Al particles as well as other metallic nanoparticles are passivated, as a rule, with oxide layers having an amorphous or crystalline structure [33,34].
The Al oxide layers are formed on the metal through slow
oxidation in the presence of air and can have different thickness and
different chemical composition, which depends on the passivation
and powder production methods. For Al nanopowder produced
by electro explosion, the thickness is usually within 2 to 8nm [35],
while Al nanoparticles have oxide layers that are amorphous but
tend to crystallize with a defined thickness (7-8nm) during a storage
period of 2-3 years at room temperature in air. In Al powder, the
metal content is substantially reduced by up to 30-50% by weight,
with nanoparticles that are reduced by up to 30nm [36,37]. Thus,
the optimal property combination of metal nanopowders during
oxidation and combustion processes is achieved for particles with
sizes between 100-200nm (fairly high metal content and thin
enough oxide layers). Some oxidized components are not of interest
for energetic applications. However, the Al2O3 content of most Al
nanopowder is more than 10% by weight, while Al powders with
micrometer size contain only 0.5-2.5% of oxide [31]. In theory,
particles with a smaller diameter have a lower metal concentration,
around 30% by weight for a particle of size 10nm. So small particles
(10-20nm) for active metals cannot be stabilized. Al content is 80-
90% by weight in Al nanopowder stabilized with organic reagents
[38]. Investigations into the quality of Al nanopowder should be
focused in two directions:
a. Find the effects of passivating reactants.
b. Metallic content in Al nanopowders.
This is the reason for the interest in powders passivized not by oxide layers, but with active chemical reagents that do not lower the powder enthalpy of combustion. Chemically obtained passivating coatings should be applied during the process that leads to the formation of Al nanopowders or after cooling of the particles, but before they come into contact with the air as they would be immediately oxidized upon first contact with atmospheric O2. Organic and inorganic layers can be applied on the Al nanopowder particles as non-oxidized coatings. As a rule, Al nanopowders coated with Al2O3 are used as reference samples. If one were to take the oxide layer (20-40nm thick) covering the micron-sized particle and calculate the residual metal content for spherical nanoparticles with equal oxide layer thickness, the metal content would be more than 40-60 % by weight. The actual metal content on Al nanopowder is 95 wt% (Figure 3). This indicates a mechanism of inhibition of the oxidation process in Al nanopowder, which is different from the diffusion process [39].
Figure 3:Experimentally determined metal content in passivated Al nano powder and calculated thickness of oxide layers on particles.

Figure 4:a) Non-real case (in argon atmosphere): particle structure before passivation. b) Particle structure after passivation (oxide layer formation).

The electric charge of the electric double layer restricts the oxidation process in the thin layer [40]. The electric double layer’s charge controls the diffusion of the oxidant to the metallica surface [41]. Being different from inert substances, metals in colloidal conditions form oxide-hydroxide layers on their surface. The chemical processes that take place on the metal surface will determine the characteristics of the double-layer electrical structure. Metals are reducing agents and are positively charged in oxide-reduction reactions (Figure 4). The electric current running during the electrochemical reaction, oxidation of the metal with O2 or water (H2O), gives an extra potential, a greater “capacity” called “pseudocapacity” in contrast to the normal capacity of the double electrical layer [42].
Since there is no law that regulates the parameters for which it is possible to sell the powders used in flash formulations, Al powders with a very small particle size can be found on the market, thus leading to an increased risk of triggering and consequently accidents. In this work we decided to characterize a very fine commercial Al powder, on the order of microns, and several experiments were carried out to obtain all the parameters that allow us to assess the actual danger of this dust.
Experimental Section
Granulometric analysis is necessary to understand what type of Al or other powders reaches the pyrotechnics industry. The granulometric analysis of the material is performed with two methods, by sieving and by sedimentation. The sieving is carried out with square mesh sieves and with sieves with circular holes (diameters d1>d2>d3 decreasing towards the bottom) (see Figure 5a and 5b). The dried material is placed at the top of the stack of sieves and subjected to vibrations: the first will stop the material with dimensions d>d1, then the material with d1>d>d2, d2>d >d3, d< d3 will be stopped on its way down, etc. The weight of the individual fractions P1, P2, P3 and PF is subsequently measured, while the overall weight is P.
Figure 5:a) Vibrating sieves. b) Sieves with square mesh of various and decreasing sizes. c) Sedimentation apparatus.

The pairs of diameter and weight values are shown on a graph with the particle size distribution. Since it is not possible to create sieves with openings smaller than 2 microns, it is necessary to resort to grain size analysis by sedimentation. Classification by sedimentation consists of mixing the material with H2O to which dispersants are added to allow the separation of the finest particles and thus allow their decantation. The mixture is inserted into a cylinder (see Figure 5c) so that it is equally distributed, then the particles are left to settle, the sedimentation speed of which will depend on the viscosity of the fluid and the specific weight of the individual grains. A certain diameter is attributed to each fraction of the sample as a function of the speed with which the particles settle, which has been calibrated with the sedimentation speed of spheres having that diameter. The measurements are carried out using a graduated container that is sufficiently high so that an appreciable differentiation appears in the position of the falling particles. At a certain moment t>0 there will be grains of different diameters at different heights; the various diameter bands are determined through density measurements made with hydrometers at various depths. Density therefore establishes the percentage by weight of material associated with a depth and a certain diameter.
Al granulometry analysis
On Al powder, a grain size test with sieves becomes useless, as due to the physical characteristics of the material (extreme aggregability) the sieves themselves immediately clog up during execution, precluding further evaluations. For this reason, it’s better to use the sedimentation test. The test was carried out by adding the Al dust to the aqueous solution with an anti-flocculent agent (sodium silicate: NasSiO3), previously prepared. However, almost immediately, a chemical reaction (see equation 5 and Figure 6) occurred between the components which caused the release of hydrogen gas (H2) and energy in the form of heat, making the execution of the test itself futile. Even using only distilled H2O, therefore avoiding the anti-flocculant, after mixing by hand for 10 minutes and not with the mixer, given that this mixing system would trigger the instantaneous reaction again, within thirty minutes, the solution has started to react again, releasing H2.
Figure 6:reaction between Al dust and H2O during sedimentation test.


All these difficulties are the reason for the lack of literature concerning Al powder. For this reason we had to carry out an evaluation of the granulometry using an optical microscope and micrometric comparator (see Figure 7). There is a “manual” version and an electronic version of the microscope. Al agglomerates of 2-3μm Al agglomerates were observed by manual microscope, suggesting that even the individual metal particles are smaller than this size (Figure 8).
Figure 7:a) Optical microscope. b) Comparator.

Figure 8:Al powder magnification: a) 100x; b) 400x.

Figure 9:Analysis size distribution report.

However, having to find the correlation between particle size and activation energy (Ea), we also carried out a particle size analysis in laser diffraction, in dispersion, with organic solvent and a “particle metric” analysis with a Scanning Electron Microscope (SEM) with particle size distribution. On a FP sample sold by a supplier of raw materials for the pyrotechnics industry, the results were as follows (Figure 9). The grain size analysis highlighted a scale of grain size values, in the case of KClO4 all less than 64μm, while for Al both the laser diffraction analysis and the image analysis via microscopy SEM (see Figure 10) demonstrated the presence of particles smaller than 1μm (3%). Therefore it is evident that the powder supplied has extremely small particle size percentages for which minimal activation energies are sufficient. Suppliers could therefore eliminate the smallest parts without altering their effectiveness but drastically reducing the risks of handling. It is clear that the separation process of the finest dust would have considerable costs. However, every precaution is considered a priority in order to avoid accidents which, when they occur, make us regret having made too much savings on raw materials. This aspect is therefore of particular importance also for the prevention of future accidents.
Figure 10:SEM images of Al (magnification 5300x).

KClO4 granulometry analysis
Also in this case the sample comes from a pyrotechnic supply. Since this material is a soluble salt, the tests were carried out exclusively in dry conditions. After a mechanical screening in the series of ASTM screens lasting fifteen minutes, the salt passes almost completely through the screen with mesh size 200 mesh (0.074mm). The tested sample weighed 502.1071g. As can be seen from the test results reported in Table 2, since the quantity of dust retained at the 200 mesh is insignificant, as it is therefore a particularly fine material, the determination of the relative grain size can only be carried out by means of a sedimentation test. But even this test cannot be performed for the material in question due to its solubility in H2O. However, we believe that the danger of flash dust does not derive from the granulometry of this salt, as it is soluble in H2O and hygroscopic, and therefore even the minimal presence of humidity in the air compensates for the hypersensitivity due to its minimal dimensions. This cannot be said for Al powder as it is insoluble in H2O.
Table 2:Analysis granulometry report on KClO4 sample.

Oxygen and humidity
Figure 11:Pressure trend over the time of an explosion.

To establish the danger of explosive dust in air, it is necessary
to measure the evolution of pressure over time, which reaches its
maximum very quickly, in the order of tenths of a second. This also
depends on the correlation between O2 and humidity. The pressure
trend during a controlled explosion is represented in Figure 11
(from UNI EN 26184). Two indices are determined:
a. Explosion index pm: maximum pressure achieved.
b. Explosion index km: maximum pressure increase speed.
The pressure trend of an explosion for an Al powder is very violent; in fact, pm and km achieved values of 12.4 bar and 620 bar m/s, respectively. The increase in the O2 content in the oxidising atmosphere enhances the fallibilities of the dust which ignites more easily, burns more rapidly and produces more violent effects than occurs in air alone. Figure 11 shows the pm index with respect to the oxidising O2 content. At O2 concentrations lower than 10%, the pressure developed during the explosion is relatively low because the reaction is confined to the ignition zone, and therefore there is no propagation of the flame front. If the O2 content is between 10 and 15%, the reaction zone enlarges and begins to propagate. When the O2 percentage exceeds 16%, the reaction occurs with explosive violence. Figure 12 below shows the pressure developed in the atmosphere compared to the O2 content: it is reduced by a factor of 1.4 going from 21% to 15% by volume of O2, and by a factor of 2 going from 21% to 8% O2 by volume.
Figure 12:Pressure developed in the atmosphere in relation to the O2 content.

A humid climate reduces the possibility of explosions: humidity can cause agglomeration of particles together, thus increasing their diameter; furthermore, evaporation removes part of the heat developed by the reaction from the dust. However, in according to the reaction reported in equation 5 mentioned above, it is important to highlight that Al could react with the 2O present in the air, releasing both H2 and heat (27g of Al is enough to generate a quantity of heat equal to 256.74kcal). Therefore it is a highly exothermic reaction which leads to a rapid increase in temperature of the particles involved and significantly accelerates the course of the reaction. It should be noted that the H2 that is formed is also flammable. The reaction has a very negative ΔG value (-928.43KJ/ mol) and is therefore spontaneous. However, the Al2O3 coating protects the metal from contact with H2O, so an ignition of the Al dust due to reaction with humidity in the air is unlikely.
Activation energy
From what has been said so far, it appears that Al with a very fine grain size can be easily ignited as it has a very low ignition energy. While for black powder [43,44] and denoting explosives [45-47] there is a vast and rich scientific literature, the mentioned FP is a product without literature. The only “specific” text in the world is “The Complete Book of Flash Powder” by Paul Moran, self-printed in Branford, USA, in 1993 [48]. However, in terms of technical data, the book is incomplete. An interesting piece of data was obtained from the experimentation of the Italian Navy but relating only to the combustion speed of the FP once triggered (Figure 13). Some texts lavish on warnings about the possible dangers when handling FP and its components [49]. It is known that its reactivity to triggering, even with modest activation energies, makes each phase of use, therefore processing/handling/transportation and storage, particularly full of pitfalls. A recurring data in the literature concerning very fine powders in general is that concerning the Ea, as also reported in the Table 3 below [50].
Figure 13:combustion speed of FP.

Table 3:Characteristic data of metal powder explosions, aFor “atomized” means a powder whose grain dimensions are <50μm, bRefers to a concentration of 500mg/l.

In Table 3, the Al values refer to the metal without a specific
granulometry, but only <50μm. Talking about activation energy it is
therefore necessary to make an excursus on all the possible trigger
causes. According to all bibliographical sources, the causes of dust
explosions (explosives par excellence and otherwise) can be the
following:
a. Open flames (cigarettes, matches, lighters, etc.)
b. Heat
c. Static electricity
d. Electrical short circuits
e. Electrical arcs and sparks
f. Friction
g. Air discharges
h. Spontaneous combustion (extremely rare)
i. Ignitors/Detonators
All options that cannot be excluded a priori must always be analysed, in case of an accident due to premature activation.
Open flames: any open flame, even a modest one, activates the FP.
Heat: a temperature of 700 °C determines, on contact, the ignition of the Al powder. While for the mixture with KClO4 the ignition temperature drops to 250 °C. The test was carried out roughly, by heating a sheet of metal and measuring the temperature with a laser pyrometer (see Figure 14).
Figure 14:Heat test.

Static electricity: is a physical phenomenon with a thousand variables, which is why it is little covered in the literature. It is produced by the movement of electrons; if two materials are rubbed together the electrons transfer from one material to the other. A good example that everyone has experienced at some point is the sparks caused by synthetic fabric rubbing against the wearer’s body. Since synthetic fabric is an insulating material, electrons accumulate on its surface. When the potential difference is high enough to overcome the dielectric strength determined by the air space between the tissue and the body, then a spark will be produced, and the tissue will “release” its charge in an instant. What we perhaps don’t realize is the enormous energy that is discharged to the ground at that moment. A person can also become charged with static electricity by standing next to a charged object or by friction. The capacitance of a man, dressed in synthetic fabric clothing, can be around 300 pF to ground. The charge generated on the soles of shoes, or the surface of clothing induces static electricity throughout the body and the charge can reach high voltage values. Under particular conditions, values above 15.000V can be recorded. Voltages of 1.500V are commonly reached.
If an individual is charged electrically at 1.500 V his energy will be:
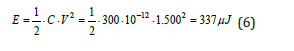
It would seem like a rather sufficient amount of energy but just think that 260μJ is enough to trigger a molecular energy like propane. Static charge grows in dry air conditions, as can happen outside in cold, dry weather conditions or inside when central heating or air conditioning is in operation which greatly reduce ambient humidity. If we also add the presence of wind, the friction generated by the movement of air against the human body (not necessarily outside; even an open window that allows entry and internal movements of the air mass is sufficient), the potential can rise even up to 4.000V. In that case, the energy will be:
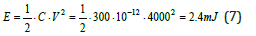
i.e. a value that is already an order of magnitude higher than the previously derived value.
As already noted, this behaviour is a characteristic of all materials, therefore it is observable, in addition to humans, also in inanimate materials. And it is, moreover, more observable with the increase of the specific surface involved, so that it can be defined in function of the surface development. For this reason, it will be necessary to observe all the materials which, in relation to their volume, offer a greater specific surface area, the finer the dust, the greater its properties. Resistivity is the chemical-physical property of materials that measures the resistance offered by the material to the passage of current and is a function of the moisture of the material. This property provides indications on the ability of a substance to accumulate electrostatic charges. Industrial powders are generally bad conductors of electricity and tend to accumulate static electricity during various processes: grinding, micronization, mixing, sieving, filtration, fluid bed drying, pneumatic transport and mechanical transfer.
In order to predict the behaviour of dust from an electrostatic point of view, it is useful to know the relaxation time (t), which by definition is the time necessary for a material, electrostatically charged, to lose about 37% of the initial charge. The t depends linearly on the volume resistivity r and the material and dielectric constant according to the following relationship:
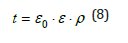
Where: ε0=8,85 10-12 ε=dielectric constant ρ=material resistivity
The value of the ε for the generality of materials is between 1 and 10, and at most varies by an order of magnitude; therefore the time of relaxation, as from the previous relationship, depends in practice on the resistivity that can vary in a wide range, from 10-8Ω∙m of copper (Cu) to 1018Ω∙m of teflon. The knowledge of ρ provides an indication of the danger of processed powder since a high value means a relatively high decay time of the charge; in practice, dusts with a t of more than about 1s or with a ρ greater than 1010Ωm are considered to be dangerous.
The ρ and t data for certain powders are reported in Table 4. If the dust ρ is known, a conservative resting time can be calculated to remove much of the dust charge (t≥5t). The resting period technique can be used to ensure that the dust to be collected in a flammable atmosphere is electrically neutral. The t of the charge in some powders can be very long (hours or days), the dust can remain charged if the materials of the containers or their casings are insulating. To this assessment of activation energy can be added the potential generated by technological tools such as mobile phones, now supplied to each individual. The Regional Environmental Prevention Agency of Emilia Romagna (ARPA ER) has evaluated the interactions of the electric field generated by different technological tools used by citizens for voice and data communication (see Table 5), in addition to equipment that uses micro-TV signal repeaters, radio-controlled equipment (gates, alarm systems, toys, etc.) [51].
Table 4:t and ρ of several materials.

Table 5:Electric field values for several cellular model (distance to contact with skin: 1cm).

Using the most precautionary data (model Samsung GT-S 5230) in the most severe conditions, it shows that emissions reach a peak of 10.1V/m at a contact distance (assumed to be 1cm). Therefore, the value of electric field emission, in terms of potential, reaches a value of 1.01V. In consideration of the current circulating inside a cellular device (generally around 5mA) a power of 5.05mW is obtained. Transforming this value into Ea, assuming that this emission takes place in a time equal to 72ms (usual time of connection of a device to the mobile network, in the absence of wi-fi networks), you get a value of 364μJ, value comparable with the electrostatic potential generated by a human body subjected to rubbing by electrostatic charge. Summing the energies obtained, namely the electrostatic potential of an individual dressed in synthetic clothing in a room with at least one open window, on a windy day and with relatively low relative humidity, with a cell phone nearby that is connected, and you get an energy value of 2.76mJ for individual. This value must then be compared with the Minimum Ignition Energy (MIE) of the atomized Al [52]. The MIE is also profoundly influenced by particle size, as shown in Figure 15 below for two different types of dust. Generally speaking, the MIE is proportional to the cube of the particle diameter [53]. Figure 15 shows that the MIE of Al powder, for particles of the order of 10μm, is equal to values around 5∙10- 1mJ.
Figure 15:Minimum ignition energy relative to the median particle size.

Figure 16:Minimum ignition energy relative to the Al particle size.

Considering the dimensions of the Al in the sample under examination, which vary between 6 and 13μm, it is necessary to resort to least squares regression to establish the possible correlation between the trend of the points and thus find the energy value relating to the Al reduced in these dimensions. This method is based on the assumption that a set of “observed” points can be described by a function (that is, subtending a dependence between the variables, typically X and Y, in a Cartesian plane) represented by an “optimal curve” (or “regression curve”) which comes as close as possible to a set of data (typically points on the plane). In particular, the function found must be that which minimizes the sum of the squares of the distances between the observed data and those of the curve representing the function itself. As can be seen in Figure 16, this regressive reconstruction was extended only to the first part of the curve, i.e. for values with dimensions lower than 80 μm, reconstructing the regression line to be able to establish the value of the MIE of Al for sputtering values equal to approximately 10μm.
Figure 17:a) Test procedure. b) Instrument used.

The value obtained is equal to 4.64mJ, therefore perfectly in line with what was reported in the literature by R.K. Eckhoff. This value, added to the previous values, comes dangerously close to the minimum value of the trigger energy, for example, of atomized Al (Emin=10-50mJ). However, the evaluation made so far is not complete as it is based on the energy of an individual in “rest” conditions, i.e. not carrying out any activity. If the individual is intent on mixing different powders, carrying out the operation produces rubbing on an insulating surface of large masses of grains that rub against each other. This is certainly a cause for the production of energy from static current. To understand the extent of this, we carried out a series of experiments always using the powders supplied for pyrotechnic use.
In a well-equipped laboratory we initially tried to reproduce on scale the mixing operations as established by the standard procedures of fireworks factories, which involve the use of sheets of kraft paper to manually mix the gun powders (see Figure 17a). We recovered a sheet of kraft paper and tested various powders on it. Following the movement of the powder on the paper with both an analogue and a digital analyzer instrument (see Figure 17b), from SIMCO and SMC supplier respectively, we carried out the measurements of the static current produced. It is known that any “rubbing” can generate electrostatic currents. This was all done on tables isolated from the ground. Insulating shoes, i.e. not antiexplosion, were worn to recreate the worst conditions. The values, according to the manufacturers’ instructions, were measured at a distance of one inch (approximately 2.54cm). The result was the absolute lack of surges in the electrostatic value to reduce the dust tested. Proving that the mixing on kraft paper system still allows for a discharge of electrons. Instead, significant electricity peaks are obtained if the rubbing occurs on synthetic materials, such as Polyvinyl Chloride (PVC) or similar bags or containers.
After this first result, the tests were repeated by inserting the powders, mixed or not, inside a container made of material similar to that in use in every fireworks factory to move the material and take it from one department to the next. The tests gave results with a certain impact; in fact the values measured reached and exceeded 3.5kV (see Figure 18). The same test was also repeat on KClO4 which gave -1.5kV as result. Which means that a potential difference of 5kV is created between the two powders.
Figure 18:a) Pouring the aluminium powder into the container. b) Measurement immediately after pouring.

The tests were carried out using approximately 50g of powder. Since the static current is a function of the number of particles that solicit each other, it would not be wrong to hypothesize that a value of 3.5kV for 50g corresponds to a theoretical value ten of times higher for the kilos produced during the production phase. However, to be very conservative, calculations were carried out relating to the potential of 5kV, i.e. relating to only 50g of dust. So, by adding the basic energy of an individual on a windy day and with a cell phone in his pocket, a result of 16.79mJ is obtained, which is a value that is absolutely comparable, in terms of order of magnitude, with the minimum energy of even atomized Al powder alone. In conclusion: if you can get to the Ea by mixing 50 grams of powder, let alone mixing a few kilograms of it.
Electrical short circuits: Global legislation requires that rooms in which explosives are stored or processed or in ATEX risk environments have shielded electrical systems. However, it is clear that a short circuit has sufficient ignition energy.
Electrical arcs and sparks: this hypothesis is closely linked to static electricity. We have demonstrated that the working conditions were such as to generate an adequate potential difference to develop the trigger energy. This therefore occurs through an electric arc for which the relative energy of this arc or electric spark must be added to understand whether it is of adequate power. Even though it reaches a minimum energy value to be able to activate, the mixture in question actually requires an actual coupling. An adequate trigger is required for every commercial explosive, from dynamite to black powder. If dynamite needs a very high energy source to trigger, to activate the FP the quantitative amounts of energy are, as we have seen, truly modest. Since the quantities involved are a few millijoules (mJ), a spark due to static electricity accumulated in the surface of a synthetic fabric leads to the development of light and heat whose values are not appreciable to the eye and touch. A Joule (J) is a quantity of energy. If a Volt (V) pushes an Ampere (A) through a circuit, for a second, a J of energy has been used and converted mainly into heat. So if you connect a 60W bulb, which takes 5A, to a 12V battery for 10 seconds, 600J of electricity is converted into heat and light. So in ignition circuits, time is of the essence. The time from “spark” to “combustion complete” is of the order of two milliseconds (2 thousandths of a second). The spark exists for a much shorter time, in the order of microseconds, and the faster you go the less time there is for anything (a microsecond=1 millionth of a second). A 12V coil could take 3A, and that would be 36J in a second. But only when the points are closed. Part of this energy is stored in the magnetic field of the coil. The remainder dissipates as heat. As the points open up, that field collapses and its energy is transferred to the plug slot at a very high voltage. Something like 20.000V, but only for a few microseconds. Energy calculations for the spark will involve kilovolts and microseconds, and the result will be in mJ. According to what has been said so far, therefore, it is easy to realize that in the conditions we have examined the energy involved is more than sufficient to trigger the spark, since the reaction times, as already reported, of the order of a few tens of milliseconds if compared with the potential difference values, they can reach the minimum value for the spark to occur, i.e. the ignition. For it to develop, the spark energy must be at least 0,2mJ but, in truly unfavourable conditions, this value could rise to 15mJ.
From what has been reported up to this point and from the data available in the literature, it is easy to deduce that this value could be widely exceeded and there could be conditions for an “over energy” available and even greater conditions for the development and progression of the phenomenon.
Friction: In this case, friction can generate significant energies. The main way to develop could be to use tools NOT made of nonsparking material. Other systems for generating mechanical sparks could derive from the fall of heavy metal objects onto the clinker floor.
Atmospheric discharges: global legislation requires that a Faraday cage be present in rooms where explosives are stored or processed. However, it is clear that the ionisation of the air, when a storm approaches, can increase the values referred to in point Static electricity.
Spontaneous combustion: rather than a spontaneous “combustion” effect, we examine the circumstances under which a violent chemical reaction may occur as a result of contamination with other substances or that these significantly lower the stability of the original mixture. Also in this case, not many research are reported in literature as regards the compositions and the possible reactions that can take place between the substances present. The only certainty is that the elements and their salts used in this field are all equipped with their own safety data sheet, as dangerous. From this it can be inferred that if the same substances are found in a mixture, they retain their dangerousness, if not that this is increased by the others present. The criticalities of the compounds used in the creation of FPs are well known by those who work in the sector for years; however, the unexpected can in any case present itself even to the most experienced. Flash Powders are generally composed of Al powder and/ or Mg and a strong oxidant such as KClO4, much more used than chlorate, as more stable, although also to be treated with due caution. As already reported, other substances can be added for the colouring of fireworks or to make the reaction more reactive and faster. Considering the criticalities of chemicals often present alone or in a mixture, we can summarize their characteristics with regard to a possible spontaneous reaction.
a) Al powder: has a minimum self-ignition temperature
(minimum temperature at which a fuel/oxidizing mixture ignites
spontaneously, without trigger) of 650 °C and a lower limit of
explosion of 45mg/L. Each fuel is characterised by a lower limit of
explosivity, indicating the minimum concentration of fuel at which
a suspension explodes; below this concentration the particles are
too far apart, so the heat released by the oxidation of the individual
particles is not enough to ignite the nearby ones and therefore the
reaction cannot propagate. It is generally recognized that the risk
of explosion for Al dust is extremely high, especially if the particle
size is very small, because in this case the minimum ignition
energy is very low. The risk of explosion assumes more moderate
characteristics when the dust consists of particles with a diameter
greater than 100μm. However, it is recognized that a cloud of
coarse Al particles (d>100μm) containing even a small amount of
very fine particles is easily ignited. Another factor to consider is
the condition of the surface layer of the particle, since passivation
decreases the reactivity so that, for particles exposed to air, the
minimum explosive concentration tends to increase. The minimum
self-ignition temperature depends on the following factors:
i. air dispersion conditions: airborne dusts which are
homogeneously or heterogeneously dispersed or deposited
dust.
ii. moisture content: an increase in the moisture content causes
an increase in the self-ignition temperature.
iii. boundary conditions which depend on the volume of the
container in relation to the amount of dust and the nature of
the walls.
In addition to having the criticisms already expressed about static electricity, Al powder has a high affinity for O2 and H2O as mentioned above, and can lead to exothermic reactions, which release heat, while also producing flammable gases such as H2.
b) KClO4: strong oxidizing agent that could explode as a result of strong shocks; it can be demonstrated that its decomposition can occur:

From a thermodynamic point of view, the decomposition of 138 grams of KClO4 generates a heat amount of about 0,93kcal. However this is quite unlikely; in the literature there are several kinetic studies, through Thermogravimetric Analysis (TGA), on the decomposition of KClO4, which show how its eventual decomposition could happen spontaneously only at temperatures above 580 °C [54], (Figure 19). Being a strong oxidizing agent, perchlorate could easily oxidize Al, releasing a heat amount of about 1724kcal/mol, depending on the reaction:
Figure 19:TGA curves of KClO4 at several heating speed (from 5 to 20 °C/min).


The reaction has a ΔG=-7256.8KJ/mol, so it is spontaneous. Although the reaction is strongly exothermic, the mixture is however stable to air if not triggered. A mixture of these compounds must be treated very carefully being so dangerous. However, mixing alone is unlikely to cause spontaneous combustion unless there is friction to produce a localized increase in temperature.
c) Sulphur (S): natural powder or “sulfur flour”, is used in pyrotechnics as a fuel. It is also used in white smoke compositions. S is not a conductor but is easily electrifiable, so in the presence of static electricity can fuel the instability of the flash composition. The reaction of S with moisture in the air does not take place:

Thermodynamic calculations show a ΔG=195.01KJ/mol, so the reaction cannot occur spontaneously. Mixtures containing S and KClO4 are generally sensitive to shock and friction. Perchlorate oxidizes S and two different reactions can occur:
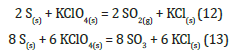
Since perchlorate is a very strong oxidizing agent, reaction 13 is more likely to occur than reaction 12 (thermodynamic calculations confirm this hypothesis: under normal conditions ΔG13<ΔG12). Thermodynamic calculations show that both reactions are strongly exothermic (reaction 13 produces 763.2kcal/mol) and spontaneous (ΔG13=-3612.8KJ/mol). However, they have high Ea and for this reason the reactions do not take place unless triggered thermally or by a percussion.
d) Criticality of the chemical substances present in the mixture: as mentioned above, in pyrotechnics are used chemicals to obtain different plays of light; changing the salt of the metal used will change the visible colouring.
The compounds most commonly used are:
I. compounds of Sr and Ca for the red colour.
II. Na compounds for yellow.
III. Ba salts of a green colour.
IV. Cu salts for blue colour.
Antimony trisulfide (Sb2S3), a compound also equipped with a safety data sheet and classified as a dangerous substance, is not only used to give a very shiny silver colour but is also found as a sensitizer in flash powder mixtures. Mixed with an oxidizing compound, it makes it generally sensitive to shock and friction; moreover, if the composition is also present KClO4 becomes much more sensitive to friction, making the whole more unstable. A further critical issue to consider is its crystalline shape, which tends to be abrasive against the Al2O3 coating, so this could lead to a sudden ignition. In literature, however, there are no studies that illustrate the reaction of Sb2S3 with other substances that make up the pyrophoric mixture. On the other hand, barium nitrate (Ba(NO3)2), used to obtain green lights, reacts with Al powder according to the reaction:

The reaction is strongly exothermic (ΔH=-997,16KJ/mol) and has a ΔG=-450,8KJ/mol, so it could happen spontaneously. However, there are kinetic studies in the literature showing that an Al/Ba(NO3)2 mixture is stable to air even up to temperatures of 600 °C and therefore spontaneous ignition is highly unlikely [55]. In conclusion the addition of salts can change the stability of a pyrophoric mixture but can hardly contribute to a spontaneous ignition of the powder without the presence of a trigger (Figure 20). The same applies to the decomposition of the substances used in the pyrophoric mixture or their possible reaction with the chemical species present in the air.
Figure 20:DSC curve of an Al/Ba(NO3)2 mixture (weight ratio: 17/83).

Ignitors/Detonators: It is clear that the energy of a pyrotechnic igniter can trigger the FP, even more obvious a detonator.
FP effect test
It can often be read that FP detonates. This is a mistake! Detonation is a physical phenomenon involving explosives or explosive mixtures with a reaction rate of thousands of meters per second. The deflagration instead provides speeds on the order of hundreds of meters per second. The energy administration of detonation and deflagration differs, and the first case is characterized by a strong shock wave. An explosive explosion can, however, recreate a “pseudo-detonation” if placed in a confined environment. In this case, his performance becomes similar “in effects” to a detonating one, although his, a deflagration. The distinction between deflagration and detonation is not solely based on the speed of the phenomenon, but also on two fundamentally distinct propagation systems. The propagation of deflagration occurs through thermal conductivity, starting from the outer surface of the mass (usually granules) and proceeding inward. Finegrained powders (which have a larger surface area per unit weight) have a shorter reaction duration, resulting in different garniture corresponding to different deflagration rates. The destructive effects are less important (naturally with equal mass) because these speeds are always much lower than those of detonation. Therefore the two explosive reactions also have different methodologies for measuring speed and pressure.
To measure the rate of detonation of a detonating explosive there are clear and proven methods. The Dautriche test is widely accepted due to its simplicity and practicality, as it only requires minimal equipment. The two ends of a section of detonating cord of a length to be measured precisely and of which the detonation velocity must be precisely known, shall be attached to a cartridge of the explosive to be tested near the ends. The central part of the fuse, which is turned around a shelter, is secured on a lead plate, on which a sign is placed at the middle of the fuse. By triggering the cartridge at one end and making it shine, it detonates first the end of the fuse closest to the trigger and then the other end. The two explosive waves that run along the fuse in the opposite direction leave a notch on the lead plate where they meet; then measuring the length of the cartridge between the two attacks of the detonating cord and the distance of the notch from the mid-point of the fuse (lm), making it easy to equate the times taken by the detonation to cover the cartridge section (lc) and the fuse, you get:
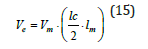
The explosive’s detonation speed is Ve, and the fuse’s detonation speed is Vm. Electronic systems can also be employed to make this determination. It involves producing two electrical signals, one starting for an electronic chronograph when the detonation affects a point near the triggered end of a cartridge, and one stopping, when the detonation reaches a point close to the other end of the cartridge: the detonation speed is determined by knowing the distance between the two points and the time (determined to the nearest millionth of a second).
The deflagration speed limits, on the other hand, are not well specified because they depend on various factors: in fact, in addition to the graniture of the powders, they influence the magnitude of the trigger, the density of the charge, the diameter of the charge, temperature, humidity, etc. The most scientifically unassailable instrument for measuring the rate of explosion is the so-called “manometer bomb”. Unfortunately in Italy there were several, also placed in public bodies available to allow tests. Budget cuts have resulted in the inefficiency of such equipment due to the significant cost of the associated measuring instruments. Therefore, after long research, we had to adopt a less scientific method even if in any case standardized. The proposed method was the result of consulting the literature in the technical library of the Istituto Ricerche Esplosivistiche of Parma, entitled: “Classification Procedures, Test Methods and Criteria relating to Class2, Class3, Class4, Division 5.1, Class 8 and Class9”, UN 2015 [56]. A method that finds analogy also in the specific literature as the most complete text: “Black Powder Manufacturing, Testing & Optimizing” of Ian von Maltitz [57]. Both proposed methods involve the creation of a profile that contains an exact amount of the explosive powder to be tested. This is then laid on a low thermal conductivity surface and activated with adequate ignition energy. All subjected to a speed meter.
Since the pressure produced by the exploding material is also determined, it goes without saying that the “contact strip” used for the test results in a negligible specific pressure. The above test has been integrated with the measurement of the pressure of a complete artifice among the most common with the use of FP that is the so-called “dark shots” which are those particular shots that are generally used in the opening and closing of fireworks shows. It is recalled that while for the black powder and the detonating explosives there is a wide literature and therefore one could also think not to make tests because the technical data on the “finished” products are standard and known, with flash-loaded ordnance, you’re dealing with exploding materials that lack specific reference literature. A high-speed chamber and an air blast meter (specific pressure exerted by an explosion) were used for speed detection. Both devices are “certified” and owned by the Istituto Ricerche Esplosivistiche. The camera used was an AOS VIT Cam HS serial number 01200410. The air blast sensor and the acquisition unit were by Free-Field ICP, Mod. HBMS/FLY 137/22. Both devices have been certified, revised and calibrated at HI-TEC in Milan. Below a series of photos taken during the test are reported (Figures 21-24), [58].
Figure 21:a) Kevlar helmet and bib. b) AOS camera. c) “Template” for placing the dust. d) Air blast sensor (1 meter from the “dark shot”). e) Mobile instrument acquisition centre.

Figure 22:a) Streak of FP. b) Panel after power on.

Figure 23:sequence of “dark shot” explosion.

Figure 24:Frames relating to FP ignition.

As for the pressure tests of the FP, in a confined environment, we extracted the data directly from the control unit of the air blast sensor; this because, as already written, in an open environment, with this type of test, the pressure effect is physically negligible. While confined in the casing the exploding material produced a pressure value very close to what was expected, that is, a value between 2.18 and 2.37 bar (having repeated the test with two “dark shots”). As for the speed of the bulk dust, it was necessary to set a calculation based on the shooting sequence and the number of frames per second used. From the slider scroll, between the beginning and the end of the phenomenon we had 60 frames. Knowing we had captured each image at 1/8000 of a second, we can trace the duration. 60 frames have been acquired, multiplied by 1/8000 of a second to show that each frame corresponds to a duration of 0.0075sec (0.000125sec∙60 frames). The known fact is that the sample is 25cm long [59]. (so to make a meter you multiplied the value by 4). From these results, it can be stated with sufficient precision that the burning rate of the FP under test is 33m/s (1/0.03) (Figure 25). What has been obtained in terms of measurements is obviously not certifiable because the “performance” of a pyric powder, in the open air, varies significantly depending on the weather conditions (that is why the manometer bomb would have been useful). In this case, in order to make repeatable (as much as possible) the speed tests of the flash dust, we carried out the tests under the monitoring of a portable meteorological unit. The temperature of the tests was between 11 and 16 °C with a humidity of 72%.
Figure 25:HS frames of the sequence FP ignition.

Conclusion
In this work, we have characterized a commercial Al powder
and carried out tests with it to understand its actual danger if not
handled with caution. A series of considerations are made on the
possible causes of ignition of this powder, in order to take the right
precautions in order to avoid accidents. Based on the bibliography
and our experimental results, we can affirm that the most classic
errors that can lead to tragic events are:
a. Bring your mobile phone within the department.
b. Do not wear anti-static or anti-flare shoes.
c. Not having provided for the use of antistatic bracelets.
d. Failure to provide for a table to discharge static currents to the
ground.
e. Not having installed a discharge plate at the entrance of the
department.
f. Use of the room for the storage of other chemicals
g. Use a non-insulated metal building as a raw material repository.
h. Use products sold in the wrong container.
i. Use tools made of non-sparking materials.
j. Use products marketed with incomplete safety data sheet.
All these errors, some more and some less, can be combined as a causal link, and it is therefore good to try to limit them as much as possible in order to avoid unpleasant events by handling this powder.
References
- Kosanke KL, Kosanke BJ, Sturman BT, Winokur RM (2012) Encyclopaedic dictionary of pyrotechnics: (and related subjects), pyrotechnic reference series No 6. J Pyrotechn p. 493.
- Dursun T, Soutis C (2014) Recent developments in advanced aircraft aluminium alloys. Mater Des 56: 862-871.
- Alam T, Ansari AH (2017) Review on aluminium and its alloys for automotive applications. Int J Adv Technol Eng Sci 5(5): 278-294.
- Haynes WM (Ed.), (2014) CRC Handbook of Chemistry and Physics. (95th edn), CRC Press/Taylor and Francis, Boca Raton, FL, US.
- Johnson WH, Gilliland AA (1961) Heat of decomposition of potassium perchlorate. J Res Natl Bur Stand A Phys Chem 65:(1) 63-65.
- Shimizu T (1999) Selected pyrotechnic publication of Dr. Takeo Shimizu, Part 3, studies on fireworks coloured-flame composition. J Pyrotech.
- Memmel P, Lederle F, Softje M, Koch J, Li M, et al. (2022) Customizing the appearance of sparks with binary metal alloys. ACS Omega 7(32): 28408-28420.
- Kanitkar S, Haynes D, Sabolsky EM, Chorpening B (2023) A review of coloured light production by pyrotechnic materials. Propellants Explos Pyrotech 48(11): e202300012.
- Mocella C, Conkling JA (2018) Chemistry of pyrotechnics. (3rd edn).
- Gibbs JW (1873) A method of geometrical representation of the thermodynamic properties of substances by means of surfaces. Transactions of the Connecticut Academy of Arts and Science 5(2): 382-404.
- Vollath D (2008) Nanomaterials: An introduction to synthesis, properties and applications. (2nd edn), Wiley-VCH Verlag GmbH, Weinheim, Germany.
- Eckert J, Holzer JC, Ahn CC, Fu Z, Johnson WL (1993) Melting behaviour of nanocrystalline aluminium powders. Nanostruct Mater 2(4): 407-413.
- Lai SL, Guo JY, Petrova V, Ramanath G, Allen LH (1996) Size-dependent melting properties of small thin particles: nanocalorimetric measurements. Phys Rev Lett 77(1): 99-102.
- Bottani CE, Li Bassi A, Tanner BK, Stella A, Tognini P, et al. (1999) Melting in metallic Sn nanoparticles studied by surface Brillouin scattering and synchrotron-X-ray diffraction. Phys Rev B 59: R15601.
- Suresh A, Mayo MJ, Poter WD, Rawn CJ (2004) Crystallite and grain-size-dependent phase transformations in yttria-doped zirconia. J Am Ceram Soc 86(2): 360-362.
- Suresh A, Mayo MJ, Porter WD (2003) Thermodynamics of the tetragonal-to-monoclinic phase transformation in fine and nanocrystalline yttria-stabilized zirconia powders. J Mater Sci 18: 2912-2921.
- Coombes CJ (1972) The melting of small particles of lead and indium. J Phys F Met Phys 2: 441-449.
- Chang J, Johnson E (2005) Surface and bulk melting of small metal clusters. Philos Mag 85: 3617-3627.
- Kaptay G (2012) Nano-Calphad: extension of the Calphad method to systems with nano-phases and complexions. J Mater Sci 47: 8320-8335.
- Castro T, Reifenberger R, Choi E, Andres RP (1990) Size-dependent melting temperature of individual nanometer-sized metallic clusters. Phys Rev B 42: 8548-8556.
- Schmidt M, Kusche R, Von Issendorff B, Haberland H (1998) Irregular variations in the melting point of size selected atomic clusters. Nature 393: 238-240.
- Shvartsburg AA, Jarrold MF (2000) Solid clusters above the bulk melting point. Phys Rev Lett 85: 2530-2532.
- Zhang J, Ren X, Jia H, Cui Z, Xiong N, et al. (2023) Effect of particle size distribution on explosion intensity of aluminium powder. Process Saf Prog 42(1): 186-193.
- Li Q, Wang K, Zheng Y, Mei X (2016) Explosion severity of micro-sized aluminium dust and its flame propagation properties in 20L spherical vessel. Powder Technology 301: 1299-1308.
- Zhang J, Sun L, Sun T, Zhou H (2020) Study on explosion risk of aluminium powder under different dispersions. Journal of Loss Prevention in the Process Industries 64: 104042.
- Reding NS, Shiflett MB (2018) Metal dust explosion hazards: A technical review. Ind Eng Chem Res 57(34): 11473-11482.
- Sato N (1990) An overview on the passivity of metals. Corrosion Science 31: 1-19.
- Granqvist CG, Buhrman RA (1976) Ultrafine metal particles. J Appl Phys 47: 2200-2219.
- Guo L, Song W, Mulin H, Xie C, Chen X (2008) Preparation and reactivity of aluminium nanopowders coated by hydroxyl-terminated polybutadiene (HTPB). Appl Surf Sci 254(8): 2413-2417.
- Guo L, Song W, Xie C, Zhang X, Hu M (2007) Characterization and thermal properties of carbon-coated aluminium nanopowders prepared by laser-induction complex heating in methane. Mater Lett 61(14-15): 3211-3214.
- Sanchez-Lopez JC, Caballero A, Fernander A (1998) Characterisation of passivated aluminium nanopowders: An XPS and TEM/EELS study. J Eur Ceram Soc 18: 1195-1200.
- Gromov AA, Ilyin AP, Foerter BU, Teipel U (2006) Effects of the passivating coating type, particle size, and storage time on oxidation and nitridation of aluminium powders. Combustion, Explosion and Shock Waves 42: 177-184.
- Gromov AA, Ilyin AP, Teipel U, Pautova J (2014) Passivation of metal nanopowders. Metal Nanopowders.
- Kwon YS, Gromov AA, Ilyin AP, Rim GH (2003) Passivation process for superfine aluminium powders obtained by electrical explosion of wires. Appl Surf Sci 211(1-4): 57-67.
- Vollath D, Szabò DV (1999) Coated nanoparticles: a new way to improved nanocomposites. J Nanopart Res 1: 235-242.
- Bukaemskii AA, Beloshapko AG (2001) Explosive synthesis of ultra disperse aluminium oxide in an oxygen-containing medium. Combustion Explosion and Shock Waves 37: 594-599.
- McCafferty E (2010) Passivity. Introduction to corrosion science. pp. 209-262.
- Vargel C (2004) Corrosion of aluminium. pp.81-148.
- Ilyin AP, Krasnyatov YA, Tikhonov DV (1999) Russian Federation Patent 2139776.
- Hauffe K (1965) The mechanism of oxidation of metals-theory. Oxidation of Metals pp: 79-143.
- Mulvaney P (2001) Nanoscale materials in chemistry. In: Klabunde K (Ed.), John Wiley and Sons Inc, New York, USA.
- Gromov AA, Ilyin AP, Teipel U, Pautova J (2014) Passivation of metal nano powders. Metal Nanopowders.
- Kwon YS, Gromov AA, Ilyin AP (2002) Reactivity of superfine aluminium powders stabilized by aluminium diboride. Combustion and Flame 131(3): 349-352.
- Smedra A, Berent J (2021) Black powder handgun shots-cases analysis and literature review. J Forensic Science 66(2): 779-785.
- Forbes TP, Verkouteren JR (2019) Forensic analysis and differentiation of black powder and black powder substitute chemical signatures by infrared thermal desorption – DART-MS. Anal Chem 91(1): 1089-1097.
- Yan QL, Zeman S (2013) Theoretical evaluation of sensitivity and thermal stability for high explosives based on quantum chemistry methods: A brief review. Int J Quantum Chem 113(8): 1049-1061.
- Makinen M, Nousiainen M, Sillanpaa M (2011) Ion spectrometric detection technologies for ultra-trace of explosive: A review. Mass Spectrom Rev 30(5): 940-973.
- Hooks DE, Ramos KJ, Bolme CA, Cawkwell MJ (2015) Elasticity of crystalline molecular explosives. Propellants Explosive Pyrotechnics 40(3): 333-350.
- Moran P (1993) The complete book of flash powder.
- McLain JH (1980) Pyrotechnics: From the Viewpoint of Solid State Chemistry. Franklin Institute Press.
- Roviglioni E, Giordano G (1993) Fire prevention in the company. EPC Roma.
- Arpa ER – Provincial Section of Ravenna – Environmental Systems Service – NIR Unit and Air and Physical Agents Monitoring and Evaluation Area. Report – Measurement of the Electric Field Produced by Cell Phones – Earphones – Wi-Fi Equipment.
- Genova B, Genova M, Silvestrin Mi (2009) Building safety against explosive phenomena. In: Angelis CD. Eckhoff RK (Eds.), (1997) Dust explosions in the process industries. Butterworld Heinemann, USA.
- Pouretedal HR, Ebadpour R (2014) Application of non-isothermal thermogravimetric method to interpret the decomposition kinetics of NaNO3, KNO3, and KCIO4. Internation Journal of Thermophysics 35: 942-951.
- Babar Z, Malik AQ (2015) Thermal decomposition, ignition and kinetic evaluation of magnesium and aluminium fuelled pyrotechnic compositions. Central European Journal of Energetic Materials 12(3): 579-592.
- (2015) United Nations. Recommendations on the transport of dangerous goods: Manual of tests and criteria – (Sixth Revised edn) pp. 335-436.
- Classification procedure, test methods and criteria relating to class 2, class 3, class 4, division 5.1, class 8 and class 9.
- Von Maltitz I (2003) Black powder manufacturing, testing & optimizing. American Fireworks (PA), USA.
- Coppe D, Scola E, Spanu A, Impemba S (2019) The flash powder. Independently.
© 2024 Salvatore Impemba & Danilo Coppe. This is an open access article distributed under the terms of the Creative Commons Attribution License , which permits unrestricted use, distribution, and build upon your work non-commercially.
Editor In Chief


.jpg)


Signup for Newsletter

Quick Links
 Editorial Board Registrations
 Submit your Article
 Refer a Friend
 Advertise With Us
Our Recent Edition

.jpg)


Top Editors


.jpg)


.bmp)
.jpg)
.png)
.jpg)


.jpg)


.png)

.png)


.png)


Financial Support

Sponsors

Latest e-Books

Latest Video

 a Creative Commons Attribution 4.0 International License. Based on a work at www.crimsonpublishers.com.
Best viewed in
a Creative Commons Attribution 4.0 International License. Based on a work at www.crimsonpublishers.com.
Best viewed in