
- About Us
- Information
-

The Author ensures that the research has been conducted responsibly and ethically with adherence to all relevant regulations. read more..
- For Authors
- For Reviewer
- Manuscript Guidelines
- Membership
- Publication Ethics
-
- Journals
- Reprints
- e-Books
- Videos
- Policies
- Contact Us
 COVID-19
- Submissions


Full Text
Aspects in Mining & Mineral Science
Using the Discrete Element Method (DEM) to Test a Mechanistic Granular Flow Model on Vibrating Screens
Ogunmodimu OOS1*, Mainza AN2, Govender T2,3 and Franzidis JP2
1John and Willie Leone Family Department of Energy and Mineral Engineering, The Pennsylvania State University, University Park, United States of America
1Department of Chemical Engineering, University of Cape Town, South Africa
1Mintek, South Africa
*Corresponding author:Olumide O S Ogunmodimu, John and Willie Leone Family Department of Energy and Mineral Engineering, The Pennsylvania State University, University Park, PA 16802, United States of America
Submission: January 25, 2024: Published: February 22, 2024

ISSN 2578-0255Volume12 Issue2
Abstract
Screening is the practice of separating granular materials into multiple-size fractions using an aperture for selection and is employed in most mineral processing plants. Currently, the design and scale-up of screens rely on rules of thumb and empirical methods. In previous publications, we outlined details of a mathematical model of screening developed using Discrete Element Methods (DEM). Our investigation was based on the need for fundamental research into granular dynamics in mineral processing, particularly on an inclined vibrating screen that goes beyond the current state of the art in screen modelling. We established that granular flow on vibrating screens exhibits complex phenomena such as segregation, percolation, and flow of oversize material over the separating medium. This work demonstrates a unique granular rheology for particles moving on a vibrating screen. DEM provided critical data (velocity, volume concentration, shear rate, bed depth) for developing, testing, and calibrating the granular flow models. First, a binary mixture of glass beads flowing on an inclined vibrating screen was simulated, and the subsequent continuum analysis of the flowing layer revealed a coexistence of three flow regimes- (i) quasi-static, (ii) dense (liquid-like), and (iii) inertial. The regimes are consistent with the measured solids concentrations spanning these regimes on inclined vibrating screens. The quasi-static regime is dominated by frictional stress and corresponds to a low inertial number (I). Beyond the quasi-static regime, the frictional stress chains break, and the collisional-kinetic and turbulent stresses begin to dominate. The appropriate constitutive shear stresses were then used to derive a new rheology that captures all phases of the flow transition points observed in the simulation. The model presents a fundamental understanding of the mechanisms governing the transport of granular matter on an inclined vibrating screen.
Keywords:Screens; DEM; Granular flow; Rheology
Introduction
Granular flow is essential to many industrial and mineral processes. Its importance cuts across industries such as food, pharmaceutical, mining, and even geological flows such as landslides, avalanches, tsunamis, and volcanoes. The flow of granular matter is generally defined as discrete particles (usually cohesionless) that interact via energy-dissipating contacts with each other [1]. The simulation of granular flow using DEM is a well-established method successfully applied to various industrial problems. For example, DEM has been applied in mineral processing to study unit operations in the comminution circuit. This ranges from crushers and AG/SAG mills [2-5] at the coarse end of comminution to ball mills and stirred media mills at the fine end, and classification units such as vibrating screens and hydro-cyclones [6-9]. This work applies DEM to granular flow on an inclined vibrating screen. From a rheological perspective, size separation by a vibrating screen can be modelled by first studying granular behaviour on the screen. As established in previous work [10], the traditional treatment of granular flow is to separate it into three different regimes. These regimes are a dense quasi-static regime in which the deformations are very slow, and the particles interact by frictional contacts [11]; a gaseous regime in which the flow is very rapid and dilute, and the particles interact by collision [12]; and an intermediate liquid regime in which the material is dense but still flows like a liquid with the particles interacting both by collision and friction [13]. Further to this, in a previous study, by Ogunmodimu [14], a mechanistic model that captured these regimes on an inclined vibrating screen was established. This paper further discusses these flow regimes and how the model developed in Ogunmodimu [14] and Ogunmodimu et al. [10] response to the screening operations.
Granular Flow on an Inclined Vibrating Screen
Several approaches have been employed to model screening efficiency [15-18], especially size separation by a vibrating screen. These models are essentially developed to improve the throughput of industrial screens. Accurate predictions of size separation in mineral processing operations directly affect mineral recovery and cost. No complete theoretical description has been made for granular flow on an inclined vibrating screen. However, in Midi [13] work, dimensional analysis was employed to show that the relevant parameters that affect the flow are: pressure P, the shear rate γ , the particle size d, and the bulk density ρ =φρp where φ is the solids concentration and is the material density. Emerging from applying the Buckingham-Pi theorem, these parameters are divided into two pi-groups known as Buckingham-Pi groups. For rigid frictional spheres flowing down an inclined plane, the two groups are expressed as follows:
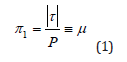
Where μ is the frictional parameter that relates the shear stress τ to the normal stress P acting on the flow
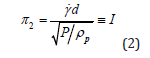
Where I is the inertial number [11,13,19,20]. From numerical and empirical data, da Cruz et al. [21] and Pouliquen [22] established μ is a function of the inertial number I, i.e., μ=μ(I). This was later generalised for local flows operated at moderate inertial numbers (0.01 to 0.5) by Jop et al. [19] to:
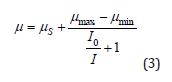
Where I0=0.279 is a fitted constant, and μmax and μmin bound steady flow. Given that π1=f(π2) and ρ=ϕρp, to ensure mathematical consistency, ϕ must be a function of the inertial number, i.e., ϕ=ϕ(I). With this prescription, we are in the paradigm of homogeneous states whereby for a specified inertial number, the solids concentration (ϕ) and shear stress (τ=μP)-or scaled shear stress ((|τ|)/P=μ) - adjust in response to I. In vibrating screens, the flow is not consistent, as different flow patterns are observed across the screen. According to a previous study by Ogunmodimu et al. [10], there are three distinct flow patterns - quasi-static, collisional, and turbulent - each with its own characteristic stresses. These patterns were identified using the μ(I) model, which was expanded to account for the dominant stresses in each flow regime. To delve deeper into this topic, we used Tunuguntla et al. [23] coarse-graining approach to analyse a non-uniform flow of bi-disperse spherical glass beads in a vibrating screen system. This involved classifying two-size fractions as two components of the particle flow.
Dem Analysis
To simulate a screening process, the key boundary is a woven mesh which provides apertures for undersize particles to fall through. Additional screening parameters, such as mechanical vibration and screen inclination, are also employed. A 3-D DEM model was set up to simulate granular flow on an inclined vibrating screen. The screen geometry was designed using Computer-Aided Design (CAD) in solid-works software and imported into the commercial package EDEM, developed by DEM Solutions. EDEM is based on the Cundall & Strack [24] algorithm and the appropriate contact model DEM-Solutions [25]. Simulations were conducted to model the separation of a mixture of dry, spherical glass beads consisting of an equal volume of two differently sized particles. The modelling conditions employed in the simulations are listed in Table 1.
Table 1:Dem input parameters [10].

The model used for the DEM simulation is based on Hertz’s theory and Mindlin’s no-slip improved model in the normal and shear directions, respectively. The amount of time between successive iterations (time step) in the simulation was carefully chosen to avoid incorrect calculation of particle contact forces and interactions. To ensure stability in the system, the time step was set to at least half of the critical time step. According to DEM-Solutions [25], the critical time step (the Rayleigh time) is when a shear wave propagates through a solid particle. The time step employed in this work was 1.83×10⁻⁶s [25]. The flow was analysed at an accumulated average time interval of 0.5s. The snapshots of the flow at this time interval are described in detail in [10]. Data processing was done by extracting continuum fields from the discrete particle data. The coarse-graining approach described by Tunuguntla et al. [23,26,27] were employed for this analysis. Data exported from DEM simulation are velocities and positions of individual particles at different time steps, and the post-analysis of data was done in MATLAB.
Flow regimes observed along the screen
The variation of the solids’ concentration across the flow depth, as observed from the simulation from the base case values where the frequency and the amplitude of vibration were 4Hz and 1mm, respectively, was discussed in Ogunmodimu [10]. In the quasistatic region, the solids concentration increases to the maximum of 0.58, i.e. (∅max=0.58), the solids concentration drops slightly, and the bulk of the flow behaves like a viscous liquid. Here, particles interact by collision and friction. Beyond this point, the stress chain binding particles together are fast-breaking, and particles behave more like gas. Away from this regime, frictional interaction does not exist, as particles in this region only interact by collisional or kinetic stresses. After this section, the flow became highly fluidized, the solids concentration dropped significantly, and the stress chains broke. Occasionally, some particles are observed in this regime bouncing off the screen. This region is chaotic; hence, it is referred to as a turbulent regime in this work. Despite the constant energy supply to the screen, its granular flow is not homogenous. Some particles cluster together and are reluctant to move. The motion in this phase, where particles are reluctant to move, is quasi-static, and frictional contacts dominate it. The other regimes are active and respond moderately or violently to the vibration of the screen. A moderate flow is observed in the bulk of the flow. However, a third regime exists where particles move violently, incredibly close to the screen’s surface at high vibrational intensity. These regimes occur concurrently along the screen simultaneously but in different locations. This observation is the first step towards developing a phenomenological screening model that does not depend on the boundary conditions of a particular machine design.
Solids concentration across the depth of flow
When particles are subjected to continuous energy input through vibrational intensity and inclination angle, they gain enough energy to increase their chances of percolating through the screen aperture. However, if the energy input is not regulated, it could result in a high solids concentration in the flow, which could impede screening efficiency. For example, a high solid concentration could decrease the chance of particle throughput as many particles may not make it to the screen surface within the time of travel. On the other hand, if the solids concentration is too low, the particles could move very fast and bounce off the screen surface, particularly when the vibrational intensity is high. Figure 1 illustrates the solids concentration profile across the granular bed of flow, while the zoom-in image in Figure 1b highlights the various solids concentration patterns observed on the screen at a steady flow. The solid concentration profiles are based on the frequency and amplitude of vibration, which were constant at 4Hz and 1mm, respectively. Points A, B, C, D, and E in Figure 1 depict different transitions observed in the flow. The region below point A is highly fluidized due to the amplitude and intensity of the vibration of the screen, resulting in a low solids concentration. The volume fraction increases slightly from the screening surface to point A. The area between points A and B corresponds to a static or plug-flow regime where the material and screen surface velocities are the same. In the quasi-static region, the solids concentration appears to increase slightly and then decreases when transforming from points C to D. The maximum solids concentration within the quasi-static region (∅=∅max) corresponds to Jop et al. [15]’s observations for inclined plane geometry.
Figure 1a:Variation of solids concentration ∅ across the bed of flow on a vibrating. (b) shows the zoomed-in image of Figure 1(a). Point A-E is the bulk of the flow where different regime is observed.

Model Formulation and Testing
The variation of the effective friction coefficient against the inertial number is analysed to assess whether the flow is homogenous. This analysis would help identify the dominant stress in each regime observed on the screen and the transition from one regime to the other. The uneven distribution of the solid’s concentration of the flow along the screen establishes that granular flow on screens is heterogeneous. As the inertial number I, increases, the flow evolves from a dense to a kinetic and turbulent regime. The increase in the inertial number leads to an increase in inter-particle collisions. The transition from a liquid-like to a gaslike regime is due to kinetic stress in the flow. Lee & Huang [28] developed a kinetic stress model to show this transition. Figure 2 shows Lee & Huang [28]’s model. The first turning point in the model is the hysteresis at flow initiation, while the second is the transition from liquid-like to gas-like flow.
Further study was warranted due to the discontinuity at the transition to the inertial flow regime (second turning point), as recognized by the researchers. Lee & Huang [28] distinguished between static and kinetic stress component regimes. The sum of these stress components equates to the total stress, while the corresponding normal stress (pressure) was also decomposed accordingly. In our study, we identified a third regime from the nature of the flow observed on the screen, which we named the turbulent regime. Equations 4-6 illustrate the stress components and the effective friction coefficient μ(I). To capture all flow regimes observed during screening and address the shortcomings of Lee & Huang [28] and Jop et al. [19], we included the turbulent regime in our stress and confining pressure decomposition as an extension of Lee & Huang [28] stress decomposition. Therefore, the total stress in our work is decomposed as follows:
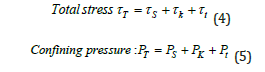
where τs, τk and τt are the quasi-static shear stress in the dense regime, the kinetic collisional shear stress, and the turbulent shear stress, respectively, and Ps, Pk and Pt are the corresponding confining pressures. The effective friction coefficient in this approach is expressed as the ratio of the total shear stress to the total normal stress (Pressure):
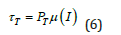
Taking the ratio of the total shear stress τT and total pressure pT gives a new effective friction coefficient μ(I) for the granular flow on the vibrating screen flow described by equation 7. Details of the development of the model in equation 7, including the constitutive equations, were presented in our previous work [10].
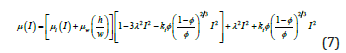
In order to extend the work of Lee & Huang [28] shown in Figure 2 to include the turbulent regime and accurately capture all observed regimes and transitions from one to another, we tested the response of the model in equation 7. By utilizing the parameters listed in Table 2 and equation 7, we generated Figure 3 which effectively displays the variation of the effective friction coefficient with inertial number. These parameters were obtained from DEM simulation results.
Figure 2:Variation of the effective friction coefficient with inertial number. The lines are model predictions for three effective restitution coefficients, while the open circles correspond to the data from MiDi [13]. Adapted by the author Lee & Huang [28].

Table 2:An example of parameters extracted from DEM simulations required to solve equation 7

Figure 3:A plot of the variation of effective friction coefficient with inertial number using the base case of 1mm amplitude and 4Hz Frequency [10].

The model in Figure 3 depicts the transition from a quasi-static phase to a dense flow and turbulent regime. The inset displays the hysteresis effect and the shift to a dense-like regime. The transition point’s I value is 0.018, indicating that the quasi-static regime happens at I≤0.018. The dense-like regime transitions to a turbulent or gas-like regime at I=0.5. This implies that the dense flow regime happens at 0.018< I < 0.5. Beyond the dense-flow regime, the inertial regime occurs, which Lee & Huang [28] suggested as a limitation that warrants further study. The inertial flow is a frictionless flow which has no external force to keep the particles within the desired limit. This is why we name this regime a turbulent regime.
Testing the model’s response to energy input variation
The screening application in this work is limited to the bulk behavior of particles on an inclined vibrating screen. The transition from one regime to another in the case of an inclined vibrating screen is controlled by the inclination of the screen (θ) and the dimensionless acceleration Γ of the bed.
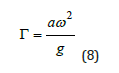
where a is the amplitude of vibration, ω is the angular frequency, and g the acceleration due to gravity,

Where f is the frequency of vibration. The vibration of the screen is sinusoidal in the form:

When subjected to adequate mechanical agitation or shear stress, granular media can yield and flow. In inclined vibrating screens, both the inclination angle and mechanical agitation contribute to the granular flow down the screen surface. However, the impact of mechanical agitation on the bulk of flow and the transition of flow regimes was not considered in our previous study by Ogunmodimu et al. [10]. In this study, we aim to investigate how vibrational intensity affects the flow regimes observed on the screen. It is worth noting that the intensity of vibration plays a crucial role in screening as the energy input from sinusoidal vibration is unevenly distributed, resulting in various flow regimes. Therefore, it is essential to quantify the effect of energy input on the bulk of flow to determine when particles have enough energy to pass through the screen aperture efficiently. The inertial number and energy intensity of vibration can determine the appropriate flow regime for efficient screening. Additionally, shear-induced agitation is naturally observed due to the inclination of the screen, and the angle of inclination is carefully selected to prevent a drastic reduction in the granules’ residence time on the screen. If the mechanical agitation during screening is too high, particles will bounce off the screen, particularly in the turbulent regime where I>0.5.
Energy input and dissipation
The energy supply to the flowing granules through screen vibration is constant. However, due to the high rate of energy dissipation in the system, energy distribution is not even. Instead, energy at the base is transmitted directly through the particles, affecting flow depth. Though a high-impact wave travels through the flow, energy dissipation is significant. Granules gain sufficient energy to reposition themselves and increase their chances of passing through the aperture. Vibration also induces particle movement through the screen, influencing throughput. Their behavior is primarily influenced by vibration, which is governed by dimensionless parameters for acceleration Γ, energy input Ω, and dissipative parameter Λ:
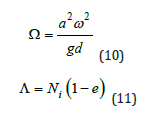
where Ni is the number of particle layers, and e is the normal coefficient of restitution.
Analysis of different flow regimes
This study suggests that energy dissipation caused by particleparticle collisions is responsible for the different flow regimes observed during simulation, including quasi-static, collisional, and turbulent regimes. These regimes and their transitions were reported by Ogunmodimu et al. [10], based on a steady flow base case with f=4Hz and a=1mm, which was used to determine parameters for the model depicted in Figure 3. To better understand the impact of each constituent regime on screening, the analysis of flow was conducted separately for three constituent stresses and effective frictional regimes. The analysis evaluated normal and shear stress across the flow depth, revealing that all three regimes coexist within the flow and highlighting the extent to which each regime dominates within the charge.
The quasi-static regime: In the quasi-static regime, frictional force plays a dominant role as the particles are in close proximity and their velocities are insignificant. There could be various factors contributing to this phenomenon, such as uneven energy distribution in the system due to high energy dissipation in the flow, resulting in particle interlocking. Additionally, some particles get stuck inside the aperture of the screening surface, while the roughness of the surface caused by the screening aperture opposes the flow of particles (wall friction). Intuitively, one would expect particles flowing on a vibrating surface to possess enough kinetic energy induced by the vibration of the screen. Still, sometimes they bounce into each other, and the frictional force between colliding particles tends to retard their free flow. This regime across the depth of flow is depicted in Figure 4, using the stress analysis within the quasistatic regime. We observed that the quasi-static regime dominates the region between scaled depths 0-0.5. Beyond this depth, a transition to a dilute regime began to occur as the quasi-static regime decreases towards the surface i.e., τs, ps→0. The frictional force chain began to brake close to the surface and the particles began to gain more kinetic energy and the solid concentration began to decrease. This further alludes to the observation from the graph of solids concentration in Figure 1 that shows the solids concentration decreases towards the surface, implying a rapid flow.
Figure 4:Variation of the static pressure and stress with the scaled depth of flow.

A collisional regime gradually sets in as particles gain enough energy to break the stress chain. At depth 1.7, the stresses intersect, confirming that a portion of the particle flow can occasionally become stationary. At this point, the static stress is equal to the normal stress. However, as the depth increases towards the surface, static stress and static pressure reduce to zero at depths 2.7 and 3.7, respectively. The static shear stress is higher before the intersection because the tendency of particles to move toward the flowing direction is increased. However, the static pressure extends beyond the static stress because particles on the screen will experience gravitational force with a component acting in the direction of the bed depth. The quasi-static regime gradually transitions into a collisional regime. The hysteresis effect and the transition from the quasi-static regime occur at I≤0.018.
The kinetic regime: The Kinetic regime of the flow considers particle fluctuation energy induced by the mechanical excitation of the screen. In this regime, particles’ static stress is broken as particles gain enough energy for a random motion. For the kinetic regime in this work, the analysis was performed in terms of collisional shear stress and collisional pressure. Figure 5 shows the variation of collisional pressure and shear stress with a scaled depth of particle flow along the screen. This is an important regime in screening as particles gain enough energy for random motion that would increase their chances of throughput. At this sampling point, both the collisional shear stress and pressure increase sharply from the scaled depth of 0.0-1.0. The maximum value for τc is 0.33 and for pc is 0.46. These values are within the quasi-static regime which is the dominant regime within this depth of flow, despite the sharp increase in the collisional shear stress τc and the collisional normal stress pc, τs>τc, and ps>pc within this depth (0≤h/ d≤1.0) which is still acceptable for this regime. A drop was observed in τc, from scaled depth 0.68 to 2.7. Similarly, a drop was noted in pc from depth 1.1 to the surface at depth 4.6. The drop in both τc and pc is due to the coexistence of both the static effect, resulting from enduring contact, and the kinetic effect, comprising both collision and inertial effects, in this region. The kinetic regime observed can be described as the dense, liquid-like regime where frictional and collisional effects are active. At the depth where τs⟶0 (h/d=2.7), τc begins to rise towards the surface (Figure 5). The increase in the kinetic stress is because the particles move rapidly towards the surface, and contacts are by collisional effects. However, despite the coexistence of the static and the kinetic effects, the kinetic regime is dominated by collisional-kinetic stress. This regime was shown as the region corresponding to 0.018< I <0.5 in Figure 3.
Figure 5:Variation of collisional pressure and stress with the scaled depth.

The turbulent regime: The turbulence in the bedload transport is vital to our study in that we identified a turbulence regime as the third regime that Lee & Huang [28] referred to in their work as requiring further study. This regime also has some impact on screening where turbulence affects the angle at which a particle approaches the separating aperture and at high vibrational intensity particles could bounce off the screening area. The turbulent regime is characterized by particles’ chaotic interactions, which lead to the bouncing of some particles off the screen surface. The turbulent stress and pressure were used in the analysis to study the turbulence in the system just as in the previous two regimes viz static and collisional. Figure 6 shows the turbulence, shear stress and pressure variation with the scaled depth. It can be seen that both the turbulent stress, τt, and the turbulent pressure pt, are increasing with the normalized depth of the flow where between the depth 0≤h/d≤1, some degree of turbulence was noticed, (τt,pt≈0.1), even though negligible. As discussed in sections 4.3.1 and 4.3.2, τs and ps dominate the depth 0≤h/d≤1, and the turbulence level within this region is expected to be approximately zero (≈0). Beyond depth h/d=1, a sharp increase is noted in τt towards the surface of the flow while pt increases as well, although τt>>pt. The turbulent shear stress is more pronounced compared to the turbulent normal stress because the chaotic movement of the particles at this regime tends to overpower the normal stress that should have kept the particles within the kinetic regime. While some degree of turbulence is seen within the flow, the turbulence around the surface is significant. The normal turbulent stress (turbulent pressure) is expected to decrease towards the surface in a free surface flow because the turbulent shear stress τt is mainly responsible for the chaotic flow at the surface. The turbulent pressure (pt) towards the surface depends on the gravitational force as the normal stress. Within the bulk of the flow, pt is developed by interactions with particles in the normal direction. However, there is no confinement towards the surface since the system geometry is an open surface. Although the values of the turbulent pressure are low compared to the turbulent shear stress towards the surface, they are essential to determining the effective frictional co-efficient and the corresponding inertial value for the turbulent regime. The turbulent shear stress τt dominance at the surface is due to the bumpy flow experienced by some particles due to the agitation from the vibration of the screen. From Figure 6, both the turbulent shear stress and turbulent pressure can be expressed mathematically as an exponential function of the form τt,
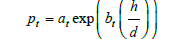
where at and bt are constants, whose values depend on the level of turbulence in the flow.
Figure 6:Variation of turbulent stress and pressure with the scaled depth.

Rheological model
In screening, the objective of vibration is to adjust the position of particles to optimize their chances of passing through the screening aperture. However, too much vibration can lead to turbulent flow. At high vibration intensity, the system is dominated by kinetic and turbulent effects, resulting in particles bouncing off the screen, which can negatively impact screening efficiency. To prevent this, the frequency of vibration should be maintained at a level that significantly reduces turbulence. By analyzing the effective friction coefficient, it is possible to determine the flow regime and the impact of different screening parameters on the flow. Figures 7a & 7b demonstrate that the model is responsive to changes in vibration intensity, with amplitude having a greater impact than frequency. At low vibration intensity, the quasistatic regime and the transition to the kinetic regime can be easily observed, but at higher vibrational intensities, this regime gradually disappears.
Figure 7:A plot of the variation of effective friction coefficient with an inertial number at (a) a fixed amplitude of 1mm and different frequencies (b) a fixed frequency of 4Hz and different amplitudes.

The effects of the frequency of vibration on the flow are seen in the variation of the inertial number at transitions to different flow regimes are shown in Table 3. Here we highlight how the quasistatic regime gradually reduces to zero in response to the increase in the frequencies of vibration. The effects of the amplitude of vibration on the flow are seen in the variation of the inertial number at transitions to different flow regimes are shown in Table 4. Here we also observed the reduction of the quasi-static regime to zero in response to the increase in the amplitude of vibration. This observation confirms that the vibrational intensity plays an important role in breaking the static stress in the quasi-static regime and ensures a transition to a kinetic regime where the chances of particle throughput is higher
Table 3:Inertial values for regimes transitions as frequency increases.

Table 4:Inertial values for regimes transition as amplitude increases.

Conclusion
A mechanistic model for granular flow on an inclined vibrating screen was tested in this work. DEM was employed to perform simulations for studying the granular flow of a mixture of 3mm and 5mm glass beads on an inclined vibrating screen. The aperture size and the inclination angle were fixed at 3.5mm and 25°, respectively. The frequency and the amplitude of vibration were fixed at 4Hz and 1mm, respectively, for the base case used to develop the model. Subsequently, the intensity of vibration (comprising the frequency and amplitude) was varied to see the effects on the dynamics of the flow. A micro-macro transition method in the form of the coarsegraining method of Tunuguntla [23] was employed in this work. It was applied to calibrate and validate continuum models from discrete data obtained from DEM simulations. The information extracted from discrete particle simulations was used to confirm the assumptions and provide the required closure rules for a rheological model that characterizes the granular flow on an inclined vibrating screen. While microscopic properties were employed for the simulation, the properties extracted from the simulation are macroscopic fields that are consistent with the continuum equations of mass, momentum, and energy balance. A constitutive stress model of granular flow, which provides a key mechanism of particle flow dynamics on an inclined vibrating screen, was tested. The main stresses observed in the flow and the transitions between the flow regimes were successfully captured by this model. Of note is the transition beyond the dense-flow and inertial regimes, which Lee & Huang [28] suggested warranted further study. In developing the model, this work established the dominant stress on the screen determines the dominant regime and hence the granular behavior on the screen. Further, the dynamics of the granular materials can be controlled using the model relating the variation of the effective frictional coefficient with the inertial number [29].
Acknowledgment
We gratefully acknowledge support from the South African Minerals to Metals Research Institute (SAMMRI), the Center for Minerals Research (CMR), department of Chemical engineering UCT, the Penn State Institute for Computational and Data Sciences (ICDS), the Alliance for Education, Science, Engineering, and Design with Africa (AESEDA) and The John and Willie Leone Family Department of Energy and Mineral Engineering (EME) PSU.
References
- Umbanhowar P (2003) Granular materials: Shaken sand-a granular fluid? Nature 424(6951): 886-887.
- Liu Z, Wang G, Guan W, Guo J, Sun G, et al. (2022) Research on performance of a laboratory-scale SAG mill based on DEM-EMBD. Powder Technology 406: 117581.
- Djordjevic N, Morrison R, Loveday B, Cleary P (2006) Modelling comminution patterns within a pilot scale AG/SAG mill. Minerals Engineering 19(15): 1505-1516.
- Delaney GW, Cleary PW, Morrison RD, Cummins S, Loveday B (2013) Predicting breakage and the evolution of rock size and shape distributions in Ag and SAG mills using DEM. Minerals Engineering 50(51): 132-139.
- Morrison R, Cleary PW, Loveday B, Delaney GW, Cummins S (2011) Predicting the evolution of rock size and shape distributions using DEM based on different modes of breakage in AG and SAG mills. In International Conference on Autogenous Grinding, Semi autogenous Grinding and High-Pressure Grinding Roll Technology, Vancouver, BC, Canada.
- Mangadoddy N, Vakamalla TR, Kumar M, Mainza A (2020) Computational modelling of particle-fluid dynamics in comminution and classification: A review. Mineral Processing and Extractive Metallurgy 129(2): 145-156.
- Menesklou P, Sinn T, Nirschl H, Gleiss M (2021) Scale-up of decanter centrifuges for the particle separation and mechanical dewatering in the minerals processing industry by means of a numerical process model. Minerals 11(2): 229.
- Harzanagh AA, Orhan EC, Ergun SL (2018) Discrete element modelling of vibrating screens. Minerals Engineering 121: 107-121.
- Chu KW, Wang B, Yu AB, Vince A (2009) CFD-DEM modelling of multiphase flow in dense medium cyclones. Powder Technology 193(3): 235-247.
- Ogunmodimu O, Govender I, Mainza AN, Franzidis JP (2021) Development of a mechanistic model of granular flow on vibrating screens. Minerals Engineering 163: 106771.
- Forterre Y, Pouliquen O (2008) Flows of dense granular media. Annu Rev Fluid Mech 40: 1-24.
- Goldhirsch I (2003) Rapid granular flows. Annual review of fluid mechanics 35(1): 267-293.
- Midi GDR (2004) On dense granular flows. Eur Phys J E 14(4): 341-365.
- Ogunmodimu O (2016) Developing a mechanistic model for flow through a perforated plate with application to screening of particulate materials, Doctoral dissertation, University of Cape Town, South Africa.
- Hilden MM (2007) Dimensional analysis approach to the scale-up and modelling of industrial screens. Phd thesis, School of Engineering, The University of Queensland, Australia p. 338.
- Cleary PW (2004) Large scale industrial DEM modelling. Engineering Computations 21(2/3/4): 169-204.
- Elskamp F, Kruggel-Emden H (2015) Review and benchmarking of process models for batch screening based on discrete element simulations. Advanced Powder Technology 26(3): 679-697.
- Jezsó K, Peciar P, Macho O, Huhn V, Peciar M (2023) Analysis of the screening process of particulate material and the application of a grade efficiency curve as a function of screen length. Powder Technology 424: 118558.
- Jop P, Forterre Y, Pouliquen O (2005) Crucial role of sidewalls in granular surface flows: consequences for rheology. J Fluid Mech 541: 167-192.
- Jop P, Forterre Y, Pouliquen O (2006) A constitutive law for dense granular flows Nature 441: 727-730.
- Da Cruz F, Chevoir F, Roux J, Iordanoff I (2003) Macroscopic friction of dry granular materials. Tribology series 43: 53-61.
- Pouliquen O (1999) Scaling laws in granular flows down rough inclined plane. Physics of Fluids 11(3): 542-548.
- Tunuguntla DR, Thornton AR, Weinhart T (2015) From discrete elements to continuum fields: Extension to bidisperse systems. Computational Particle Mechanics 3: 349-365.
- Cundall PA, Strack ODL (1979) A discreate numerical model for granular assemblies. Geotechnique 29(1): 47-65.
- (2006) DEM-Solutions, EDEM 2.4 User Guide, (2005-2006 edn), DEM Solutions.
- Weinhart T, Thornton AR, Luding S, Bokhove O (2012) Closure relations for shallow granular flows from particle simulations. Granular Matter 14(4): 531-552.
- Glasser B, Goldhirsch I (2001) Scale dependence correlations, and fluctuations of stresses in rapid granular flows. Physics of Fluids 13(2): 407-420.
- Lee CH, Huang CJ (2012) Kinetic-theory-based model of dense granular flows down inclined planes. Physics of Fluids 24(7): 073303.
- Babic M (1997) Average balance equations for granular materials. Int J Eng Sci 35(5): 523-548.
© 2024 Olumide O S Ogunmodimu. This is an open access article distributed under the terms of the Creative Commons Attribution License , which permits unrestricted use, distribution, and build upon your work non-commercially.
Editor In Chief


.jpg)


Signup for Newsletter

Quick Links
 Editorial Board Registrations
 Submit your Article
 Refer a Friend
 Advertise With Us
Our Recent Edition

.jpg)


Top Editors


.jpg)


.bmp)
.jpg)
.png)
.jpg)


.jpg)


.png)

.png)


.png)


Financial Support

Sponsors

Latest e-Books

Latest Video

 a Creative Commons Attribution 4.0 International License. Based on a work at www.crimsonpublishers.com.
Best viewed in
a Creative Commons Attribution 4.0 International License. Based on a work at www.crimsonpublishers.com.
Best viewed in