
- About Us
- Information
-

The Author ensures that the research has been conducted responsibly and ethically with adherence to all relevant regulations. read more..
- For Authors
- For Reviewer
- Manuscript Guidelines
- Membership
- Publication Ethics
-
- Journals
- Reprints
- e-Books
- Videos
- Policies
- Contact Us
 COVID-19
- Submissions


Full Text
Aspects in Mining & Mineral Science
Reaction Rates of 2SiO2+SiC=3SiO+CO in Pellets at Elevated Temperatures
Merete Tangstad1*, Jafar Safarian1, Sarina Bao2, Eli Ringdalen2 and Aasgeir Valderhaug3
1Jafar Safarian, NTNU, Material Science and Engineering, Norway
2SINTEF, Materials and Chemistry, Norway
3Elkem Technology, Norway
*Corresponding author: Merete Tangstad, NTNU, Material Science and Engineering, Jafar Safarian, Norway
Submission: June 24, 2019;Published: July 18, 2019

ISSN 2578-0255Volume3 Issue2
Abstract
The reaction rate for the reaction 2SiO2+SiC=3SiO+CO has been measured for various polymorphs of
SiO2, for various gas atmospheres and in a temperature area from 1923-2273K (1650-2000 °C). It has
previously been theorized that cristobalite has a higher reaction rate compared to quartz, but it was
found that there was no difference between the polymorphs quartz or cristobalite. The activation energy
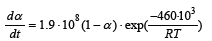
was found to be between 424-464kJ/mole and the reaction rate was found to be expressed by the equation
 where α is the fraction of the sample reacted,
varying from 0 to 1. The term 1.9·108 represent the reaction area times the reaction constant.
where α is the fraction of the sample reacted,
varying from 0 to 1. The term 1.9·108 represent the reaction area times the reaction constant.
 if the area of SiO2 determines the reaction rate or
 if the SiC determines the reaction area. In
some of the experiments the SiO2:SiC ratio was measured after the experiment and it was seen that some
side reactions, like elemental silicon formation, would also take place.
if the SiC determines the reaction area. In
some of the experiments the SiO2:SiC ratio was measured after the experiment and it was seen that some
side reactions, like elemental silicon formation, would also take place.
1. Keywords:Polymorphs; Silicon; Conductivity; Raw materials; Temperature
Introduction
In the production process of silicon from quartz and carbon-materials, the production of silicon is produced through intermediate steps where SiC and SiO-gas is produced [1]. Though the overall reaction, and the mass balance, would be close to the following reaction SiO2+2C=Si+2CO, this is not describing the reactions in an industrial silicon furnace. In the low temperature zone SiC is produced through the reaction

In this part of the furnace the SiO-gas will also dissociate to Si+SiO2. The SiO-gas will also react with CO-gas to produce SiO2 and SiC. When the SiC and the SiO2 are entering the high temperature zone, which is higher than 2073K (1800 °C), the SiO2 and SiC will produce SiOgas and silicon according to the following reactions:

>The main reaction of the quartz is hence the reaction with SiC according to reaction (2). There are a number of questions of how various types of industrial quartz will affect this reaction; will the transformation of quartz to cristobalite affect the reaction rate and especially; will SiO-gas be produced at lower temperatures, higher up in the furnace, affecting the total silicon yield. This paper investigates the reaction rates of this reaction, reaction (2), to answer some of these questions. This reaction may also be of importance when agglomerates of SiO2 and carbon are used. The first reaction that occurs in the agglomerates will be SiO2+3C=SiC+2CO. Any surplus of SiO2 will then again react with the produced SiC, according to reaction (2) [2,3]. It must however be mentioned that if SiO2 and carbon are mixed, the main product may also in this case be SiO-gas and not SiC, depending on the setup and geometry of the reactants [4]. Reaction (2), 2SiO2 + SiC =3SiOg+COg, is believed to be very slow at low temperatures, that is below 2073K and hence in this study, pellets, made of SiO2+SiC particles, have been chosen as a raw material to obtain a higher reaction area, and hence a higher reaction rate.
Natural quartzes will go through various phase transformations with heating. At low temperature it will be present as α-quartz. At atmospheric pressure there will be a second-order phase transformation to β-quartz at 846 K (573°C) [5]. Before entering the high temperature phase cristobalite, it will transform to an amorphous phase. The extent of the amorphous phase varies between different natural quartzes as described by Ringdalen [6,7]. Pure SiO2 will melt at 1996K (1719 °C). It is however seen that it may start to soften at temperatures between 1873-2073K (1600 to 1800 °C). This shows that the reaction between SiO2 and SiC may occur with various polymorphs and different stages of solid, softened and melted. It can however be mentioned that the viscosity of liquid SiO2 is very high. It will be 2·107 Poise at the melting temperature and decrease to 5·104 Poise at 2273K (2000 °C). The reaction rate may be affected by the polymorph , also in the solid state. Wiik [2] suggested that cristobalite would give a higher reaction rate when SiO2 reacted with carbon, compared to quartz. Hakamada et al. [8] suggested that amorphous silica would react faster than quartz, both with C and with SiC.
Figure 1:Illustration of the reaction 2SiO2(s)+SiC(s)=3SiO+CO.

The SiO2 particles reacting with SiC particles, forming SiO and CO gas, can be illustrated in Figure 1. Two solids particles have a small surface area where they meet, and it is hence believed that two solid particles can only react through the gas phase. The gas species reacting will be CO, SiO and CO2 gas, however the pressure of CO2 gas will of course be very low at these temperatures. The overall rate of the reaction can generally be expressed as the general equation for all kinetic reactions:

The rate in this context can be weight change per time unit, dw/dt, or fraction of reactant reacted per time unit dα/dt, where α is fraction of reactant reacted. α will then go from 0 when no reaction has occurred and to 1 when all of the reactant is consumed. Typically α can be given in % instead of fraction. The correlation between the two parameters describing the reaction rate is:

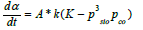
The initial weight of the sample is wo. When the reaction rate is kinetically controlled by the chemical reaction, the driving force is the distance from equilibrium. Typically the distance from equilibrium can be given by the difference between the equilibrium constant K and the ratio of the real gas pressures Q:

pSiO is partial pressure of SiO gas, pCO is partial pressure of CO gas, aSiO2 is activity of SiO2 in quartz and aSiC the activity of SiC. Based on this equation it is seen that when CO is added to the system, the reaction is expected to go slower. The resistivity is generally given as the inverse conductivity, where the conductivity typically is a function of temperature and the geometrical relations between the reactants. This can mathematically be written:

Where A* is the geometrical factor and k is the rate constant.
A* is dependent on the shape and form the raw materials, and how
they are mixed (sizing, pellets, particles etc), and the total size of
the raw materials, that is the extent of the reaction, α. It is also
expected that A* will change dramatically when the quartz melts.
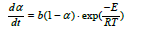
k is a rate constant that depends on temperature according to the
Arrhenius equation: 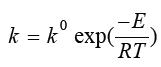 ,
where E is the activation energy, R is
the gas constant and T is the temperature in Kelvin. Based on the
above discussion, the rate can be written accordingly:
,
where E is the activation energy, R is
the gas constant and T is the temperature in Kelvin. Based on the
above discussion, the rate can be written accordingly:
The real gas pressures of SiO and CO in the pellets are not known and the rate equation can be simplified as:
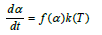
The simplification is a product of one function that takes care of the geometrical relations, f(α), and one that takes care of the temperature, k(T). It must be emphasized that this temperature dependent part is also taking care of the temperature dependent part in the equilibrium constant. This is also discussed previously by Filsinger et al. [9]. A number of investigators have studied this reaction previously. Their work is summarized in Table 1. The reaction has been studied over a large temperature area, both above and below the melting temperature. With the exemption of Khrushchev [10], the activation energy was found to be in the area of about 350-550kJ/mol. The total temperature range investigated is from 1543K to 2306K (1270-2033 °C), both below and above the melting temperature of SiO2. Khrushchev was measuring higher activation energy compared to the others, of about 800 kJ/mol above the melting temperature. The high activation energy was attributed to carbon diffusion in SiC being the rate determining step, as the temperature dependency of the C diffusion in SiC is in the same area. This can possibly be contributed to the larger particle size used of 0.16-0.20mm.
Table 1:Previously published data for the activation energy for the reaction SiO2+SiC=3SiO(g)+CO(g)

Raw Materials, Apparatus and Procedures
An industrial quartz was used in the experiments, labelled Qz20. As one of the variables was type of polymorph, some of the material was crushed to 1-3mm particles and heat-treated in air at 1823K (1550 °C) for 24 hours to be completely transformed to cristobalite. This material is labelled Crist20. Both the quartz and the cristobalite samples were then crushed in a ball-mill until the particles had a size of 17-30μm. The quartz source had a purity of 98.9% SiO2. The SiC used was industrially produced SiC by the Acheson process with 99.3% SiC. The SiC was also crushed to an average size of 32μm. Green pellets were made from SiO2 and SiC particles in a pelletizing drum. The drum has 70cm diameter and 15cm height and can produce up to 10kg batches. Green pellets with 1-4mm diameter (400-800g total mass) were produced by using water only and no specific binder. For most of the experiments the mole ratio of SiO2:SiC was 2:1 (mass ratio 3:1) in order to keep the stoichiometry of the reaction. The green pellets contained 10-15% water and they were dried at 378 K (105 °C) for 20 hours followed by calcination at 1473K (1200 °C) in a muffle furnace to remove any volatile matter. Heating rate was 150K/min to 923K (650 °C) followed with 250K/min to 1473K (1200 °C) and then held for 15min. The final heating was done to increase the strength of the pellets. Figure 2 shows a typical image of the produced pellets.
Figure 2:Illustration of the reaction 2SiO2(s)+SiC(s)=3SiO+CO.

The reaction rate was studied by heating the pellets in a graphite tube furnace as shown in Figure 3. There are two main chambers in the furnace, one reaction chamber and one condensation chamber. In the reaction chamber, the pellets are placed on a sieve in a graphite crucible. Process gas is flowing through the sample, in these experiments a mixture of CO- and Ar-gas. The temperature is measured in the sample. During the experiment, SiO-gas and COgas will be produced. The SiO-gas will condensate at 4-6mm SiC particles in the condensation chamber, and the CO+Ar gas from the reaction chamber will meet with the Ar furnace gas. For all the experiments in the present study a furnace gas flow as 1.73 Nl/min for Ar is used. This gas is sucked into the gas analyzer where the CO and CO2 contents are measured. The gas analyzer is an ABB AO2020. It can be mentioned that the CO2 content is very low, that is less than 0.3% during the experiments and is not discussed further here. In this work a pellet bed with around 5cm height (20±0.5 g) is used. A heating rate of 15K/min is used upto isothermal temperature. A typical heating rate is shown in Figure 4. It can also be seen that the sample temperature and the furnace temperature is quite close. All experiments were performed for 1 hour at isothermal temperature. The process gass containing 75%Ar and 25%CO with total flow of 0.8Nl/min for the experiments is mainly used in the present study. The process gas is supplied around 1273K (1000 °C). Table 2 shows an overview of the experiments performed. The main variables were type of quartz, type of polymorph, temperature, SiO2:SiC ratio and gas composition. In these experiments the main results are the total weight loss of the sample, measured before and after the experiments. The gas analyzes of the CO in the off gas is also important to see the development of the reactions. Small uncertainties in the CO analyzer are however giving large uncertainties, and hence, the accumulated CO production is calibrated with the total weight loss. In some of the experiments the gas analyzer was not working. The total weight loss data has still been included to give a better understanding of the extent of the reaction.
Figure 3:Carbon tube furnace with two chambers; one reaction chamber, marked 6, and one condensation chamber, marked 9.

Figure 4:Typical heating profile during experiment at isothermal temperature of 2073 K (1800°C).

Table 2:Overview of experiments performed, where the main variables are temperature, polymorph of SiO2, SiO2:SiC ratio and gas composition.

Results and Discussion
The overall extent of reaction for the various reactions is shown in (Table 2) given in % conversion. In the following the effects of different variables are discussed.
Effect of polymorph
Figure 5:Conversion (wt.%) after 60 minutes at different temperatures (degrees Celcius). Quartz and cristobalite are used as raw materials. All experiments are done in CO-Ar gas mixture containing 25 vol% CO.

Figure 5 shows the conversion of the samples as a function of temperature at 25% CO in the process gas comparing the difference between cristobalite samples and the quartz samples. It is seen that the difference in conversion is insignificant between the two types of samples. As the cristobalite has a lower density and hence a higher volume, it will also have a higher surface area as it will crack in the transformation from quartz to cristobalite. It was thus believed that cristobalite will react faster than the quartz [2]. This is however not the case in this study, where actually the quartz is on the top of the curve, with insignificantly higher conversion. As we are above the transformation temperature to cristobalite above 1673K (above 1400 °C) also the quartz samples will have started to be transformed to cristobalite. This transformation is however quite slow, and it is believed that at least in the start of the isothermal temperature, the sample is not transformed to cristobalite. At 1973K (1700 °C) maximum 20% of cristobalite was formed after 40 minutes [11]. This was however not the same quartz used in this work. From the same work, it was seen that the amount of amorphous phase may vary significantly between different quartzes and one may speculate that the amount of amorphous phase is more significant than the amount of cristobalite. As the amorphous phase is more “unstructured” and the bindings are weaker, this is a plausible theory. For the discussion, it can also be mentioned here that between reproducible experiments the results show about 15% difference. This is especially seen at 1800 °C, where the quartz is melted but still very viscous. Assuming that there is a negligible difference between quartz and cristobalite, the variance is lower at lower temperatures.
Effect of gas composition
Figure 6:Conversion (wt.%) at increasing CO content in the process gas. (Both quartz and cristobalite experiments are included. All experiments at 2073K (1800°C)).

Figure 6 shows the conversion in wt% as a function of gas composition for pellets at 1800 °C for 60 minutes. It is seen that the results obtained at 0% and 25% CO do not give a significant difference, however at 100% CO the reduction rate is significantly slower. This is a natural consequence of CO being produced. The equilibrium pressure of SiO should be shifted, as well as the kinetics, both leading to a lower conversion degree. The two experiments at 100% Ar only showed a total conversion of about 80wt.%. When studying the CO curve during the experiments, Figure 7, one can see that even though the degree of reaction reached only 80%, the reaction stopped more or less completely after 30 minutes, that is half time. If compared to the experiments with 25%CO, though having a total degree of conversion of about 80%, their reaction lasts the entire 60 minutes, and hence the reaction in 100% Ar is much faster than the 25% CO when looking at the CO in the off-gas. This is in accordance with the results both from [12,13]. It can also be mentioned that these results are similar as Agarwal and Pal [14] found for the SiO2+C reaction, where 100%Ar and 20%CO gave the same reaction rate, and 100% CO significantly decreased the rate.
Figure 7:Temperature and CO gas evolution versus time for experiments 24 and 25 with 100% Ar.

Discussion of the stoichiometry of the reaction
Figure 8:Conversion (wt.%) at various SiO2:SiC weight ratios (As the difference between 0%CO and 25% CO, and between quartz and cristobalite was insignificant, all results are included in the graph).

Figure 9:Mass (g) reacted per mass (g) SiO2 as a function of temperature (same experiments as Figure 8).

The main reaction is according to previous discussions: 2SiO2+SiC=3SiO+CO. As the SiO2 to SiC mole ratio is 2:1 the SiO2 to SiC weight ratios will be 3:1. In some of the introductory experiments the total carbon content and oxygen content is measured and recalculated to amount of SiO2 and SiC. After the experiment the SiO2:SiC weight ratio was in the area of 3.65-3.91. This means that more SiC has been consumed compared to the stoichiometric amount. This could be due to the reaction SiO2+2SiC=3Si+2CO, where more SiC is consumed. In this reaction the stoichiometric SiO2:SiC weight ratio is 1:3. Based on this, experiments were performed with various SiO2:SiC ratios. The results are shown in Figure 8 & 9. It is seen that when increasing the SiO2 and decreasing the SiC ratio, the total conversion is decreasing. If assuming that some of the SiC is inert and that production is based on the reaction 2SiO2+SiC=3SiO+2CO, the reaction rate should be proportional to the SiO2 content. Figure 9 shows the reaction degree per gram of SiO2. It is seen that the one with the higher amount of SiC has slightly higher reduction rate, which shows that there is some reactions in addition to 2SiO2+SiC=3SiO+2CO, consuming more SiC. It is hence believed that at 1800 °C some elemental silicon is produced, though this is not verified and was not seen in SEM analyses. The theory of silicon production is in line with Pultz and Hertl [12] who estimated that 2-6% of the SiO2 would react according to the silicon production reaction. They were however at a much lower temperature where even lower level of silicon should be produced. Khrushchev [10] measured silicon present at higher temperatures, as it should be produced at temperatures higher than 2073K (1800 °C) [1].
Effect of temperature on the SiO2-SiC reaction
Figure 10:Reaction rate and temperature above 1640°C for experiment 5.

As seen in all the figures, the reaction rate is dependent on temperature. The %CO in the off-gas can be used to find the CO produced from the chemical reaction. The accumulated amount of CO is calibrated against the total weight loss, as the weight loss is more accurate. This is again used to calculate the degree of conversion, α, and the rate given in dα/dt. These calculations are done for all experiments where a sensible CO is measured. Most of the experiments are performed at isothermal conditions as illustrated in Figure 10. According to the overall reaction rate equation, it is assumed that at a given degree of conversion, e.g. α=0.4, the reaction rate is only varying with the temperature, and the activation energies can be calculated based on a constant conversion. If the isothermal temperature is reached at α=0.3, α=0.4, α=0.6 and α=0.8, the reaction rate is given from the curves as shown in Figure 10-12 show the logarithmic value of the rate versus the inverse temperature in degrees Kelvin. The slope is the negative E/R, and E values are shown in Table 3. As seen in Figure 10, the readings where 30% is reacted, is very close to the top of the curve, and may be an outlier. The average E, based on numbers of measurements, is calculated to be 424kJ/mole including α=0.3, and 464 kJ/mole excluding 30% conversion. In the following the value of 460 kJ will be used for modelling. (Table 3) compares the various activation energies found for the reaction 2SiO2+SiC=3SiO+CO in previous works. The range varies from 350 to 700kJ/mol, but most are in the same area of 460kJ determined in this study. The activation energy below 1973K (1700 °C) is found to be around 350kJ/mol in some investigations. Above the melting temperature, activation energy closer to the obtained 460kJ would fit better.
Table 3:E (kJ/mole) values for the various curves.

Figure 11:ln(dα/dt) versus 1/T(K) for α=0.8 and α=0.6 in experiments with SiO2 to SiC ratios of 3:2 and 1:1.

Figure 12:ln(dα/dt) versus 1/T(K) for α=0.4 and α=0.3.

Modelling reaction rates for pellets with a SiO2:SiC ratio of 3:1
As discussed in the first part of this paper, the reaction rate for the pellets can be modelled with the following model:

where f(α) is only dependent on the degree of conversion α, and k(T) is given by the Arrhenius equation and is only dependent on the temperature. It was found that the activation energy was 460 kJ/mole. As seen in Figure 13, the last part of the experiment where the experiment is isothermal, the reaction rate is close to proportional to (1-α). The total reaction rate can hence be written
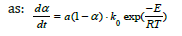
As both a and ko is constants and their product is b, thus b=a· ko, and thus the equation can be rewritten as::
Based on this equation b=1.9·108 found by least square method based on α. If the least regression method was used on dα/dt, b=1.7·108, that is in the same area. As we are mostly interested in the last part of the experiment, that is the isothermal part of the experiment, it is chosen to use the b value based on α. By using this formula the calculated and modelled values of degree of conversion, α, and the reaction rate, dα/dt, can be compared in Figure 14-19. There are some inaccuracies between the calculated and the modelled values. First, the experiment performed at 1650 °C show a large inaccuracy compared to the model (Exp. 7) and may be assumed to be an outlier, as also seen in the 1650 °C curve in Figure 13. Next, for most of the experiments the modelled rate is too high in the heating period, and hence will be too low in the isothermal period. This may be due to a delayed heating of the materials compared to the measured temperature. The real temperature inside of the pellets will hence be lower than the furnace temperature during heating. The reaction area of the SiO2 and SiC particles are assumed to be of importance, independent on the most reaction mechanisms. Agarwal et al. [14] found e.g. that the reaction between SiO2 and C was governed by the surface reaction model. It can be assumed that the reaction is proportional to the surface areas of the SiO2 or the SiC particles. The surface areas can be calculated by assuming mono-sized spherical particles. The SiO2 and SiC particles are about 24 and 32μm in diameter and have a density of 2.5 and 3.2 g/cm3 respectively. The factor b will then be a function of the starting area of the SiO2, AoSiO2=1.5·104 cm2, or the SiC, AoSiC=2.9·103 cm2. That is one of the two following reactions:
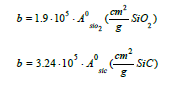
Figure 13:Measured reaction rate versus conversion (weight fraction) for pellets with a SiO2:SiC wt.ratio of 3:1 at various temperatures.

Figure 14:Calculated and modelled α for A) exp. 5 and B) exp. 6.

Figure 15:Calculated and modelled α for A) exp. 7 and B) exp. 8.

Figure 16:Calculated and modelled α for A) exp. 9 and B) exp. 26d.

Figure 17:Calculated and modelled reaction rate for A) exp. 5 and B) exp.6.

Figure 18:Calculated and modelled reaction rate for A) exp. 7 and B) exp. 8.

Figure 19:Calculated and modelled reaction rate for A) exp. 9 and B) exp. 26d.

Conclusion
Experiments were performed to investigate the reaction rate of the reaction of 2SiO2+SiC=3SiO+CO. The raw materials used where pellets of SiO2 and SiC in various ratios. The quartz used was a rather pure commercial quartz. It was seen that when increasing the SiC amount higher than the stoichiometric amount, the reaction rate per gram of SiO2 increased, which shows that there are some minor amount [15,16] of side-reactions in addition to the above mentioned reaction. The side reaction could be the production of elemental silicon. As expected, pure Ar gave a higher reduction rate compared to adding 25% CO in the process gas. The reaction rate of the pellets could be modelled as follows:
 where
where 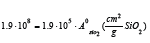 if the area of
SiO2 determines the reaction rate or
if the area of
SiO2 determines the reaction rate or 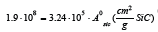 or if the SiC
determines the reaction area.
or if the SiC
determines the reaction area.
References
- Schei A, Tuset JK, Tveit H (1998) Trondheim: tapir forlag. p. 25-72.
- Wiik K (1990) PhD Thesis Norwegian University of Science and Technology, Trondheim, Norway.
- Li F, Tangstad M (2017) Metallurgical and materials transactions B. 48: 853-869.
- Ksiazek M, Tangstad M, Dalaker H, Ringdalen E (2014) Metallurgical and materials transactions E. 1(3): 272-279.
- Stølen S, Grande T (2004) John Wiley and Sons Ltd. New Jersey, United States. p. 30-33.
- Ringdalen E, Tangstad M (2016) The 10th International Conference on Molten Slags, Fluxes and Salts (MOLTEN16) Seattle USA.
- Ringdalen E, Adisty D, Kolbeinsen L (2014) Celebrating the megascale: Proceedings of the extraction and processing division symposium on pyrometallurgy in honor of David G.C. Robertson. John Wiley & Sons New Jersey, United States. p. 225-236.
- Hakamada M, Fukunaka Y, Oishi T, Nishiyama T, Kusuda H (2010) Metallurgical and materials transactions B. 41B.
- Filsinger DH, Bourrie DB (1990) Silica to Silicon: Key Carbothermic Reactions and Kinetics. Journal of the American Ceramic Society 73(6): 1726-1732.
- Khrushchev M (2000) Inorganic materials. Pleiades Publishing 36(5): 462-464.
- Kjeldstadli M(2016) MSc thesis, Norwegian University of Science and Technology, Trondheim, Norway.
- Pultz W, Hertl W (1966) Transactions of the Faraday Society. 62: 2499-2504.
- Ni F (2015) Norwegian University of Science and Technology NTNU report, Norway.
- Agrarwal A, Pal U (1999) Metall Mater Trans B. 30: 295-306.
- Andersen V (2010) MSc thesis Norwegian University of Science and Technology, Trondheim, Norway.
- Bao S, Tangstad M, Tang K, Ringdalen E (2013) The 13th International Ferroalloys Congress Almaty, Kazakhstan, Central Asia.
© 2019 Merete Tangstad. This is an open access article distributed under the terms of the Creative Commons Attribution License , which permits unrestricted use, distribution, and build upon your work non-commercially.
Editor In Chief


.jpg)


Signup for Newsletter

Quick Links
 Editorial Board Registrations
 Submit your Article
 Refer a Friend
 Advertise With Us
Our Recent Edition

.jpg)


Top Editors


.jpg)


.bmp)
.jpg)
.png)
.jpg)


.jpg)


.png)

.png)


.png)


Financial Support

Sponsors

Latest e-Books

Latest Video

 a Creative Commons Attribution 4.0 International License. Based on a work at www.crimsonpublishers.com.
Best viewed in
a Creative Commons Attribution 4.0 International License. Based on a work at www.crimsonpublishers.com.
Best viewed in