
- About Us
- Information
-

The Author ensures that the research has been conducted responsibly and ethically with adherence to all relevant regulations. read more..
- For Authors
- For Reviewer
- Manuscript Guidelines
- Membership
- Publication Ethics
-
- Journals
- Reprints
- e-Books
- Videos
- Policies
- Contact Us
 COVID-19
- Submissions


Full Text
Associative Journal of Health Sciences
P-wave Detection by the Application of Spatio Temporal Filtering and Statistical Metrics
Jader Giraldo-Guzma1* and Oscar Porto Solano2
1Postdoctoral Research Associate, Mallinckrodt Institute of Radiology, Washington University in St. Louis, St. Louis, USA
2Faculty of Mechanical, Electronic and Biomedical Engineering, Universidad Antonio Narino, Cartagena de Indias, Colombia
*Corresponding author:Jader Giraldo- Guzma, Mallinckrodt Institute of Radiology, Washington University in St. Louis, St. Louis, MO, USA
Submission: September 05, 2024;Published: September 18, 2024

ISSN:2690-9707 Volume3 Issue3
Abstract
Cardiovascular diseases are the leading cause of death in the world, and among them Atrial Fibrillation is the most common cardiac arrhythmia affecting up to 2% of the world population. During the early stage of Atrial Fibrillation, the events appear and disappear randomly which makes the diagnosis challenging. Many approaches are based on the R-R variability to perform the mostion of the signal as Atrial Fibrillation, but it is well known the R-R variability is a common feature in most of the arrhythmias and it can lead to a miss- classifications. Instead, Atrial activity (P wave) contains the most relevant information about the atrial conduction, and therefore approaches based on extracting features from P wave are more reliable in the diagnosis of atrial arrhythmias. In this work, a robust methodology for the detection of the P wave is presented. The approach is based on exploiting spatial and temporal information contained in 12-lead ECG when the atrial and ventricular activity is correlated. The result shows a positive predictive value of 100% in the 70% of the cases and a minimum of 90% for a few cases in normal sinus rhythm signals.
Keywords:Spatio-temporal filtering; Atrial fibrillation; P wave; ECG signal processing; QRST cancellation
Introduction
Electrocardiogram (ECG) is one of the most used diagnostic tools for cardiovascular diseases. ECG allows to record the electrical activity of the heart by placing electrodes on the skin surface, however reliable methods to extract information from them and perform the diagnosis are needed. A common approach performs the segmentation of the different waves to extract information about the condition of the patient. Then, the data is used as input for a machine learning or heuristic approach to classify the signal. Methods to classify AF can be categorized in three groups: The first group is based on the quantification of the heart rate variability, among them [1-3]. These approaches detect the QRS complexes and then the distances among them. Afterward, the variability of the distances is measured by dispersion metrics.
The second group is based on atrial activity characterization, and among them wavelet transform, which allows a time-frequency representation has been widely used [4,5]. However, other approaches have been explored, for instance, in 2015, Ladavich et al. [6] employed morphological and statistical features to train a Gaussian mixture model, successfully identifying the absence of the P waves [6], most recent in 2021 Marsanova et al. perform a reliable detection of the P wave in eight parts including QRS complex, T wave detection, AFIB detection among others, [7]. Despite the good results obtained by heart rate variability and atrial activity characterization, the third group which uses a hybrid approach of these two report the best performance. These methods use the features extracted (either heart rate variability or features related to the atrial activity) as inputs for a machine learning or heuristic approach to perform the classification [8,9]. This paper presents a novel approach for the detection of the P wave. The methodology involves several key steps for signal analysis. It begins with signal pre-processing, followed by QRS detection using the Pan-Tompkins algorithm. After QRS detection, QRS complexes are suppressed by introducing low frequency white Gaussian noise. Matrices containing samples to enhance and suppress (denoted as A and B) are then constructed. The Spatio-Temporal Filter (STF) is applied to the data. To optimize the process, the top 3 of STF output are selected based on kurtosis. Finally, the analysis concludes with the computation of P wave indices, providing comprehensive insights into the signal characteristics.
Spatio-Temporal Filtering
The Spatio Temporal Filtering (STF) is useful to perform a single channel output with enhanced components selected as desired signal and suppressed ones selected as noise signal [10]. For this purpose, the filter exploits spatial and temporal information contained in 12 leads data input. The operation is performed as follows: for a K channels signal, every channel is expanded adding the j·τ samples before and after every n sample as is shown below:
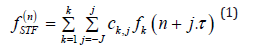
The parameters J and τ determine which signal samples undergo summation.
The operation can be expressed in vector notation as follows:
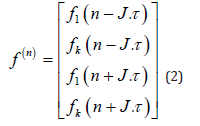
And in matrix notation:
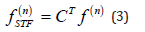
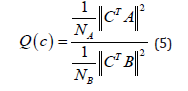
Where c is the vector of coefficients of the filter and J and τ should be selected based on the periodicity of the detected wave fulfilling the requirement that (2J + 1)τ should cover the whole wave. The filter is aimed to produce a peak or high response at places where are located the waves selected as desired signal and a low response at places where are located the noise segments to be suppressed. To compute the vector of coefficients c which allows to obtain this response the following objective function is used:
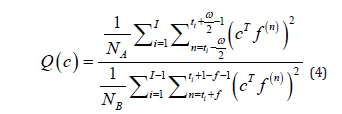
Where ti, i = 1, 2, · · · , I is the vector with the ith indexes where are located the desired segments. ω is the width of the maximized signal segments and NA = ω .I and NB = tI−t1−2(I−1)f is the total number of samples to be maximized and minimized respectively f represents the transition between the desired segments and the noise segments. Summarizing, the numerator of 4 contains the energy of the segments of the desired signal (where the high response of the filter is produced) and therefore the denominator the contains the energy of the segments to be suppressed by the filter.
After the application of 2 the segments with samples to enhance
and suppress will contain the expanded matrices
 and
and  respectively and 4 becomes:
which is equivalent to
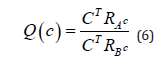
where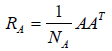 and
and 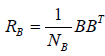 are the covariance matrices of the vectors stored in A and B, respectively.
According to [10], the following equation is obtained:
are the covariance matrices of the vectors stored in A and B, respectively.
According to [10], the following equation is obtained:
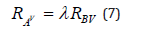
Applying the eigen decomposition of the matrices RA and RB are obtained the associated eigenvalues and eigenvectors. Therefore, the vector c, will be an eigenvector associated to the greatest eigenvalue.
Methodology
This approach is aimed to detect the location of the P waves in
12 leads ECG signals from healthy patients (normal sinus rhythm).
To achieve this, the following methodology is described:
A. Signal pre-processing.
B. QRS detection by the application of the Pan-Tompkins
algorithm.
C. Suppression of the QRS complexes adding low frequency
white Gaussian noise.
D. Construction of the matrices with samples to enhance and
to suppress (A and B).
E. Application of the STF.
F. Selection of the best STF using kurtosis.
G. Computing the P waves indices.
Every step is described in detail in the following subsections.
A. Signal pre-processing
A band pass and moving average filtering are implemented to remove baseline wandering and artifacts. The cut-off frequencies of the band pass filter ranges between 1 Hz and 100Hz whereas the moving average filter is computed for every 10 samples.
B. QRS detection by the application of the Pan-Tompkins algorithm
After removing artifacts QRS complexes are detected. It is important because QRS complexes are a fiducial marker since are the components with the highest energy on the ECG record. It is well known that the classic Pan-Tompkins algorithm might not perform well in the presence of arrhythmias as it was reported in previous work [11]. For this stage of the research, only normal sinus rhythm signals are considered, so, it is enough with the classic approach which is developed in five steps: bandpass filtering, differentiator, squaring, integration, threshold as is shown in [12].
C. Suppression of the QRS complexes adding low frequency white Gaussian noise
For this application, the STF should be able to create a single channel signal with peaks at the zones where P waves are located and a low amplitude response at the locations of ventricular activity, QRS-T. However, as it is shown in picture 1, the prominent Q-R slope tends to be projected, producing a high negative peak at the position of the beginning of the Q wave, spoiling the location of the peaks produced at the P wave. To overcome this effect some approaches put to zero the QRS complexes to suppress their high energy. However, the abrupt discontinuity between the signal and the zero segment of the QRS complexes remains projected as a highenergy peak. Therefore, for this approach, we added white Gaussian noise at the position of the QRS complexes to suppress their energy while having a smooth discontinuity. The signal-to noise ratio (SNR) of the noise was computed by the SNR of the segments between the end of the T wave and the beginning of the P wave where there are not deterministic components, but noise.
D. Construction of the matrices with samples to enhance and to suppress (A and B)
Matrices of samples to enhance and suppress A and B, respectively, are constructed from the location of the QRS complexes based on the duration of the waves during normal sinus rhythm. It is well known that the duration of the PR interval during normal conditions ranges between 180ms to 200ms, the duration of the QRS complex ranges between 80ms to 100ms and the duration of the PR segment between 40ms to 42ms. Based on the aforementioned information, the intervals where the P waves can be found are computed as follows:
Therefore, for a frequency sample of 500Hz the P wave can be found between the 125th and the 45th sample from the detected QRS complex. This approach will be applied iteratively, performing a backward search of the P wave from the detected QRS complexes. The length of the samples to enhance is 5 samples in every beat. The matrices with the samples to enhance A will be moved every 5 samples from the offset of the P wave, i.e., the 45th sample from the detected QRS to the 125th, where the onset of the P wave is expected to be.
On the other hand, for the ventricular activity, it is known that the duration of the ST interval is approximately 300ms, so the matrix with the samples to suppress B is fixed like the segments between the 25th sample before the detected QRS complex, at the onset of the QRS complex, to the 175th sample after the detected QRS complex, where the offset of the T wave appears in every beat. Figure 1 shows the procedure to obtain the matrices A (samples to enhance in green) and B (samples to suppress in red).
Figure 1:Projection of the QRS complex at the output of the filter.

E. Application of the STF
After computing the matrices with the samples to enhance and suppress A and B, respectively, the STF is applied iteratively. In each iteration, the samples of the matrix A will be moved 5 samples to the left from the offset of the P wave. The filter is designed to perform 50 iterations. After the 15th iteration, it is expected that the samples to enhance will be in the TP interval where there are no waves but the isoelectric line plus noise. Therefore, the response of the filter must be solely noise. Then, from this change in the response is possible to estimate the onset of the P wave.
F. Selection of the best STF using kurtosis
In every iteration, the filter yields a different response based on the location of the samples to enhance and suppress the ventricular activity QRS-T. In order to choose the best response of the filter, the kurtosis of every output is computed. For this approach, we selected the top 3 of the outputs with the highest kurtosis and added them to reconstruct the atrial response of the record.
G. Computing the P waves indices
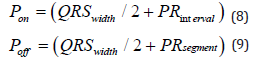
After adding the top 3 of the outputs with the highest kurtosis, a single channel signal is obtained with peaks at the positions of the P waves. From this, the maximum peaks in every beat are obtained using the detected QRS complexes as a reference. Then, the signal is segmented, and every segment has the duration of the PR interval (200ms). The segments are selected for every beat using 8 and 9.
Result
A. Multi-lead ECG database
20 12 leads ECG records were used from the database” A 12- lead electrocardiogram database for arrhythmia research covering more than 10,000 patients” [13]. For this instance, only normal sinus rhythm signals were selected.
B. Qualitative results
Figure 2 shows the performance of the approach in 3 different signals. In blue is the input signal, brown is the output of the approach, and the locations of the P waves are the red star marks. The signal a and b show a successful accomplishment of our approach in all the beats. However, in signal c one miss-detection error was introduced due to an extra ventricular beat. This case is interesting because the signal is labeled as normal sinus rhythm even though the ventricular extrasystole beat. The filter detected the extra beat as a P wave which is not right because there is no atrial activity in the beat.
Figure 2:Performance of the approach detecting P waves location. The subplots a and b show a total successful accomplishment of the method whereas there is a miss-detection error in c due to an extrasystole beat.

Figure 3 shows another interesting result. In spite of the presence of artifacts, the method managed to detect the presence of all the P waves in the record.
Figure 3:Performance of the approach on a noisy signal. The filter is robust enough to handle the P wave detection.

C. Quantitative results
Table 1 shows the results of the detection for all the signals. It is possible to see that in 70% of the signals, the detection was 100% with all the P waves detected correctly. For the rest of the signals, the maximum number of miss classification is only 1 beat, which represents a successful performance of the method. The positive predictive value was computed as is shown below:
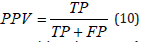
Where TP are the true positives, it means, the detected P waves that are actually P waves while the FP represents the false positive, it means, the detected P waves that are not.
Table 1:Positive predictive value of each record.

Conclusion
The approach performs a successful detection of the P waves even in noisy environments or with artifacts. The miss-classification errors can be related either because of wrong labeling of the signals (or at least not clear) or there are cases where the P wave is located not exactly at the maximum amplitude but there are not cases where the filer was not able to perform any peak in the presence of the P wave which means a successful accomplishment of our approach. On the other hand, since this approach constituted an effective and robust detection of the P waves, it can be used as an initial stage to compute the duration of the P waves in the ECG records, which is a biomarker for atrial cardiomyopathy.
References
- Bashar SK, Ding E, Albuquerque D, Winter M, Binici S, et al. (2019) Atrial fibrillation detection in ICU patients: A pilot study on MIMIC III data. In 2019 41st Annual International Conference of the IEEE Engineering in Medicine and Biology Society (EMBC). IEEE, pp. 298-301.
- Mei Z, Gu X, Chen H, Chen W (2018) Automatic atrial fibrillation detection based on heart rate variability and spectral features. IEEE Access 6: 53566-53575.
- Kruger GH, Latchamsetty R, Langhals NB, Yokokawa M, Chugh A, et al. (2019) Bimodal classification algorithm for atrial fibrillation detection from m-health ecg recordings. Computers in Biology and Medicine 104: 310-318.
- Rodenas J, Garcia M, Alcaraz R, Rieta JJ (2015) Wavelet entropy automatically detects episodes of atrial fibrillation from single-lead electrocardiograms. Entropy 17(9): 6179-6199.
- Garcia Teruel M, Rieta Ibanez JJ, Alcaraz Martinez R, Rodenas Garcia J (2016) Application of the relative wavelet energy to heart rate independent detection of atrial fibrillation. Comput Methods Programs Biomed 131: 157-168.
- Ladavich S, Ghoraani B (2015) Rate-independent detection of atrial fibrillation by statistical modeling of atrial activity. Biomedical Signal Processing and Control 18: 274-281.
- Saclova L, Nemcova A, Smisek R, Smital L, Vitek M, et al. (2022) Reliable P wave detection in pathological ECG signals. Scientific Reports 12(1): 6589.
- He R, Wang K, Zhao N, Liu Y, Yuan Y, et al. (2018) Automatic detection of atrial fibrillation based on continuous wavelet transform and 2d convolutional neural networks. Frontiers in Physiology 9: 1206.
- Xia Y, Wulan N, Wang K, Zhang H (2018) Detecting atrial fibrillation by deep convolutional neural networks. Computers in Biology and Medicine 93: 84-92.
- Kotas M, Jezewski J, Horoba K, Matonia A (2011) Application of spatio-temporal filtering to fetal electrocardiogram enhancement. Computer Methods and Programs in Biomedicine 104(1): 1-9.
- Giraldo-Guzman J, Ruiz E, Colorado LAM, Lasprilla GIB, Kotas M (2020) A novel approach for QRS complex detection in patients with atrial arrhythmia. In 16th International Symposium on Medical Information Processing and Analysis 11583: 211-219.
- Pan J, Tompkins WJ (1985) A real-time QRS detection algorithm. IEEE Transactions on Biomedical Engineering 32(3): 230-236.
- Zheng J, Zhang J, Danioko S, Yao H, Guo H, et al. (2020) A 12-lead electrocardiogram database for arrhythmia research covering more than 10,000 patients. Scientific Data 7(1): 48.
© 2024 Jader Giraldo-Guzma. This is an open access article distributed under the terms of the Creative Commons Attribution License , which permits unrestricted use, distribution, and build upon your work non-commercially.
Editor In Chief


.jpg)


Signup for Newsletter

Quick Links
 Editorial Board Registrations
 Submit your Article
 Refer a Friend
 Advertise With Us
Our Recent Edition

.jpg)


Top Editors


.jpg)


.bmp)
.jpg)
.png)
.jpg)


.jpg)


.png)

.png)


.png)


Financial Support

Sponsors

Latest e-Books

Latest Video

 a Creative Commons Attribution 4.0 International License. Based on a work at www.crimsonpublishers.com.
Best viewed in
a Creative Commons Attribution 4.0 International License. Based on a work at www.crimsonpublishers.com.
Best viewed in