
- About Us
- Information
-

The Author ensures that the research has been conducted responsibly and ethically with adherence to all relevant regulations. read more..
- For Authors
- For Reviewer
- Manuscript Guidelines
- Membership
- Publication Ethics
-
- Journals
- Reprints
- e-Books
- Videos
- Policies
- Contact Us
 COVID-19
- Submissions


Full Text
Academic Journal of Engineering Studies
Miluo River Pingjiang Reach Flood Risk Assessment
Changzhi Li1*, Xiaolei Z1, Haiying W2 and Xiaolin L3
1China Institute of Water Resources and Hydropower Research (IWHR), China
2Zhangjiakou Water Resources development and Planning Center, China
3Pingjiang Urban Construction Investment Service Center, China
*Corresponding author:Changzhi Li, China Institute of Water Resources and Hydropower Research (IWHR), Beijing, China
Submission: July 11, 2022; Published: July 19, 2022
.jpg)
ISSN:2694-4421 Volume3 Issue1
Abstract
It is highly important to evaluate flood risk at river basin scale to make specific proposals for structural and nonstructural options for flood management. The Miluo river, a typical flood prone area in Hunan province, China, was taken as an example to discuss flood risk assessment and countermeasures at river basin scale. Based on digital elevation model data, remote sensing data, local hydrologic data for this basin, analysis was performed on hazard of floods, vulnerability of exposures and flood risk by Hazard- Vulnerability Overlay Analysis Approach (HVOA), and main conclusions were drawn as follow: (1) it is feasible to perform flash flood risk analysis by HVOA approach, in which the computed area for hazard level assessment should be the entire river basin while the sites of interest was on only part of the basin; (2) it is important to manage residual risk and future risk, though the significant benefits of flood control will be achieved by the proposed subproject activities; and (3) risk management is still important for Pingjiang county to improve flood management capacity with the proposed project implementation, and some specific options were suggested on structural and nonstructural measures to achieve this objective at the Miluo River Basin scale.
Keywords:Miluo river; Flood risk assessment; Risk management
Introduction
As one of the most common disaster-inducing factors, floods do harm not only to the lives and properties, but also to the social and economic development, flood risk management has been increasingly become the core contents in flood management practice. One important issue for flood risk management is how detailed do we need to perform flash flood risk analysis [1]? Plate E J proposed that flood risk and flood management was classified as three levels of operational level, project planning level and project design level [2]. Obviously, different level needs different information requirements. The concept of flood risk was traditionally defined as the results of the probability and consequences of flooding, but currently the definition as the comprehensive effect of hazard, exposure, and vulnerability, has been increasingly accepted by researchers. First, as one of the significant aspects of flood risk, hazard assessment analysis was conducted by many studies on the factors leading to flood, such as rainfall, hydrological feature, geology, landform, landcover, soil type [3] and/ or the mechanism among the factors [4], or the significance of each factor triggering flood [5,6]. Second, exposures to flood are the significant aspect for flood risk assessment, on which many studies in China were mainly concentrated on lives loss mitigation or avoidance, but increasingly on various infrastructures, not only on stationary exposures, but also on those movable exposures [7]. Third, vulnerability is commonly described as the susceptivity and the opposite of resistance of exposures to flood hazard [8,9] and has been paid more and more attention by recent risk research with different methods, such as matrix method [10], index method [11], and curve method [12].
Scenario analysis is an important way for flood risk assessment, and the factors for this analysis mainly concentrated on climate change [13-16], land use change and urbanization [17,18]. Commonly, index system approach was utilized to deal with factor and weight issue for flood risk assessment in many research, and various index systems had been proposed by factor-selecting leading to flood through Principal Component Analysis (PCA), and weights assignment through the AHP method and/or expert scoring method. As for the elementary entity for flood risk assessment, it can be classified as two typical categories: grid-based and watershed-based. Most of the existing studies were made on gridbased elementary entity, in which the values of factors resulting in flood were assigned for each entity, then, flood risk assessments were performed according to a certain index system approach [18-22], and only a small number of them were watershed-based elementary entity [23,24]. Technical and data source progress available to flood risk study were very significant in the past decades. GIS and RS technologies, as powerful technical tools, have been extensively used not only to assign weights for different factors and perform grid-based hazard assessment and flood hazard mapping before 2000 [25,26], but also to extract defining hydrologic and hydrodynamic parameters for flood analysis in recent years [27], which had greatly promoted the exploration on how to use the outputs of flood hazard assessment or flood risk assessment, such as land use guidance, flood risk area classification and reduction, and flood insurance. Although the emphases of most existing studies were put on risk assessment for a large region at macro-, at least, meso-scale, it is highly important to perform flood risk assessment at river basin scale to make specific proposals for structural and nonstructural measure activities with objectives of enhancing flood risk management capacity. The Miluo River, a typical flood prone area in Hunan province, China, was taken as an example in this article to discuss flood risk assessment and countermeasures at river basin scale, with objectives: (1) explore a practical method to perform flood risk analysis at river basin scale; (2) identify the risks for the key areas with/without project activities/climate change for the Miluo River Pingjiang Reach; and (3) provide hydrologic and hydraulic information for the proposed subproject activities, and options to enhance the capability of flood risk management for local department of flood management.
Data and Methods
Studied area
Figure 1: Miluo River Basin and Pingjiang county urban areas.

The Miluo River Basin covers drainage area of 5,543km2, with two tributaries originating from their headwaters: one flows westward from Xiushui County, Jiangxi Province; while the other flows eastward from Longzhang Mountain, northeast of Pingjiang County. The two tributaries converge in the northeast part of Pingjiang County, then called as the Miluo River, which has a total river length of 253km, flowing through the Pingjiang County from east to west before it pours into the Dongting Lake, a flood detention basin for the middle reaches of the Yangtze River. The terrain in this basin is generally tilted from northeast to west, high in the north, east and south, and low in the west. The whole basin is from mountains to hills, to the Dongting Lake plain. The area above Changshou Town is the upper reach, surrounded by high mountains; and the area from Changshou to Qingchong is the middle reach, with hills on both sides of the river; while the lower reach area is below Qingchong, with a banded plain on both sides, flat terrain fertile soil, which is the important grain, cotton and cooking oil producing area of the Dongting Lake region. The Miluo River Basin has a subtropical monsoon and humid continental climate, which is charactered by variable temperature, obvious rainy season, and intensive rainfall in rainy season from late March to late August. The distribution of annual rainfall decreases from the south of Jiayi to the northwest at the intersection area of Pingjiang County. The eastern mountainous area of the basin is also the center of rainstorm. The average annual rainfall is about 1,500mm, which is concentrated in April to June, accounting for about 50~60% of the total annual rainfall. Due to the spatial and temporal uneven distribution of rainfall, there are significant changes in rainfall in seasons and years. Pingjiang County, covering four-fifths drainage area of the Miluo River Basin, has 24 townships, a provincial industrial park, and a national-level scenic area, with a total land area of 4,125km2. There are 143 rivers in this county. According to a proposed Project*, 23 subproject activities will be conducted for flood control along the mainstream of Miluo River, 185kms long. Figure 1 presents the basic information of the Miluo River Basin, highlighted the urban area. Figure 1(a) also indicates that the Miluo River Basin takes a shape of wide leaf, so in most cases, floods in the mainstream were resulted from its tributaries and the upper reach areas. Pingjiang county city, just locates in the middle reach area, the upper of the city is a capacious low-lying land while the lower is narrow valleys along the Miluo River. And Figure 1(b) shows the sudden and complicated change of the Miluo River geometry in the urban area.
Conceptual method for flood risk assessment
The concept of risk as the comprehensive effect of hazard, exposure and vulnerability was adopted in this study, that is, flood risk is defined as the overlaying effects of Hazard, Exposure and Vulnerability. Exposure refers to the lives and properties threatened by flood, Hazard generally means the magnitude of flood with certain return period, which can made by typical hydraulic behaviors of flood flow, such as flooding area, water depth, flow velocity, flooding duration, peak discharge, and flood routine, while Vulnerability is one of the attributes of Exposure, reflecting the susceptibility of Exposures to flood hazard. Exposure was regarded as the lives and properties in the flood prone area. Figure 2 presents the procedure of flood risk analysis mainly for stationary exposures used in this study, in which there are six steps. The first step involves data collection and process for the river basin feature, such as drainage area, river channel length, slope, and roughness coefficient; the second step is to perform hazard analysis based on the watershed features and the standard and movement of flood; the third step is to conduct the hazard assessment based on the consideration on standard of flood and hazard analysis; the fourth step, paralleling to step 3, is to make assessment on Exposure and Vulnerability using land use information in the river basin and other; the fifth step is to perform flood risk assessment with the support of outputs from hazard analysis, Exposure-Vulnerability analysis; and step six, the last step, is to use the flood risk outputs for flood risk management. For simplicity and practicality, a method named Hazard-Vulnerability Overlay Analysis (HVOA) was used to perform flood risk analysis for exposures. In this method, flood risk (R) is quantified as a function of the hazard level and vulnerability level. Both hazard and vulnerability are classified with three levels (high, medium, and low) as demonstrated in Figure 3, in which there are 9 blocks marked with Roman letters, and different colors of the blocks in hazard-vulnerability plane represent different risk levels.
Figure 2:Schematics for flood risk analysis.

Figure 3: HVOA method for flood risk assessment.

Flood risk assessment
The analysis on hazard, exposure and vulnerability is the prerequisite for flood risk assessment. In this study, hazard analysis was conducted by hydrological and hydraulic analysis using software packages of HEC-HMS [28] and HEC-RAS [29]; and the Exposure and Vulnerability assessment was conducted using the spatial analysis function of Geographic Information System (GIS) tool. The flood risk assessment was performed according to the HVOA method.
Flood hazard analysis: Based on the meteorological, basin model and terrain model, hydro-hydrodynamic flood modeling was performed by HEC-HMS and HEC-RAS. The outputs of HECHMS are the rainfall-runoff for each subbasin, runoff hydrograph at each junction and river reach. Based on the outputs of rainfallrunoff modeling, a hydrodynamic modeling was performed using HEC-RAS to get flood information, such as inundation area, inundation depth, flow velocity, etc. Two-dimensional full Saint Venant Equations were used to perform flood simulation [29] and the outputs of rainfall-runoff, typically, the hydrographs of the Mugua River, the Zhongdong River, the Jindong River, the Qingshui River, the Changjiang River, the Chaiyu River, and the Luoshui River, were set as the boundaries for hydrodynamic modeling. There are three stations, Jiayi hydrologic station, Pingjiang gauging station, and Wushi hydrologic station along the mainstream of Miluo River, whose flood records were used to calibrate the parameters of the models (Figure 4). Table 1 presents the basic situations of the hydrologic stations. According to the requirements of the software package of HEC-HMS and HEC-RAS, a meteorological model, a basin model, and a terrain model must be created to perform the rainfallrunoff and flood simulation, which are described as follow.
Figure 4: Rainfall hyetograph.

Table 1: Hydrological station in the Miluo River.

a) Meteorological model: The meteorological model for hydrological modeling was developed according to “Hunan Rainstorm-Runoff Computation Manual” [30] and the records at the typical rain gauges within Pingjiang County. Climate change was taken into consideration in the meteorological model to perform rainfall-runoff analysis, in which the scenarios PCP 4.5, RCP 8.5 was used to conduct simulation under different flood return periods, typically, see (Figure 4) and the results of RCP8.5 was adopted for the purpose of covering possible risk.
b) Basin model: According to the river networks and its 23 specific spatial location for structural construction, a distributed hydrological model and a hydrodynamic model covering all of these subproject sites needed to be developed to perform analysis on flow information. The basin model was first developed based Digital Elevation Model (DEM) data of 30-meter spatial solution, then refined based remote sensing image of 2.5-meter resolution and data of field survey. All the subproject sites were set as computing nodes to get flood information. In the basin model, the river basin was divided into 25 sub-basins, 16 river reaches, and 17 junction points. Specially, a distributed hydrological model was developed for the purpose of flow information for all tributaries with subprojects to the urban area. The sketch of the basin model is illustrated in Figure 5, in which, the red points are the proposed structural measure sites. The parameters were assigned based on data of topography and geomorphology, river drainage basin, land use and vegetation cover in the Miluo River basin, and SCS Method was used to perform runoff volume for each subbasin while Muskingum Method was used to simulate flood route in each river reach. And the fundamentals on these methods can be referred to [29,30].
Figure 5:Distributed hydrologic model for rainfall-runoff modeling. (a) Basin model for rural area. (b) Basin model for urban area.

c) Terrain model:There are two terrain models in this study, one is the existing terrain, called “without-project terrain”, the other one is the futural terrain, called “with-project terrain”, based on the proposed structural measures implemented. It is absolutely essential to have a detailed and accurate terrain model in order to create detailed and accurate hydraulics model. In this study, the terrain model of cross section with river channel and flood plain was first developed in consideration of inadequate resolution for hydrodynamic computation of DEM data of 30-meter solution and refined with remote sensing image. The river cross sections were extended to the roads and villages on both banks to cover extent of possible inundation. Over 600 river cross sections were extracted and refined based on the measured data at the proposed structural measure sites, remote sensing image of 2.5-meter resolution, and site investigations, see (Figure 5). Then, a composite terrain model in this hydrodynamic model was developed by combining the crosssection model with DEM data (Figure 6). The total length of the river channel in the terrain model is about 185km, and the model refining was performed as follow. 1) For without-project terrain, as mentioned previously, there were 23 proposed subproject sites along the Miluo River mainstream with structural activities (Figure 1), and the river cross sections had been measured along these river segments and can be used directly to create the terrain model; moreover, these cross sections are also worthy of reference to estimate cross sections along the adjacent river reaches; for river sections where there was no proposed structures in the project, cross sections were estimated based on remote sensing images and DEM data, and then checked by local experienced river engineers.
Figure 6: Terrain model for flood modeling.

The existing structures, typically, dam, sluice, and weir, were taken into consideration during the correction works of cross section. 2) For with-project terrain, a new set of cross sections along the proposed subproject site river section were created according to the location and size of the prosed structures, and the other river sections remain unchanged. Based on the composite terrain model and the measured and estimated cross sections, a 2D flow area was created and subdivided as meshes of 10m×10m in RAS Mapper, and the inflows of tributaries were set as the boundaries for numerical simulation.
d) Flood modeling approach:The methods used for hydrological model were as follows: SCS curve number method was used to compute the loss before the start of surface runoff; SCS unit hydrograph transform method to estimate surface runoff; and flood flow was routed through river reaches with the Muskingum-Conge method for the considerable slope of channel [28]. As for dynamic model, the two-dimensional full Saint Venant Equations were used to perform flood simulation and the outputs of rainfall-runoff were set as the boundaries for hydrodynamic modeling [29]. Assuming that the flow is incompressible, the unsteady differential form of the mass conservation (continuity) equation is as follow.
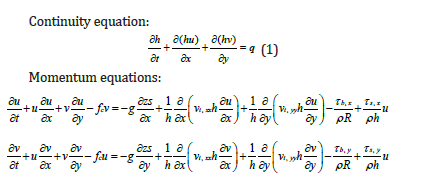
where t is time [s]; u and v, the velocity components in the x- and y- direction respectively [m/s]; q, a source/sink flux term [m/s]; Zs, water surface elevation [m]; ρ, density of water [kg/m3]; g, the gravitational acceleration [m/s2]; v(t,xx) and v(t,yy), the horizontal eddy viscosity coefficients in the x- and y- directions [m2/s]; τ(b,x) and τ(b,y), bottom shear stresses on the x and y directions [kg/m/ s2]; τ(s,x) and τ(s,y), the surface wind stresses on the x and y directions [kg/m/s2]; h, water depth [m]; R, hydraulic radius [m]; and fc, the Coriolis parameter.
Roughness is an important parameter reflecting surface water resistance, determined comprehensively according to the river conditions where the grids located, the composition of land class the distribution of trees and roads, etc. The landuse categories in the Miluo River Basin consist of cultivated land, forest, grassland, wetland, water bodies, and artificial surfaces, and the corresponding value assignments were shown in Table 2.
Table 2: Land use categories and roughness.

i. Flood frequency: According to the relevant requirements of project flood analysis on risk evaluation, and emergency response management in China [31], 4 typical frequencies (10-,20-,50-, and 100-year events) of rainfall-runoff were set for flood simulation.
ii. Climate change: The impact of climate change was taken into consideration by scenarios of PCP 4.5, RCP 8.5. According to the study of climate change by the Project, the daily precipitation intensity with 20-year return period will be the most increment, about 6% (RCP 8.5), which was adopted in this study in that flood risk analysis was based on the principle of “most likely and most unfavorable”. In detail, the daily rainfall intensity was amplified according to the largest increase of rainfall due to climate change, about 6% of current 24hr-rainfall depth, assigned within the most concentrated 3 hours, referred to “(Figure 5) rainfall hyetograph”.
iii. Project impact: According to national code, the flood control standard for river embankment is 5% flood event for county level urban area and 10% flood event for towns in rural area. As mentioned previously, the 23 proposed subproject activities relating to flood control in the project mainly include river channel regulation for mainstream of the Miluo River, new built dikes in tributaries and mainstream, river cleansing, and restoration of shoals, etc. The project impact was reflected by the difference of inundation area between the without-project scenario and the with-project scenario, see (Figure 7).
Figure 7:Demonstration of cross sections with-/without project.

iv. Sediment issue: Though sediment plays important role in river course geometry by means of erosion, transportation and deposition, very little consideration was paid to sediment issue in this study for it is very slight in the Miluo River Basin, for this issue only plays some minor role in the upper reaches of the river basin.
v. The levels of hazard: The inundation area of 1% flood is regarded as the largest flooding area for risk analysis; the levels of hazard are defined as H·V2, representing the flood kinetic energy on unit flow area, in which, H is the water depth/m, and V the velocity of flow/m/s, with consideration on more information for structural measure design at proposed subproject sites. And the thresholds of Hazard value from high to medium, and to low, were determined as the mesh values of about two thirds, and one third.
Flood vulnerability analysis: Obviously, vulnerability assessment is not easy, and many tentative methods had been presented [10-12]. In this study, a simplified assumption was made that different types of land use were associated with the degrees of exposure’s vulnerability. As listed in Table 2, natural areas, such as natural channel or a waste land area, have low level vulnerability; agriculture and forestry, as well as local infrastructure, such as tillage, orchard, grassland, wooden farm, road, bridge, have medium level vulnerability; meanwhile, the vulnerability of national infrastructure, some special places (plant, mine, enterprise, power station, cultural heritage site) and residential land is at high level (Table 3).
Table 3:Land use categories and vulnerability level.

Model validation: The following assumptions were taken for rainfall-runoff simulation: (1) the heavy storms of all tributaries in the upper reach areas of Pingjiang city have same frequency, whose rainfall hyetograph is dominated by 24-hour design rainfall, and the hydrograph extends to 72 hours; (2) the effect of flood detention and peak-removal on tributary reservoirs and dammed ponds was considered in SCS parameters and lag time parameters in the distributed hydrological model; and (3) the parameter calibration was carried out based on the recorded flood data of Pingjiang Water Stage Station. According to the hydrologic records of Pingjiang Station with drainage area of 2,849km2 (Table 1), the peak discharges at is 3,190m3/s for 10% flood and 3,880m3/s for 5% flood, and the computed values are 3,202 for 10% flood, 4,179 for 5% flood, respectively, which provide relative errors of 0.4% and 7.7%, indicating the results are available for flood analysis.
Results and Discussions
According to the relevant requirements of project flood analysis on project benefit analysis, climate change and risk management, 12 scenarios were designed for flood simulation. Due to 10%, 5%, and 1% are the common flood control standards for rural town, county-level city, and flood risk analysis in China, 9 of the scenarios were as shown in Table 4. In (Table 4), scenarios A, B and C show the current conditions in the mainstream of the Miluo River inundated by 10%, 5%, and 1% flood events respectively; scenarios a, b, and c present the futural conditions (with-project, no climate change) in the mainstream of the Miluo River inundated by 10%, 5%, and 1% flood events respectively; while scenarios a’, b’, and c’ present the futural conditions (with-project and climate change) in the mainstream of the Miluo River inundated by 10%, 5%, and 1% flood events respectively.
Table 4:Flood simulation scenarios.

Project benefit and flood loss estimation
Project benefit and flood losses for each flood scenario had been evaluated. As mentioned previously, the main activities relating to flood control in the project mainly include river channel regulation for mainstream of the Miluo River, new built dikes in tributaries and mainstream, river cleansing, construction of one drainage pumping station, rehabilitation of two drainage pumping stations and one new-built, and restoration of shoals (sandbanks). In case of 10%, 5% flood events, the flood control standard for rural town and county city, respectively, the total inundated areas will decrease 26ha and 64ha with project and without CC, most of them are paddy, urban area, and town, as shown in Table 5, which demonstrates both the benefit of the project, and the total trend is that the flood control benefits are very obvious no more than standard-flood, but very slight for super-standard flood, such as, 2%, or 1% flood events.
Table 5:Flood loss estimation.

Risk level evaluation
Generally, hazard level at the meandering river channel and adjacent to riverbanks is high due to deep water depth and rapid flow velocity while it is mild or low at flood plain for shallow water depth and low flow velocity; vulnerability level is strongly relevant to landuse due to its definition, (Table 3). Figure 8 provides the demonstration of flood risk of 1% flood event, hazard level, and vulnerability of exposure and flood risk in the areas along the mainstream of the Miluo River, with emphasis on the county urban area. Figure 8(a) indicates that hazard level within the river channel in the county urban area is very high, and Figure 8(b) presents the distribution of vulnerability level in the country urban area, and Figure 8(c) shows that the areas along the Miluo River mainstream is in high-risk area while most of the paddy land closing to the river at both banks is in medium risk area; within the county city urban area, some of them neighboring to the both banks of the mainstream and tributaries are still in high level flood risk.
Figure 8:Flood risk assessment.

Residual risk
As mentioned previously, the flood prone area includes the urban area and the rural area. According to national requirements, the flood control standard for river embankment of is return period of 20 years for urban area and 20 years for rural area. The residual risk refers to the flood risk after the construction of the proposed subproject activities. The ratio of super-standard flood peak discharges to standard-flood peak discharge was performed without consideration on influence of climate change, and Figure 9 presents the results for the mainstream of the Miluo River and the tributaries in the urban area. Figure 9(a) indicates that, for most of subproject sites along the mainstream of the Miluo River, the peak discharge of 5% recurrence flood is about 1.3 times of that of 10% recurrence flood, the flood control standard for rural river sections; similarly, the peak discharges of 2% recurrence flood and 1% are roughly 1.7 and 2 times of that of for flood control standard. Similarly, Figure 9(b) shows that, for the tributaries in the urban area, the peak discharges of 2% recurrence flood and 1% recurrence flood are roughly 1.2 and 1.3 times of the peak discharge of flood control standard. Given that the mainstream of Miluo River flows through this area, the corresponding change ratio of peak discharges will be up to 1.7 to 2. Therefore, the water levels supperstandard of flood control will rise with different magnitudes at river sections depending on local river geomorphology. The difference of over-standard flood stage and standard flood stage was analyzed along the whole mainstream and the results was showed in Figure 10, which indicates that, the peak discharge stages of over-standard flood (5% recurrence, 2% recurrence and 1% recurrence) will be higher about 1 meter, 1-2.5 meters and 1-3.5 meters than that of standard-flood (10% recurrence). It is obvious in this figure that the difference is quite high from 75km to 135km, has the highest flood level difference, the reason is that the river flows through local narrow valley terrain with U- or V-shape. Therefore, the residual risk is considerably high in this river section. Therefore, preparation should be performed for extreme flood event from aspects of both structural measures and non-structural measures. Specially, a strong sluice gate was suggested at the outlet of lowlying area along the Miluo River, the upper of the county city, the most important protection object.
Figure 9:Ratio of super-standard peak discharge to standard peak discharge.

Figure 10:Water levels over standard of flood control.

Future risk
Many aspects, such as land use change, newly built infrastructure, population immigration, etc., will result in the change of exposure to flood and generate the future risk. The risk from climate change has been evaluated. Given the influence of climate change, water level will rise a little higher than that without climate change. Table 5 presents the difference of inundated areas, and Figure 11 shows the differences of water level with CC and without CC, which indicated the impact or risk of climate change in the future. Table 6 indicates that the inundated areas will increase 332ha, 567ha and 145ha for 10%, 5%, and 1% flood events, respectively; and Figure 11 indicates that the water surface elevation with CC will be a little higher than that without CC, generally, about 0.2-0.3meters for 10% flood, 0.3-0.4 meters for 5% flood, and 0.2 meters for 1% flood. Therefore, submerged areas will be slightly increased due to climate change which needs to be considered in future flood management. With acceleration of urbanization, cities/towns in the Miluo River Basin have been rapidly expanding. Based on a structural measure system with certain standard, more attention should be paid to nonstructural measures to implement flood risk management. For flood residual risk and future risk in the Muiluo River, measures, including eco-environmental improvement, should be performed at river basin scale, and integrated with other management objectives. For this option, enough attention should be paid to the relationships between upstream and downstream reaches, left and right banks, mainstream and tributaries; moreover, a powerful information system was proposed for monitoring rainstorm, flood stage at main tributaries and main channel, and the operating state of major structural facilities for flood management; furthermore, flood risk awareness should be embedded deeply into activities, such as land use planning, architectural planning.
Figure 11:Water level difference with- and without climate change.

Table 6:Impact of climate change.

Conclusion
The Miluo River, a typical flood prone area in Hunan province,
China, was taken as an example in this article to discuss flood risk
assessment and countermeasures at river basin scale. This article
discussed how to make an assessment on flood risk at river basin
scale. The main conclusions were drawn as follows.
a) A simplified and practical method, Hazard-Vulnerability
Overlay Analysis (HVOA), was used to perform flood risk
assessment at river basin scale. In this method, flood risk was
considered at river basin scale. The computed area for hazard
level assessment is the entire watershed and flash flood risk
area concentrated on communities of interest.
b) Analysis indicates that the proposed subproject activities, such
as construction of embankments, river dredging, provision of
culvert crossing, bank slope protection, will play crucial role
for floods no more than flood control standards, however, it
is important to manage residual risk and future risk, typically,
the risk of over-standard flood, climate change, and landuse
change due to rapid urbanization.
c) For Pingjiang county, the typical proposals in this article
include: a) a powerful information system is urgent and
important for real time monitoring and warning of rainstorm,
flood stage at crucial sites, and the operating state of major
structural facilities for flood management; b) flood risk
awareness should be embedded deeply into activities relating
to flood disaster mitigation, for instance, land use planning,
city/town planning, eco-environment improvement planning,
etc.; and c) overall planning for extreme flood event from both
structural measure and non-structural measure, specifically,
using reservoirs or wetlands to detain and store flood water
efficiently; and a sluice gate is suggested at the upper reach
low-lying area of Pingjiang city, to regulate extreme floods.
Acknowledgement
This article received financial support from National Key Research and Development Project “Key Technology Study and Demonstration on Warning for Rainstorm Triggered Flash Flood- Sediment Disaster” (No. 2019YFC1510700); and the authors would like to thank the ADB project (TA No. 53052-001, PRC) and the Pingjiang Department of Water Resources.
References
- Apel H, Aronica GT, Kreibich H, Thieken AH (2009) Flood risk analyses-how detailed do we need to be? Natural Hazards 49(1): 79-98.
- Erich JP (2002) Flood risk and flood management. J Hydrol 267: 2-11.
- Al Saud M (2015) Flood Control Management for the City and Surroundings of Jeddah. Saudi Arabia.
- Rebetez M, Lugon R, Baeriswyl PA (1997) Climatic change and debris flows in high mountain regions: The case study of the ritigraben torrent (Swiss Alps). Climatic Change 36(3-4): 371-389.
- Marco C, Laura C, Gabriele F, Stefano G, Giuseppe C (2016) Changes in the physical characteristics of the water column at the mouth of a torrent during an extreme rainfall event. Journal of Hydrology 541: 146-157.
- Azmeri, Hadihardaja IK, Vadiya R (2016) Identification of flash flood hazard zones in mountainous small watershed of Aceh Besar Regency, Aceh Province The Egyptian Journal of Remote Sensing and Space Science 19(1): 143-160.
- Zhang H, Li XY, Wang JP (2011) Emergency plan development and countermeasures for flash flood disaster management in Heilongjiang Province, China. China Flood and Drought Management 21(6): 53-55.
- Fuchs S, Kuhlicke C, Meyer V (2011) Editorial for the special issue: vulnerability to natural hazards-the challenge of integration. Natural Hazards 58(2): 609-619.
- Abdullah AB, Muktarun I, Supria P (2020) Flood Hazard, vulnerability and risk assessment for different land use classes using a flow model. Earth Systems and Environment 4(1): 225-244.
- Maria PK, Reinhold T, Margreth K, Thomas G (2012) A new vulnerability function for debris flow-The importance of physical vulnerability assessment in alpine areas. 12th Congress INTERPRAEVENT 2012 - Grenoble / France Conference Proceedings.
- Birkmann J, Cardona O D, Carreno ML, Barbat AH, Pelling M, et al. (2013) Framing vulnerability, risk, and societal responses: the MOVE framework. Natural hazards 67(2): 193-211.
- Totschnig R, Sedlacek W, Fuchs S (2011) A quantitative vulnerability function for fluvial sediment transport. Natural Hazards 58(2): 681-703.
- Hanye W, Shengzhi H, Wei F, Beibei H, Guoyong L, et al. (2020) Multivariable flood risk and its dynamics considering project reasonable service life in a changing environment. Journal of Hydrology 590: 125524.
- Asma H, Ashwin D, Anthony K, Huishu L, Kenneth C (2020) Flood risk assessment methodology for planning under climate change scenarios and the corresponding change in land cover. Journal of Water and Climate Change 11(4): 1370-1382.
- Mo Wang, Dongqing Z, Zhilin W, Shiqi Z, Soon KT (2021) Long-term performance of bioretention systems in storm runoff management under climate change and life-cycle condition. Sustainable Cities and Society 65: 102598.
- Hsiao SC, Chiang WS, Jang JH, Han LW, Wei SL (2021) Flood risk influenced by the compound effect of storm surge and rainfall under climate change for low-lying coastal areas. Science of the Total Environment 764: 144439.
- Feng B, Zhang Y, Robin B (2021) Urbanization impacts on flood risks based on urban growth data and coupled flood models. Natural Hazards. pp: 1-15.
- Nguyen HD, Fox D, Dang DK, Tuan LP, Quan VD, et al. (2021) Predicting future urban flood risk using land change and hydraulic modeling in a river watershed in the central province of Vietnam. Remote Sensing 3(2): 262.
- Zhang XN, Luo J, Chen L (2000) Zoning of Chinese flood hazard risk. Shuili Xuebao 3: 3-9.
- Zhao G, Pang B, Xu ZX (2016) Assessment on the hazard of flash flood disasters in China. Shuili Xuebao 47(9): 1133-1142.
- Yenan W, Ping Z, Zhang Y, Bin X, Biao M, et al. (2015) Integrated flood risk assessment and zonation method: a case study in Huaihe river basin, Natural Hazards 78(1): 635-651.
- Ren HY, Du J, Ding WF (2018) Risk assessment of mountain torrent disaster based on GIS in China. Journal of Catastrophology 33(4): 86-92.
- Guihua L, Zhong L, Zhiyong W, He Hai (2014) Zoning of mountain torrentent hazards in medium-small river basins. Earth Science-Journal of China University of Geosciences 39 (10): 1539-1544.
- Changzhi L, Dongya S, Liang G, Hong W, Xiaolei Z, et al. (2018) Flash flood risk assessment based on FFIA in China. Proceedings of the International Workshop on Environment and Geoscience, pp: 566-575.
- Wieczork GF (1984) Evaluating danger landslide catalogue map. Bulletin of the Association of Engineering Geologists 1(1): 337-342.
- Ellen SD, Wieczorek GF (1988) Landslides, floods, and marine effects of the storm. San Francisco Bay region, California, US.
- Jiang ZH, Zhang YZ, Cai Z (20147) Embedded River grid-based flash flood disaster flooding simulation. Meteorological Monthly 40(8): 1013-1018.
- US Army Corps of Engineers, HEC-HMS (2000) Technical Reference Manual. Hydraulic Engineering Centre, US.
- US Army Corps of Engineers, HEC-RAS (2020) Hydraulic Reference Manual, US.
- Hunan Depart of Water Resources (2015) Hunan Rainstorm-Runoff Computation Manual.
- MWR, PRC (2017) Guideline for flood risk mapping.
© 2022 Changzhi Li. This is an open access article distributed under the terms of the Creative Commons Attribution License , which permits unrestricted use, distribution, and build upon your work non-commercially.
Editor In Chief


.jpg)


Signup for Newsletter

Quick Links
 Editorial Board Registrations
 Submit your Article
 Refer a Friend
 Advertise With Us
Our Recent Edition

.jpg)


Top Editors


.jpg)


.bmp)
.jpg)
.png)
.jpg)


.jpg)


.png)

.png)


.png)


Financial Support

Sponsors

Latest e-Books

Latest Video

 a Creative Commons Attribution 4.0 International License. Based on a work at www.crimsonpublishers.com.
Best viewed in
a Creative Commons Attribution 4.0 International License. Based on a work at www.crimsonpublishers.com.
Best viewed in