- Submissions

Full Text
Academic Journal of Engineering Studies
Village-Oriented Flash Flood Risk Assessment and Application: Case Study of Xiaoji Village, Henan, China
Changzhi Li1*, Xiaolei Zhang1, Zhang Miao1, Li Hui1 and Hongxun Xue2
1China Institute of Water Resources and Hydropower Research, No.1 Yuyuantan Road, Haidian District, Beijing, China, 100048
2Department of Water Resources, No.10 Weiwu Road, Jinshui District, Zhengzhou, Henan province, China, 410106
*Corresponding author: Changzhi Li, China Institute of Water Resources and Hydropower Research, No.1 Yuyuantan Road, Haidian District, Beijing, China, 100048
Submission: May 17, 2022; Published: May 27, 2022
.jpg)
ISSN:2694-4421 Volume2 Issue5
Abstract
Risk management is one of the important options for flood disaster mitigation. Xiaoji village, a high flash flood prone area in Xixia county, Hehan Province, China, was taken as an example to perform analysis on flash flood risk assessment and application to at village level. This article first introduced the general approach, Hazard-Vulnerability Overlay Analysis (HVOA), for rapid flash flood risk assessment, then presented detail information on model construction and analysis on hazard of flash flood, exposures to hazards, and vulnerability assessment; finally, presented the application of these outputs in Xiaoji village. The main conclusions are as follows: (1) HVOA is a simplified and practical method to perform rapid flash flood risk assessment at village level, (2) hazard assessment at river basin scale is significant, though risk evaluation was performed for a local area, (3) risk assessments have potential in the fields of village’s early warning, emergency response planning, landuse and structural measure planning, and risk awareness enhancement.
Keywords:Village-oriented; Flash flood; Risk; Assessment; Application
Introduction
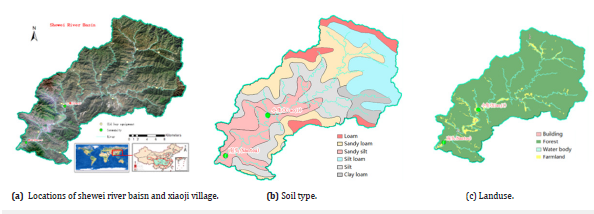
Flash floods are commonly highlighted by deep, fast flowing water which - combined with the short time available to respond - increases the risk to local people and property [1]. Hence, many studies concentrated on rainfall depth threshold for early warning for flash flood to mitigate disaster [2-7]. However, due to the impacts of flash flood are usually confined to a small area with very limited exposures to them, non-structural measures are currently one of the main options; moreover, the leading time available is very limited even if rainfall depth thresholds are accurately estimated and work well in early warning system. Risk management is one of the powerful options for flash flood. And the concept of flood risk was traditionally defined as the product of probability and consequences of flooding, but currently, more and more studies have preferred to regard it as the comprehensive effect of hazard, exposure, and vulnerability. Hazard assessment is significant for risk evaluation, many studies performed analysis on the factors leading to flash flood, such as rainfall, hydrological feature, geology, landform, landcover, soil type [8] and/or the mechanism among the factors [9], or the significance of each factor triggering flash flood [10,11]. Similarly, exposures to hazard are also of significance, many studies are mainly concentrated on lives loss [12,13], but increasingly on stationary or movable objects [14]. Vulnerability is commonly regarded as the susceptivity and resistance of exposures to hazard [15] and was increasingly studied with different methods, such as matrix method [16], index method [17] and curve method [18]. Commonly, AHP (Analytic Hierarchy Process) is used for risk assessment, in which serval even many indexes indicating risk need to be developed with high uncertainty. At the same time, risk assessment can be grid-based or watershed-based. Most of existing studies were made grid-based [19-25] and minor of them were watershed-based [26-28]. As powerful technical tools, GIS and RS technologies have been widely used not only to perform grid-based hazard assessment and flash flood hazard mapping [2,21,24,29,30], but to extract and refine hydrologic, hydrodynamic information for flash flood [24,31]. Emphases of most existing studies were put on risk assessment for a large region at a very large scale, which is limited to indicate rainfall-runoff characteristics in a drainage area. However, how detailed do we need to perform flash flood risk analysis? [32] Plate E.J. proposed that flood risk and flood management was classified as three levels of operational level, project planning level and project design level [33]. Obviously, different level means different information requirements. For flash floods, time between rainfall and flood peak appears is very short and the available leading time is very, very limited. However, many actions need to be done in such limited time, for instance, early warning, emergency launch, evacuation to shelters. Xiaoji village, a typical flash flood prone area in the Shewei River Basin, Henan province, China (Figure 1), was taken as an example in this study to improve village-oriented flash flood risk assessment and application with the following objectives: (1) find an approach to perform rapid risk assessment for flash flood prone villages; (2) conduct flash flood risk analysis and demonstrate risk for selected village; and (3) application of flash flood risk to enhance village’s capability at entire river basin level.
Figure 1: asic information of shewei river basin.
Data and Methods
Demonstrative village
Shewei River is one third level tributary of the Yangtze River, with drainage area of 535km2, main channel length of 42km. The soil types include loam, sandy loam, sandy silt, silt loam, silt and clay loam, while the land cover consists mainly of forests, farmlands, roads, buildings and water bodies. Annual mean precipitation reaches 846.4mm with maximum value of 2,224.1mm and rainy season from June to September. This river basin is a considerable flash flood prone area due to heavy rainfall and steep terrain. Moreover, the river channel in the upstream area of the basin often keeps no water flow, and local people are easy to ignore flash flood disaster, so, this river basin is a heavy flash flood prone area, referring to Figure 1. The Xiaoji village, located in the middle reach area of this basin, frequently attacked by flash floods, and was selected as the pilot village which has a drainage area of 410.43km2 and sub-villages of Jiuguan, Beilou, Youfang, Laojun, and Matiwan, total population of 322 and households of 72, Figure 2. Along the floodplains of the Shewei River is the very limited farmlands of this village, most of them are greenhouses for mushroom planting-the mainstay industry of local economy.
Figure 2: Basic information of xiaoji village.

Flash flood risk assessment approach
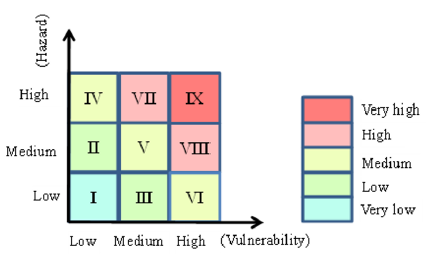
Flash flood risk is defined as the overlaying effects of Hazard, Exposure and Vulnerability in this study. Exposure refers to lives and properties threatened by flash flood; Hazard means magnitude of flash flood reflected as flooding area, water depth, flow velocity, flooding duration, peak discharge and flood routine; Vulnerability is one attribute of Exposure, reflecting susceptibility of Exposures to flash flood hazard. Exposures are those lives and properties exposed to flash flood hazard, including stationary objects (typically, buildings, roads, farmlands, etc.) and movable objects (commonly, people, automobiles, etc.). Hence, flash flood risk will be decided by hazard and vulnerability for stationary exposures; for movable exposures, it is important to keep them away from hazard and mitigate their vulnerability. Figure 3 presents the procedure of flash flood risk analysis for stationary exposures in this study, in which there are 6 steps. Step 1, data collection and process for the watershed feature, such as drainage area, river channel length, slope, and roughness coefficient; Step 2, perform hazard analysis based on watershed features and returned periods of flood; Step 3, conduct hazard assessment; Step 4, paralleling to step 3, is to make assessment on Exposure and Vulnerability using land use information in the watershed; Step 5, perform flash flood risk assessment with outputs from hazard analysis, Exposure- Vulnerability analysis; and Step 6, the last step, is to use the outputs for village-oriented flash flood disaster mitigation. For simplicity and practicality, a method named Hazard-Vulnerability Overlay Analysis (HVOA) was used to perform flash flood risk analysis for stationary exposures. In this method, flood risk (R) is quantified as a function of the hazard level and vulnerability level. Both hazard and vulnerability are classified with three levels (high, medium, and low) as demonstrated in Figure 4, in which there are 9 blocks marked with Roman letters, and different colors of the blocks in hazard-vulnerability plane represent different risk levels.
Figure 3: village-oriented schematics for flash flood risk analysis and application.

Figure 4: HVOA risk assessment.
Flash flood risk assessment
In this study, hazard analysis was conducted by hydrological and hydraulic analysis; and Exposure and Vulnerability assessment by spatial analysis function of Geographic Information System (GIS), and flood risk assessment by HVOA method.
Flash flood hazard analysis: Based on the meteorological, basin model and terrain model, hydro-hydrodynamic modeling for flash flood was performed by HEC-HMS [34] and HEC-RAS [35]. The outputs of HEC-HMS are the rainfall-runoff for each subbasin, runoff hydrograph at each junction and river reach. Then, a hydrodynamic modeling was performed using HEC-RAS to get flash flood information, such as inundation area, inundation depth, flow velocity, etc. Two-dimensional full Saint Venant Equations were used to perform flash flood simulation and the outputs of rainfallrunoff were set as the boundary conditions for hydrodynamic modeling. The meteorological model, basin model and terrain model are described as follow.
a) Meteorological model
In the meteorological model, the rainfall data was deduced from the Henan Storm-runoff Analysis Guidance [36], a technical document providing a complete and operable method for design rainfall-runoff suitable for Henan province, China. In this document, rainfall depth can be subclassified as point rainfall, areal rainfall and hyetograph. Based on the depth of area rainfall, the hyetographs for various rainfall duration are presented by the Henan Storm-runoff Analysis Guidance and Figure 5 provides the results of hyetograph.
Figure 5:Hyetograph for shewei river basin.

b) Basin model
The basin model was first developed based Digital Elevation Model (DEM) data of 30-meter spatial solution, then refined based remote sensing image of 2.5 meter resolution and data of field survey. The river cross sections were extended to the roads and villages on both banks to cover extent of possible inundation. The data used for basin model development are presented in Figure 6. According to the river networks and its 3 specific spatial location of interest, the watershed is divided into 8 sub-basins, 4 river reaches, and 6 junction points. The sketch of the basin model is illustrated in Figure 7. In this basin model, Xiaoji village is at Junction 2 Junction 1 (Erlangping) is the conjunction with drainage area of 326.23 km2, where three largest subbasins come together in the upper reach of the river basin, to which significant attention should be paid for flash flood disaster management at river basin scale. And Junction 6 is the location of Nantou village, which need the early warning from both Erlangping and Xiaoji.
Figure 6:Data for basin model development.
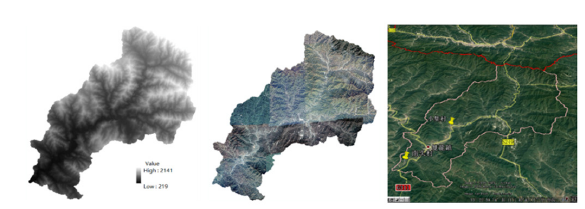
Figure 7:Basin model for the shewei river basin.

c) Terrain model
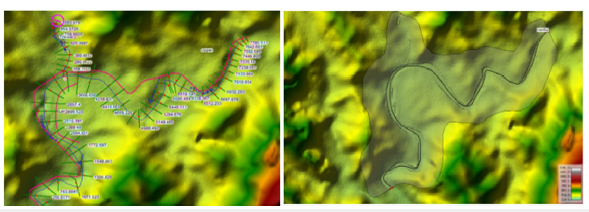
The terrain model of cross section covering river channel and flood plain was first developed in consideration of inadequate resolution for hydrodynamic computation of DEM data of 30 meter solution. The river cross sections were extended to the roads and villages on both banks to cover extent of possible inundation. Over 56 river cross sections were extracted and refined based on measured data, remote sensing image of 2.5 meter resolution, and site investigations, see Figure 6. Then, a composite terrain model in this hydrodynamic model was developed by combining the crosssection model with DEM data, see Figure 8.
Figure 8:Terrain model for flash flood modeling at xiaoji.
d) Basic methods on flash flood modeling
The methods used for hydrological model were as follows: SCS curve number method was used to compute the loss before the start of surface runoff; SCS unit hydrograph transform method to estimate surface runoff; and flood flow was routed through river reaches with the kinematic-wave method for the considerable slope of channel. As for dynamic model, the two-dimensional full Saint Venant Equations were used to perform flash flood simulation and the outputs of rainfall-runoff were set as the boundaries for hydrodynamic modeling.
e) Other consideration
1) Hazard for movable exposures. As mentioned previously, due to
the mobility of movable exposures, the hazard was mainly regarded
as the destructive forces or energy of water flow while that was the
inundation areas for stationary exposures.
2) Flood returned period. According to the relevant requirements
of project flood analysis on risk evaluation, and emergency response
management, 5 typical returned periods (5-, 10-, 20-, 50-, and 100-
year events) of rainfall-runoff were set for flood simulation [37].
3) Sediment. Though sediment plays some role in river course
geometry through erosion, transportation and deposition, very
little consideration was paid to sediment issue for it is very slight
in this basin.
of hazard were mainly classified by the return
periods of flash flood that have different inundation areas (Table
1).
Table 1: Inundation area and hazard level.

Flash flood exposure analysis: As mentioned previously,
exposures to flash flood are typically classified as the stationary and
the movable. Commonly, various landuse types, such as buildings,
farmlands, roads, facilities, belong to the stationary exposure and
the objects can move, typically, persons, vehicles, boats, and so
on, belong to the movable exposures. According to the analysis
of the data of flash flood disaster over the years, people who are
vulnerable to flash flood often have involved in the following typical
situations [14].
a) Houses built by cutting slope without or very fragile
protection measures, or at headcut or the foot of steep hillside; or
on hilly land with deep elurium and talus accumulation, or hilly
land easily collapsing and sliding with cracked mountain body
b) Houses built at low sites on both banks of a stream, or
conjunction of several rivers, or the bend and convex bank of river
channel;
c) High-density buildings are built in open space closing to
bridges, without consideration of gravels, boulders, grasses and
woods from upper reach area, which is pretty easy to be blocked
or detained through bridges or culverts, and triggering local
flooding;
d) People who do not know information about outbreak of
flash flood, or cannot recognize the intensity of rainstorm, and
move on along steep slopes or on both sides of streams and rivers
in the area where flash flood is likely to reach, or take sleep at
night without any preparation for rainstorm event;
e) People who, during flash flood, at their own arbitrary
wills, go across rivers, bridges, and ferries with purpose of timesaving;
or get floating properties (such as woods, furniture, etc.)
in the river standing by river banks, or even by temporary bamboo
raft, wooden raft, bucket, and boat in the river channel.
Obviously, case (a)~(c) are the stationary exposures while case
(d) and (e) are the movable exposures. Commonly, inundating
or not is the most significant for stationary exposures while for
movable exposures, it is the power and energy of water flow.
Flash flood vulnerability analysis: Obviously, vulnerability assessment is not easy and many tentative methods had been presented [16-18]. In this study, a simplified assumption was made that different types of land use were associated with the degrees of exposure’s vulnerability. As listed in Table 2, natural areas, such as natural channel or a raw area, have low level vulnerability; agriculture and forestry, as well as local infrastructure, such as tillage, orchard, grassland, wooden farm, road, bridge, have medium level vulnerability; meanwhile, the vulnerability of national infrastructure, some special places (plant, mine, enterprise, power station, cultural heritage site, ...) and residential land is at high level.
Table 2: Landuse categories and vulnerability level.

Results and Discussion
Leading time
Leading time is one of the most important information for movable exposures to take appropriate measures. Commonly, leading time deduced by water-stage is much shorter, but more reliable than that by rainfall depth threshold. As mentioned above, rainfall-runoff analysis was performed using hydrological model for 5-, 10-, 20-, 50-, and 100-year flood events. Figures 3-10 presents the 5-year flood hydrographs at Junction 1 (Water-stage gauge), Junction 2 (Xiaoji village), which demonstrates the lag time of peak discharge from Erlangping to Xiaoji is about 0.5 hours. And Table 3 presents more details of leading time evaluation from the water-stage gauge (Junction 1) to the Xiaoji village (Junction 2) that means the leading time is about 0.6 hours by water-stage early warning. Therefore, the water-stage warning leading time was estimated as half an hour for Xiaoji village at least.
Figure 9:5-year-flood hydrographs at erlangping, xiaoji.
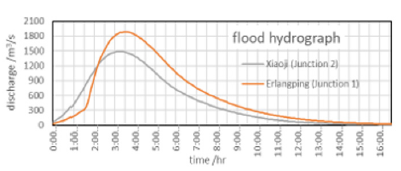
Table 3:Evaluation on leading time by water-stage warning.

Flood hazard
Figure 10:Hazard information of flood.
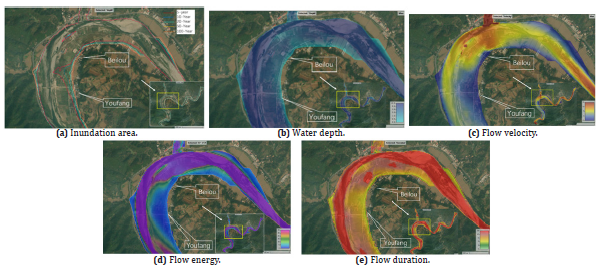
Hazard is generally described by typical hydraulic properties of flash flood, such as the flooding area, water depth, flow speed, peak discharge, and flood duration. Figure 10 present the key features of flash flood hazard at Xiaoji village, more detail for Beilou and Youfeng sub-villages. Figure 10(a) presents the inundation areas for Beilou and Youfang sub-villages, which indicates that for 20% flood event, some farmlands on the left bank will be inundated but no houses or greenhouses; for 5% flood event, not only farmlands, roads, mushroom greenhouses, but also some buildings will be flooded. Besides inundation scope, other hydraulic properties, are also significant for flash flood risk management, especially for movable exposures, typically, flood depth, flow velocity, flow energy, and flow duration, which are presented in Figure 10 for 1% flood event. The water depth reaches over 5 meters in the river channel, over 1 meter on both floodplains, and near 0.5m for part of the Beiou and Youfang sub-villages (Figure 10(b)). The high flow velocity areas locate at the entrance, the conjunction adjacent area, and the outlet areas where fluvial geomorphology take great changes. The flow velocities at the floodplain near Beilou sub-village are very high (Figure 10(c)). High flow energy (H*V^2) areas locate in the main river course and floodplain near Beilou sub-village (Figure 10(d)). Similarly, the flow durations in river course and low-lying areas of floodplain, are very long, commonly over 12 hours; near and within the villages, are every short, usually less than three hours, even one hour; for other areas, are within 3 to 12 hours (Figure 10(e)). Figure 11 demonstrates the hazard level at the village according to “Table 1: Inundation area and corresponding hazard level”. From these figures, one can see that the selected village cover part of the high hazard level area, and the flood depth and flow velocity are considerably high.
Figure 11:Hazard level of flood

Exposures to flash flood
According to local specific conditions, stationary exposures include farmlands, roads, houses, forests, greenhouses for mushroom planting in the floodplain, some fishery facilities and water conservancy facilities in the river channel or along the banks, and the movable exposures include local people, all kinds of vehicles, see Figure 2.
Vulnerability of exposures
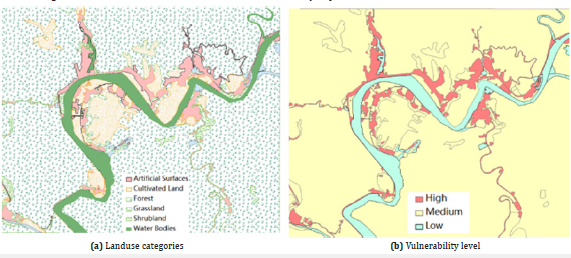
Figure 12 presents the landuse type and vulnerability level for Xiaoji village accord to “Table 2: Landuse categories and corresponding vulnerability level”. Here, it is quite apparent that the villages near river channel have high level of vulnerability, which indicates that early warning should reach the residents as early as possible.
Figure 12:Hazard level of flood
Flash flood risk
Based on above analysis on hazard, exposure and vulnerability, the flash flood risk in Xiaoji village is demonstrated in Figure 13, which indicates some of houses, farmlands, roads locate in areas of very high, high level of flash flood risk.
Figure 13:Flash flood risk level

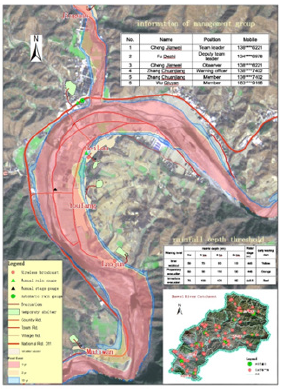
Figure 14:Measures to avoid risk at river basin scale
Applications
The information from the flash flood risk assessment can contribute much to the main activities of flash flood management, typically, early warning, proper emergency response, reasonable landuse and structural measures planning, and high flood risk awareness, etc.
Emergency response planning
All of the information on leading time, possible exposures, and hazard aspects of flash flood, such as inundation area, flow velocity, flow energy, flood duration, have been analyzed to prepare riskavoidance measures in emergency plan, typically, selection of evacuation paths and temporary shelters. All outputs in this study have been enreached into the local emergency response plan–both in advance planning and during response to emergencies, as the guidance for emergency response drill which help the movable exposures keep away from hazard correctly and timely.
Flash flood early warning system planning and improvement
preliminary flash flood monitoring and warning system has been established in the Shewei River Basin by a nationwide project from 2009 to 2016 [38] and this study has presented proposals for newly installation and deployment of monitoring and warning devices at river basin scale. Briefly, propose have been made that one water-stage and one rainfall monitoring at Erlangping, and two rain gauges in the upper reach areas.
Landuse and structural measure planning
Most farmlands within the floodplain are used to build greenhouse for mushroom planting, and some of them belong to areas of high flow velocity, high flow energy and long flood duration (Figure 10). So, some advices have been proposed that the flood plain should be used in a limited way and some structural measures, typically cofferdams combining with paths/roads, strong enough materials for greenhouse, be prepared to protect the greenhouses.
Flood risk awareness enhancement
The outputs have been used to raise awareness of flood risk by the following ways: 1) Publicity by bulletin board: the information on flash flood exposures and measures to avoid risk at river basin scale has been presented in the bulletin board for local people, representatively, Figure 2,14; 2) Drill: annual drill for flash flood emergency response are to be hold before flood season each year according to local emergency plan, which adopts all of the outputs on risk information; and 3) relevant plans development. It is mandatory to take flash flood risk into consideration when other plans are developed, chiefly, landuse planning, transport planning, which are closely related to flood management.
Conclusion
Taking Xiaoji as an example, this study discussed how to make an
assessment on flash flood risk and use the outputs to enhance flash
flood capacity for village at river basin scale. The main conclusions
were drawn as follows:
a. A simplified and practical method, Hazard-Vulnerability
Overlay Analysis (HVOA), was used to perform flash flood risk
assessment at village scale. Moreover, a simplification was further
made that exposures to flash flood are classified as the stationary
and the movable, and flash flood risk is determined only by hazard
level and vulnerability level for stationary exposures.
b. Consideration at river basin scale is significant to flash
flood risk assessment to village of interesting. The computed
area for hazard level assessment should be the entire watershed
while the focus of flash flood risk analysis was on communities
of interest, only small part of the watershed. In this study, hazard
analysis at Xiaoji village was conducted by hydrological modeling
at the entire Shewei River Basin scale. In addition to this, more
information can be obtained, such as more leading time of early
warning by rainfall or flood water stage in upper reaches of village
of interest, which is quite helpful for those movable exposures to
run away from dangerous areas.
c. Analysis indicates that the stationary exposures in areas
of high flood risk include the farmlands, roads, houses, forests,
the greenhouses for mushroom planting of Beidou and Youfang
sub-villages in the floodplain, some fishery facilities and water
conservancy facilities in the river channel or along the banks,
especially for. Besides this, the movable exposures were also
considered. The outputs have been enriched into existing
emergency planning, flash flood monitoring and early warning
system planning, landuse and structural measures planning and
flood risk awareness enhancement at Xiaoji village, all of these
will greatly enhance the capacity of flash flood management at
village scale.
Conclusion
This article received financial support from National Key Research and Development Project “Key Technology Study and Demonstration on Warning for Rainstorm Triggered Flash Flood- Sediment Disaster” (No. 2019YFC1510700) and ADB Project “Piloting Innovative Flash Flood Early Warning System in Selected River Basins” (No. TA 9566-PRC).
References
- Kevin Sene (2013) Flash flood predicating and warning. Springer Dordrecht Heidelberg, UK, P. 394.
- Carpentera TM, Sperfslagea JA, Georgakakosa KP, Sweeney T, Fread DL (1999) National threshold runoff estimation utilizing GIS in support of operational flash flood warning systems. Journal of Hydrology 224(1-2): 21-44.
- Chen GY, Yuan YM (2005) Research on critical precipitation amount computation method of mountain torrential flood disaster. Yangtze River 36(12): 40-43.
- Georgakakos KP (2006) Analytical results for operational flash flood guidance. Journal of Hydrology 317(1-2): 81-103.
- Liu ZY, Yang DW, Hu JW (2010) Dynamic critical rainfall-based torrential flood early warning for medium-small rivers. Journal of Beijing Normal University (Natural Science), pp: 317-321.
- Shi Z, Chen HB (2017) Application of distributed hydrological model in determination of mountain torrent warning index. Water Resources and Power 35(2): 79-81.
- Ji ZH, Wu XH (2018) A Review about the Risk Assessment of Torrential Flood Disaster. Journal of Catastrophology 33(1): 162-167.
- Al Saud M (2015) Flood control management for the city and surroundings of jeddah, Saudi Arabia (Springer Natural Hazards). 2015th edn, Springer Publishers, Saudi Arabia.
- Rebetez M, Lugon R, Baeriswyl PA (1997) Climatic change and debris flows in high mountain regions: The case study of the Ritigraben torrent ( Swiss Alps). Climatic change 36: 371-389.
- Capello M, Cutroneo L, Ferretti G (2016) Changes in the physical characteristics of the water column at the mouth of a torrent during an extreme rainfall event. Journal of Hydrology 541: 146-157.
- Azmeri, Hadihardaja IK,Vadiya R (2016) Identification of flash flood hazard zones in mountainous small watershed of Aceh Besar Regency, Aceh Province, Indonesia. The Egyptian Journal of Remote Sensing and Space Science 19(1): 143-160.
- Hu WZ, Ding WZ, Zeng F (2011) Developing emergency plan scientifically and managing flash flood disaster efficiently. Yangtze River 37(9): 43-44.
- Zhang ZT (2016) Mountain torrent disaster prevention and control measures and their effects. Water Resources and Hydropower Engineering 47(1): 1-5.
- Zhang H, Li XY, Wang JP (2011) Emergency plan development and countermeasures for flash flood disaster management in heilongjiang province, China. China flood and drought management 21(6): 53-55.
- Fuchs S, Kuhlicke C, Meyer V (2011) Editorial for the special issue: vulnerability to natural hazards-the challenge of integration. Natural Hazards 58(2): 609-619.
- Papathoma Khle M,Totschnig R,Keiler M, Thomas G (2012) A new vulnerability function for debris flow-The importance of physical vulnerability assessment in alpine areas. 12th Congress Inter Praevent, pp: 1033-1043.
- Birkmann J, Cardona OD, Carreno ML, Barbat AH, Pelling M, et al. (2013) Framing vulnerability, risk and societal responses: the MOVE framework. Natural Hazards 67(2): 193-211.
- Totschnig R, Sedlacek W, Fuchs S (2011) A quantitative vulnerability function for fluvial sediment transport. Natural Hazards 58(2): 681-703.
- Zhao S.P (1996) An elementary study on whole characteristics of mountain torrents disaster system in China and its hazard regionalization. Journal of Natural Disasters (3): 95-101.
- Zhang XN, Luo J, Chen L (2000) Zoning of Chinese flood hazard risk. Shuili Xuebao (3): 3-9.
- Tang C, Zhu J (2005) A GIS based regional torrent risk zonation. Acta Geographica Sinica 60(1): 87-94.
- Zhao G, Pang B, Xu ZX (2016) Assessment on the hazard of flash flood disasters in China. Shuili Xuebao 47(9): 1133-1142.
- Wu Y, Zhong P, Zhang Y, Bin X, Biao M, et al. (2015) Integrated flood risk assessment and zonation method: a case study in Huaihe River basin, China. Natural Hazards 78(1): 635-651.
- Du J, Ren HY,Zhang PC (2016) Comparative study of the hazard assessment of mountain torrent disasters in macro scale. Journal of Catastrophology 31(3): 66-72.
- Ren HY, Du J, Ding WF (2018) Risk assessment of mountain torrent disaster based on GIS in China. Journal of Catastrophology 33(4): 86.
- Lu GH, Zhong L, Wu ZY, Hai H (2014) Zoning of mountain torrentent hazards in medium-small river basins. Earth Science 39(10): 1438-1444.
- Changzhi Li, Dongya Sun, Liang Guo, Hong W, Zhang X, et al. (2018) Flash flood risk assessment based on FFIA in China. Proceedings of The International Workshop on Environment and Geoscience, Pp. 566-575.
- Wieczork GF (1984) Evaluating danger landslide catalogue map. Bulletin of the Association of Engineering Geologists 1(1): 337-342.
- Ellen SD,Wieczorek GF (1988) Landslides, floods and marine effects of the storm of January 3-5, 1982 in the San Francisco Bay region, California. Geological Survey, USA, P. 311.
- Gomaa M Dawod, Meraj N Mirza, Khalid A Al-Ghamdi (2011) GIS-Based spatial mapping of flash flood hazard in Makkah City, Saudi Arabia. Journal of Geographic Information System 3(3): 225-231.
- Jiang ZH, Zhang YZ, Cai Z (2014). Embedded river grid-based flash flood disaster flooding simulation. Meteorological Monthly 40(8): 1013-1018.
- Apel H, Aronica GT, Kreibich H, Thieken AH (2009) Flood risk analyses-how detailed do we need to be? Natural Hazards 49(1): 79-98.
- Erich J Plate (2002) Flood risk and flood management. J Hydrol 267(1-2): 2-11.
- (2008) US Army Corps of Engineers 2000. HEC-HMS, technical reference manual. Hydraulic Engineering Centre CPD-74B
- (2020) US Army Corps of Engineers 2020. HEC-RAS, hydraulic reference manual. Hydraulic Engineering Centre CPD-69.
- (1984) Henan water conservancy reconnaissance & design, institute. The henan storm-runoff analysis guidance(S).
- (2017) MWR, PRC. Guideline for flood risk mapping. SL 483.
- Sun DY (2020) Thoughts on the construction of national flash flood disasters prevention and control projects in the new era. China Flood & Drought Management 30(9-10): 18-21.
© 2022 Changzhi L2. This is an open access article distributed under the terms of the Creative Commons Attribution License , which permits unrestricted use, distribution, and build upon your work non-commercially.
 a Creative Commons Attribution 4.0 International License. Based on a work at www.crimsonpublishers.com.
Best viewed in


.jpg)


 Editorial Board Registrations
 Submit your Article
 Refer a Friend
 Advertise With Us
.jpg)


.jpg)


.bmp)
.jpg)
.png)
.jpg)


.jpg)


.png)

.png)


.png)


