
- About Us
- Information
-

The Author ensures that the research has been conducted responsibly and ethically with adherence to all relevant regulations. read more..
- For Authors
- For Reviewer
- Manuscript Guidelines
- Membership
- Publication Ethics
-
- Journals
- Reprints
- e-Books
- Videos
- Policies
- Contact Us
 COVID-19
- Submissions


Full Text
Academic Journal of Engineering Studies
Shaft Crack Damage Fault Detection Using Induction Machine Electrical Signature Analysis
Ratni Azeddine1* and Benazzouz Djamel2
1Faculty of Engineering Sciences, Algeria
2Department of Industrial Maintenance, Algeria
*Corresponding author: Ratni Azeddine, Faculty of Engineering Sciences, Algeria
Submission: July 9, 2020 Published: August 15, 2021
.jpg)
ISSN:2694-4421 Volume2 Issue1
Abstract
Cracks in shafts have long been identified as factor limiting the safe and reliable operation of gearbox, they sometimes result in disastrous failure of equipment (tooth,.) and, more often, in costly process, upsets, repairs and replacement of equipment. This paper represents the utilization of dynamic model of a simple stage gearbox (with and without defects) and the Hilbert Transform Demodulation in the early detection and condition monitoring of shaft crack fault. Then, the vibration signal is analyzed using the proposed approach. The used approach is compatible for such diagnosis and gives valuable information about crack effects defect presence. The obtained results of early detection of shaft crack fault using the instantaneous phase are represented in this paper.
Keywords: Gearbox systems; Fault detection; Shaft crack; Signal processing; Instantaneous phase
Introduction
Gear systems enable us to shift the motor power movement towards the receptor in order
to augment the couple of the motor. Regarding the complexity of these systems. Gear shafts
failed due to cracks can be catastrophic with large costs in down time, damage to equipment
and injury to personnel. Prevention of such problems is only attained by developing reliable
methods for crack detection and diagnosis. Many monitoring machine methods can be found
in the literature such as the vibration analysis [1-3]. this method gives qualitative information
on the forces developed in the machine organs. Most of the methods have been used in
confidence with time and frequency analysis to detect defects [4-6]. Signal demodulation
techniques [7,8], and cepstral analysis [9]. However, they do not provide enough information
about the nature of the faults and different conditions of the system to be monitored. The
reason for using Fourier Transform to analyze signals is that the rotating machine vibration
signals are harmonic in fact. This approach of signal is not suited for all types of signals
especially for non-stationary signals, the temporal evolution of the spectral content of the
signal is not able to be described by the temporal or frequency alone, this pushes us to use
Hilbert Transform approach to get better description of the signal.
The sections of this article are organized as follows:
Section II presents a general look at Hilbert’s transformation.
Section III will present the principles of numerical modeling of a one stage speed reducer
in normal state, then taking into account shaft faut. then the section IV presents the results of
the simulation obtained by modeling. Section V will present the theoretical spectrum of a shaft
fault for the different gravity of the fault and we will conclude this work with a conclusion and
perspectives [10].
Hilbert Transform Demodulation
In signal theory, the Hilbert transform (noted H) of a real variable function s(t), is obtained by the convolution of the signal s(t) with 1/π t, which gives h(t). In addition, the Hilbert transform can be interpreted as the output of an invariant linear system with an input s(t), which is an impulse response system 1/π t. It is a mathematical tool widely used in signal theory to describe the complex envelope of a real quantity modulated by a signal. This transformation allows us to form a new complex signal [11].
z(t) = s(t)+jh(t)→(1)
When:
h(t) = H(s(t))→(2)
Based on this equation, we can deduce two functions: The first function is called amplitude modulation given by:
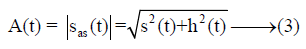
The second function is called phase modulation given by:
When:
Dynamic Model
In this part we consider a right gear speed reducer. The model becomes complex with a Large number of Degrees of Freedom (DDL). In our model, we applied a system with six degrees of freedom as described in Figure 1, in order to focus the study on the vibratory response on the latter . The dynamic behavior of the rigid gear carrier and the contribution of the carrier are also considered. Thus, this simplified model that will be adjusted with the calculation of the vibratory response.
Figure 1: Dynamic model.

θm: the motor is rotational angle. θ1and θ2: are the pinion and the wheel rotational angles, respectively. θr: Is the load rotational angle. y1 and y2: are the radial displacement of the flexible shafts.
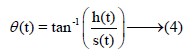
Motion equations
Based on the considered electromechanical model, the motion of equations is found and given as follows:
Shaft crack faults modeling
When the shaft rotates the cracked portion periodically passes from taut areas (when it is down) to compressed zones (when it is at the top) therefore it opens and closes periodically: it is said to Respiration. Figure 2 represents this phenomenon. The function of the shaft stiffness Ks(t) can be expressed in Fourier series up to order N as follows:
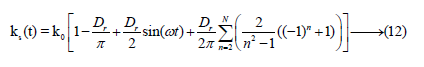
The Dr Value represents the severity of the defect (depth and width of the crack, degree of dissymmetry). If Dr = 0N/m the system is said to be healthy and if Dr ≠ 0N/m the rotating stiffness will be decreased so the system is said to be defective. Figure 3 gives the function of the observed stiffness Ks(t) during rotation. Since the rotation is constant, the apparent rotating stiffness of the system varies periodically over time. The crack closes for tϵ[0 : 0:015] the stiffness is that of the healthy system Ks(t)=K0 and tϵ[0:015 : 0:03] The crack opens indicate a strong loss of rigidity so Ks(t)<ko The crack is said to be breathable.
Figure 2: Different crack states on the shaft.

Figure 3: Ks(t) function.

Spectral analysis results
the energy spectrum is obtained from the transform Fourier.
This is calculated on the vibratory signal (obtained by the hilbert
transform) averaged synchronously with respect to the shaft
rotation period to be monitored. The vibratory signal was acquired
on a gearbox in healthy operation and in the presence of a crack fault at the gearbox shaft. Figures 4-6 show the frequency spectra of
the averaged signal for different cases of operation of the gearbox.
Figure 4 corresponds to the faultless case; we find no periodic
side lines (or one frequency) of period equal to the rotational
frequency of the analyzed element (shaft).
Figure 4: Instantaneous phase spectrum (without fault).

Figure 5 corresponds to the case of a small crack fault at the shaft. It is noted that the main change is the appearance of a frequency (fd) corresponds to the rotation frequency of the shaft, thus indicates the presence of a fault on the shaft considered.
Figure 5: Instantaneous phase spectrum(with fault).

Figure 6 corresponds to the case of a larger crack fault (different degrees of gravity), we still observe the appearance of a frequency ( fd) corresponds to the rotation frequency of the shaft and these harmonics (n*fd ), thus testifying to the growing evolution of the defect (Table 1).
Table 1:Characteristic Frequency.

Figure 6: Instantaneous phase a) 10% of crack ; b) 15% of crack ; c)20% of crack.

Conclusion
In this paper, a dynamic model of a spur gear was presented for examine the gearbox dynamic behavior in the presence of defects such shaft cracking. The approach used in this study is based on instantaneous phase analysis to detect and diagnose the shaft defect through the vibration displacement of a gearbox. The utilized approach is evaluated through a simulation benchmark taking into account healthy and abnormal gearbox. The obtained results showed that the Hilbert transform based on instantaneous phase is sweated for such study to detect the shaft crack. In fact, the proposed method allows identifying accurately the frequency bands where the fault impulses are concentrated. Due to this, a higher efficiency and higher sensitivity when using an appropriate demodulation frequency band can be achieved.
References
- Azeddine R, Chemseddine R, Djamel B (2017) A new method to enhance of fault detection and diagnosis in gearbox systems. Journal of Vibroengineering 19(1): 176-188.
- Ling Z, Xiaoyan C, Darong H (2014) Fault diagnosis for gearbox based on EMD and multifractal. The 26th Chinese Control and Decision Conference (2014 CCDC), Changsha, China pp. 3792-3796.
- Ayad M, Rezki M, Saoudi K, Benziane M, Arabi A, et al. (2015) Wavelet transforms coefficients and autocorrelation of gear system for early damage detection. 2015 7th International Conference on Modelling, Identification and Control (ICMIC), Sousse, Tunisia pp. 1-6.
- Li W, Dadouche A, Liu J (2016) Frequency analysis on vibration signatures for gearbox spalling defect detection. 2016 IEEE International Conference on Prognostics and Health Management (ICPHM), Ottawa, Canada pp. 1-7.
- Liang X, Zuo MJ, Feng Z (2018) Dynamic modeling of gearbox faults: A review. Mechanical Systems and Signal Processing 98: 852-876.
- Attoui I, Boudiaf A, Fergani N, Oudjani B, Boutasseta N, et al. (2015) Vibration-based gearbox fault diagnosis by DWPT and PCA approaches and an adaptive neuro-fuzzy inference system. 2015 16th International Conference on Sciences and Techniques of Automatic Control and Computer Engineering (STA), Monastir, Tunisia pp. 234-239.
- Ratni A, Rahmoune C, Benazzouz D (2017) Detection of shaft crack fault in gearbox using Hilbert Transforms. 2017 6th International Conference on Systems and Control (ICSC), pp. 422-425.
- Feng W, Xie X, Cao Y (2009) Study on fault diagnosis of gear with spall using ferrography and vibration analysis. 2009 International Conference on Measuring Technology and Mechatronics Automation, China pp. 723-727.
- Li H, Zhang Y, Zheng H (2009) Gear fault detection and diagnosis under speed-up condition based on order cepstrum and radial basis function neural network. Journal of Mechanical Science and Technology 23: 2780-2789.
- Long D (1998) Comments on hilbert transform based signal analysis. MERS Technical Report MERS 95-005. Microwave Earth Remote Sensing Laboratory, Utah.
- Khelfi H, Hamdani S, Nacereddine K, Chibani Y (2018) Stator current demodulation using hilbert transform for inverter-fed induction motor at low load conditions. 2018 International Conference on Electrical Sciences and Technologies in Maghreb (CISTEM), Algeria pp. 1-5.
© 2021 Ratni Azeddine. This is an open access article distributed under the terms of the Creative Commons Attribution License , which permits unrestricted use, distribution, and build upon your work non-commercially.
Editor In Chief


.jpg)


Signup for Newsletter

Quick Links
 Editorial Board Registrations
 Submit your Article
 Refer a Friend
 Advertise With Us
Our Recent Edition

.jpg)


Top Editors


.jpg)


.bmp)
.jpg)
.png)
.jpg)


.jpg)


.png)

.png)


.png)


Financial Support

Sponsors

Latest e-Books

Latest Video

 a Creative Commons Attribution 4.0 International License. Based on a work at www.crimsonpublishers.com.
Best viewed in
a Creative Commons Attribution 4.0 International License. Based on a work at www.crimsonpublishers.com.
Best viewed in