- Submissions

Full Text
Academic Journal of Engineering Studies
Gis-Based Demograhic Analysis Studies for Population Group Domiciled in Vicinity Engineered Landfill Sites
Erogunaiye OP1* and Olowokere D2
1Department of Urban Planning & Environmental Policy, USA
2Department of Engineering, USA
*Corresponding author: Erogunaiye OP, Department of Urban Planning & Environmental Policy, USA
Submission: November 05, 2020 Published: November 24, 2020
.jpg)
ISSN:2694-4421 Volume1 Issue4
Abstract
This paper is a study to investigate the environmental impacts to the demographics adjoining landfill sites in the Dallas-Fort Worth area. It is GIS-based spatial analysis, and data from the 2015 US Census Bureau was used to identify selected socio-economic variables within the landfill sites’ surroundings. The spatial distribution result shows that the minorities and low-income populations in Tarrant and Dallas Counties are disproportionately exposed to the environmental hazards. The study provides vital data for local agencies and community-based organizations (CBOs) seeking to effect environmental advocacy for their communities.
Keywords: Spatial analysis; Landfill; Environment justice
Introduction
Previous research has shown that minority and low-income communities have been
exposed to a higher level of environmental pollution and health risks than other society at
large [1-3]. In response to this convincing evidence, the civil rights movement was founded
in the 1960s to raise awareness of the disproportionate exposure to toxic pollution [4].
Subsequently, Executive Order 12898 was enacted by President Clinton in February 1994,
requiring every federal agency to address the inequalities and achieve the principle of
environmental justice in the United States [1].
In 2016, approximately 34.73 million tons of solid waste was disposed into landfills in the
state of Texas [5]. Although tremendous efforts have been made to minimize the amount of
waste disposed of by engaging in comprehensive recycling programs (McCarthy, 2016), the
EPA (2014) reports still show that over 55% of the waste generated each year ends up in one
of over 3,500 landfills in the United States. The continuous production and disposal of trash
into landfills will jeopardize neighborhoods’ environmental and health quality surrounding
the toxic waste facilities. Several types of research have shown that the environmental
degradation due to landfills emissions has also led to health conditions such as asthma,
diarrhea, cholera, and tuberculosis more than the residents living far away from landfill sites
[6-9]. Also, several kinds of research have linked the landfill sites to adverse health issues
such as Cancer, Leukemia, congenital heart disease, low birth weight, and chronic respiratory
diseases, etc. [9]. The health impacts on these vulnerable populations are further amplified
by several other socioeconomic factors such as poverty, lack of access to proper healthcare,
healthy food, unemployment, lack of education, and public transportation [10]. Therefore,
to determine the current socio demographics surrounding communities at proximity to the
landfills, a spatial investigation into the probable correlation is necessary. This study aimed
to evaluate the socio-demographics surrounding the landfills in the DFW area to determine if
the environmental inequalities still exist.
Study Area
The Dallas-Fort Worth (DWF) occupies a large area in the North Central and the Prairies and Lakes region of Texas. It occupies a total area of 9,286 square miles, out of which 8,991sq. mi is land and 295 square miles is water [11]. The DFW is the largest metropolitan area in Texas [12] and the fourth largest in the United States with a total population of over 6.83 million according to the 2015 estimate of the U.S. Census Bureau. The DFW has experienced a consistent increased rate in population growth and diversity. According to the [11], the DFW population grew by approximately 31.31% from 5,204,126 in 2000 to 6,833,420 in 2015. The DFW is made up of twelve counties, namely: Collin, Dallas, Denton, Ellis, Hood, Hunt, Johnson, Kaufman, Parker, Rockwall, Tarrant, and Wise County [13]. According to the 2017 TCEQ list of active landfills in Texas, there are nineteen (19) active landfills sites in the DFW area. Seventeen out of the nineteen sites are Type 1, while the remaining two sites are Type IV. The Type 1 landfills are in eight counties namely: Collin, Dallas, Denton, Ellis, Hunt, Johnson, Parker, and Tarrant Counties. Figure 1 below shows the map of the Dallas-Fort Worth region with the twelve counties and all the active Type 1 landfills. The map reveals that Dallas County has four landfill sites, making it the county with the highest number of landfill sites.
Figure 1: Type 1 Landfills in the Dallas-Fort Worth.

Method
The Geographical Information System (GIS) is used in this study to spatially evaluate and compare the socio-demographic disparities surrounding the landfill site in the DFW region. The data utilized was retrieved from several places, including the North Central Texas Council of Governments (NCTCOG) and the U.S. Census websites. The landfill shapefile was downloaded from the TCEQ website and had a pre-defined projection in NAD 1983 (feet) State Plane Coordinates. The landfill shapefile comprises of both the active landfills point shapefile and the abandoned landfill (permitted) shapefile. The current location of the landfills was verified by using google earth maps. The census tract hosting each landfill was identified using the U.S. Census Geocoder, a web interface tool used to convert addresses to an approximate coordinate -longitude and latitude that includes the census geography the address is within (www.census.gov). The Census boundary shapefile was downloaded from the U.S. Census Tiger line. DFW’s racial and socioeconomic data were from the 2015 American Community Survey- 5 years’ estimate, retrieved from the U.S. Census Bureau database. The unit of analysis is at the census tract level. The datasets collected from the U.S. Census website include a breakdown of race/ethnicity, median household income, median housing property, and educational attainment. These variables were used in prior Environmental Justice (EJ) research [14] to assess demographic disparities in environmental hazards distribution. The selected variables were chosen because they identify and represent the community’s minority group and wellbeing.
Result
A descriptive statistic was calculated for the selected variables presented in Table 1 below to investigate the DFW’s racial and socioeconomic characteristics. The total number of census tracts sampled in 2015 census tracts was 1,324. The results show that the white populations are the predominant racial groups with mean values of 48.38%, followed by Hispanics 28.45%. DFW’s median household income is $65,178, and the percentage below the poverty level is approximately 15%. The median housing value of the area is $180,103 Table 1.
Table 1:Descriptive statistics for selected variables in DFW.

Source: US Census data 2015- American Community Survey -
5-year estimates
Figure 2 shows the percentage of the White population in DFW
in 2015. The result shows that most census tracts with a higher proportion of Whites are in Wise, Parker, Hood, Kaufman, Johnson,
and Hunt Counties, further away from the landfill sites and Dallas
and Tarrant Counties. Figure 3 displayed the proportion of the
African American population in the DMA. The census tracts hosting
the highest proportions of African Americans (i.e., greater than one
standard deviation above the mean [32.75%] are concentrated in
Tarrant and Dallas County, where most of the landfills are located.
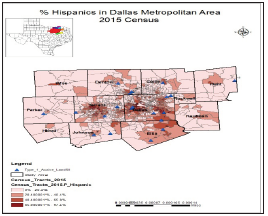
The percentages of Hispanic population displayed in Figure 4 show
that most of the census tracts with the highest proportions of
Hispanics (i.e., greater than one standard deviation above the mean
[50.37 %]) in Dallas, Ellis, and Tarrant Counties where the majority
of the landfills are located.
Figure 2:Proportion (%) of White population, DMA (2015).
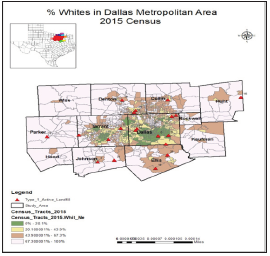
Figure 3:Proportion (%) of African American population, DMA (2015).

Figure 4:Proportion (%) of Hispanic population, DMA (2015).
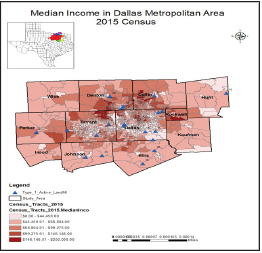
The socioeconomic indicators in Table 1 shows that the median household income was $65,178 in 2015. Figure 5 reveals that the census tracts with the highest median household incomes (i.e., greater than one SD above the mean [$99,301]) are in Tarrant, Dallas, Denton, and Collins Counties, further away from the landfill sites. While, the census tracts that host people with household income less than $44,450 are in Tarrant and Dallas Counties, and some few census tracts in Johnson, Dentins, and Collins Counties, closer to the landfill sites.
Figure 5:Median Household Income, DFW (2015).
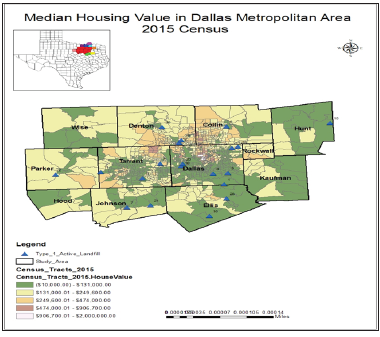
Also, from Table 1, the median housing value of DFW was $180,103 in 2015. Figure 6 shows that the census tracts with the highest median housing values (i.e., greater than one SD above the mean [$321,596]) are in Dallas and Tarrant counties, further away from the landfill sites. In contrast, the census tracts with the lowest median housing value (i.e., less than $131,000) are concentrated in Tarrant, Dallas, Kaufman, Ellis, Hunt, Wise Counties, and some part of Collins County, but all within the neighborhood surrounding the landfills sites.
Figure 6:Median housing value, DFW (2015).
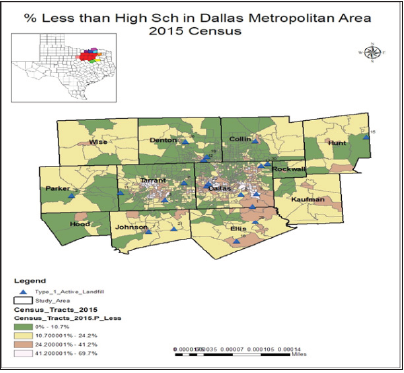
The educational attainment revealed in Table 1 shows that the mean value of people less than high school graduate was approximately 16% while the percentages of people with a bachelor’s degree were 21%. Figure 7 reveals that people with less than high school graduates live in the census tracts closer to the landfill (Tarrant and Dallas Counties). In contrast, a higher proportion of people with bachelor’s degrees live further away from the landfills in Collins, Denton, Dallas, and Tarrant Counties.
Figure 7:(%) less than high school grad, DFW (2015).
Discussion
This study used Geographic Information System (GIS)
technology to examine neighborhoods’ racial and socioeconomic
disparities close to the landfill site. Looking at the DFW region results, the map reveals that out of all the counties in this region,
Dallas, Tarrant, south of Denton, and northeast Ellis Counties are
the most vulnerable counties to environmental hazards. In total,
these counties host twelve out of the seventeen Type 1 Landfills in
the areas. Dallas County is hosting the most facilities with four (4)
landfills sites, Tarrant County is hosting two (2), Denton is hosting
three (3), and Ellis is hosting three (3) landfill sites. These counties,
especially Dallas and Tarrant Counties, have a higher concentration
of Hispanics and African American percentages residing close to the
landfill sites, while the proportion of White are lower closer to the
landfills and increases across the varying distances further away
from the landfills. Although the DFW region has experienced an
increased population over the years, which might have contributed
to the increase in the percentage of people of color, the outcome
of the result supports the scholars who found racial disparities
associated with hazardous facilities and claim that minorities are
disproportionately exposed to environmental hazards [3].
The result also revealed that the census tracts that host lowincome
populations are in Tarrant and Dallas Counties, which are
most vulnerable to environmental hazards. Few census tracts in
Johnson, Denton, and Collin Counties, closer to the landfill sites, also
host some low-income populations. This evidence also supports the
claim that low-income population are exposed to environmental
hazards [15].
Also, the finding reveals that the census tracts hosting landfill
sites in the DFW area have lower property values than the nonhost
areas [16-20]. The reduced property value closer to the
landfills or the affordability of these neighborhoods’ properties
could have attracted minorities population with low-income [21-
25]. The reduced value of properties in these neighborhoods
supports the claim that the landfill’s presence could significantly
impact the value of properties around the sites [10]. Similarly, the
percentage of people with less educational status tend to live closer
to the landfills site in Tarrant and Dallas Counties [26-30]. The
educational attainments can contribute to the resident’s awareness
of public health and environmental risks, thereby informing their
decisions on where to live.
Conclusion
The outcome of our findings reveals that a higher percentage of the minorities and low-income people resides in the communities hosting the majority of the landfill sites in the DFW area. Also, a higher proportion of people with less than high school graduates live close to landfills. Likewise, the host census tract’s property values are lower than the census tracts not hosting a landfill [31- 34]. Although we cannot determine if the landfill sites were there before migration into the neighborhood, the outcome of the findings shows that people of color and low- income are most vulnerable to the environmental and public health hazards. Therefore, this study can serve as information to be used by local and federal agencies for future siting of landfills in the DFW area. Denton, Tarrant, and Dallas Counties host more waste disposal sites than the other counties in the Dallas area, so they should not be considered for future siting of landfills in the DFW region.
References
- Cutter SL (1995) Race, class and environmental justice. Progress in Human Geography 19(1): 111-122.
- Bullard RD, Johnson GS (2000) Environmentalism and public policy: Environmental justice: Grassroots activism and its impact on public policy decision making. Journal of Social Issues 56(3): 555-578.
- Bullard RD (2014) The Mountains of Houston: Environmental Justice and the Politics of Garbage, Cite 93, Rice Design Center, USA.
- Aydin R, Morefield R (2009) Superfund sites and race: Evidence from Houston. Southwestern Economic Review, USA.
- TCEQ (2017) Municipal solid waste in Texas: A year in review. FY 2016 Data Summary and Analysis AS-187/17, USA.
- Vrijheid M (2000) Health effects of residence near hazardous waste landfill sites: A review of epidemiologic literature. Environ Health Perspect 108(S1): 101-112.
- Adeola FO (2000) Endangered community, enduring people: Toxic contamination, health, and adaptive responses in a local context. Environment and Behavior 32(2): 209-249.
- Sankoh FP, Yan X, Tran Q (2013) Environmental and health impact of solid waste disposal in developing cities: A case study of Granville brook dumpsite, Freetown, sierra leone. Journal of Environmental Protection 4(7): 665-670.
- Brender JD, Maantay JA, Chakraborty J (2011) Residential proximity to environmental hazards and adverse health outcomes. Am J Public Health 101(S1): S37-52.
- O Neill MS, Jerrett M, Kawachi I, Levy J, Chen A, et al. (2003) Health, wealth, and air pollution: Advancing theory and methods. Environ Health Perspect 111(16): 1861-1870.
- US Census Bureau (2016) American Community Survey, 5-year estimates, USA.
- Houston Business (2004) The simple economics of the Texas triangle. Federal Reserve Bank of Dallas, USA.
- US Census Bureau (2015) American community survey 5-year estimates, Houston, USA.
- Deanna S, Harry W (2001) Environment Justice in Dallas County: A spatial analysis of hazardous waste site locations. In papers and proceedings of the Applied Geography Conferences 24: 201-208.
- Anderton DL, Anderson AB, Oakes JM, Fraser MR (1994) Environmental equity: The demographics of dumping. Demography 31(2): 229-248.
- Ready RC (2005) Do landfills always depress nearby property values? Issues at hand. University Park, PA: Northeast Regional Center for Rural Development, United States.
- Mmom PC, Mbee MD (2013) Impact of landfill site on real estate values in Port Harcourt Metropolis, Nigeria. IOSR Journal of Humanities and Social Science 10(6): 34-39.
- Bullard R (1990) Dumping in dixie: Race, class, and environmental quality. Boulder, Colorado. Westview Press, USA.
- Bullard RD (1983) Solid waste sites and the black Houston community. Sociological Inquiry 53(2-3): 273-288.
- Butler K, Hammerschmidt S, Steiner F, Zhang M (2009) Reinventing the Texas triangle: Solutions for growing challenges. Center for sustainable development, School of Architecture, the university of Texas at Austin, USA.
- Ouma YO, Kipkorir EC, Tateishi R (2011) MCDA-GIS integrated approach for optimized landfill site selection for growing urban regions: An application of neighborhood-proximity analysis. Annals of GIS 17(1): 43-62.
- Ted Bauer (2020) Inside the DFW population surge, 2010-2019 and 2020-2029, USA.
- TCEQ (2018) Municipal solid waste in Texas: A year in review. FY 2017 Data Summary and Analysis. AS-187/17, USA.
- Maranville A, Ting TF, Zhang Y (2009) An environmental justice analysis: Superfund sites and surrounding communities in Illinois. Environmental Justice 2(2): 49-58.
- Mohai P, Saha R (2015) Which came first, people or pollution? Assessing the disparate siting and post-siting demographic change hypotheses of environmental injustice. Environmental Research Letters 10(11): 115008.
- Mohai P, Pellow d, Roberts JT (2009) Environmental justice. Annual Review of Environment and Resources 34: 405-430.
- Mohai P, Saha R (2007) Racial inequality in the distribution of hazardous waste: A national-level reassessment. Social Problems 54(3): 343-370.
- Mohai P, Saha R (2006) Reassessing racial and socioeconomic disparities in environmental justice research. Demography 43(2): 383-399.
- US EPA (2016) Environmental justice, USA.
- US EPA (2016) Basic information about Landfills, USA.
- United Church of Christ (UCC) Commission for Racial Justice (1987) Toxic wastes and race in the United States. A national report on the racial and socio-economic characteristics of communities with hazardous waste sites. United Church of Christ, New York, USA.
- United Church of Christ Commission for Racial Justice (1987) Toxic wastes and race in the United States. A national report on the racial and socio-economic characteristics of communities with hazardous waste sites. United Church of Christ, New York, USA.
- US EPA (2016) Environmental justice. Learn about environmental justice, USA.
- US Environmental Protection Agency, USA.
© 2020 Erogunaiye OP. This is an open access article distributed under the terms of the Creative Commons Attribution License , which permits unrestricted use, distribution, and build upon your work non-commercially.
 a Creative Commons Attribution 4.0 International License. Based on a work at www.crimsonpublishers.com.
Best viewed in


.jpg)


 Editorial Board Registrations
 Submit your Article
 Refer a Friend
 Advertise With Us
.jpg)


.jpg)


.bmp)
.jpg)
.png)
.jpg)


.jpg)


.png)

.png)


.png)


