
- About Us
- Information
-

The Author ensures that the research has been conducted responsibly and ethically with adherence to all relevant regulations. read more..
- For Authors
- For Reviewer
- Manuscript Guidelines
- Membership
- Publication Ethics
-
- Journals
- Reprints
- e-Books
- Videos
- Policies
- Contact Us
 COVID-19
- Submissions


Full Text
Academic Journal of Engineering Studies
Review of Process Improvement Initiatives and Implementation of Lean Six Sigma in Forging and Casting Operations
Ali Montazer M*, Craig D and Kyle AA
University of New Haven, USA
*Corresponding author:Ali Montazer M, University of New Haven, West Haven, CT 06516, USA
Submission: August 08, 2019;Published: January 22, 2020
.jpg)
ISSN:2694-4421 Volume1 Issue2
Abstract
The implementation of Six Sigma and Lean methods has become more and more commonplace in the traditional manufacturing sector. Traditional manufacturing comprises, predominantly, casting, forging and the adjuvant machining operations. Although much of this work has migrated to developing countries, including India, China and the Eastern European countries, there are still profitable casting/ forging operation in the USA and would benefit from Lean Six Sigma initiatives to be even more cost and quality competitive. The adoption of Lean Six Sigma methodology has accelerated due to the high defect rates at many production facilities, leading to high number of defective parts or parts needing expensive alteration and rework. Despite the increased usage of Lean Six Sigma tools, a guidance for what may be expected as successful implementations LSS in terms of the popular metrics (process capability, sigma level, rejection rate, etc.) is not found in the literature. This paper will review the various works on the subject to analyze the tools and methods used, as well as the results and purposes of the six sigma initiatives to establish a guidance for expected results of such implementations. The findings documented in various works will also be analyzed to identify commonalities and to establish a menu of the most common tools used and the most common performance indicators for speedy and successful Lean Six Sigma implementations in traditional manufacturing.
Introduction
The commonly used products from the kitchen pots and pans to automotive camshafts to components of Multi-Million Dollar aircraft are produced by traditional manufacturing. Traditional manufacturing comprises, predominantly, casting and forging and machining operations. Our focus is on forging and casting operations since they often take place prior to any form of machining or other value-added processes to produce the basic building block of the product. Through globalization, most of this kind of work has migrated to India, China and the Eastern European countries. The developing world has provided manufacturers subassemblies and products at reduced cost to meet the ever-rising consumer demand. Casting is a manufacturing process in which liquid material is poured into a mold of some form. A mold is a hollow cavity that includes the desired shape. Forging is a manufacturing process involving the shaping of metal using localized compressive forces. In the typical forging operation forces are delivered onto a work piece with a hammer or a die. Forging is often classified according to the temperature at which it is performed: cold forging, warm forging, or hot forging [1].
There is little opportunity for rework 0n a piece produced by forging or casting operation. If there is an internal defect in the piece, it must often be rejected. External defects, depending on the piece, can be corrected but that would add time to the production cycle and in turn that would increase the cost. The nature of the products is such that if too many items are rejected, multiple type of costs is incurred, from raw materials wastage, to cost of handling and waste disposal. To maintain a competitive edge, traditional manufacturing firms have no choice but to attempt to reduce waste, improve processes and operations. Less than optimal quality, large number of rejected parts, and high operations costs have been the primary drivers for the manufacturers to look for ways to improve their processes, reduce and/or eliminate defects and become more responsive to the needs of the customer. With the need to reduce defects in forging/casting processes, Six Sigma methodology is a highly data driven technique framed around Statistical Process Control (SPC) and its derivatives which addresses the variability in the production (or service) process. It can be used to create and run a process with 3.4 million defects per one million opportunities. Six Sigma could be used to improve existing processes using DMAIC (Define, Measure, Analyze, and Control). Six Sigma can also be used to design new processes with some modification of DMAIC, often referred to Design for Six Sigma. The goal is to identify and control variation in the process or product through statistical process control [2].
Lean refers to the concept, tools and methodologies focused on maximizing customer value while minimizing waste. In a process of production of a product or providing a service, for example, waste would be considered any process or task that doesn’t add value to a product or service, and which could be removed without negatively affecting the product or service. A Lean environment revolves around the idea of continuous improvement where the goal is to achieve maximum value brought to the user/customer through a perfect value creation process with zero waste. A common type of waste within a process is a commonly referred to as a “bottleneck”. This is the situation where the flow of input is far greater than the flow of output. Eliminating bottleneck is one of the most effective ways to improve the quality and efficiency of any process. Lean Six - Sigma is a streamlined way of using the traditional Lean and Six Sigma approaches in a more agile and efficient implementation. The philosophy behind the merging of the two strategies is to address the shortcomings of the other as well as having all is needed to do when is needed to produce the desired quality of the goods/ services and to achieve the cost benchmark to be competitive. The primary purpose of our work in this paper is to find ways to bring the tools and techniques of Lean Six Sigma to a greater population of potential users in casting and forging industry.
Study Objective
The literature search conducted on the application of Lean Six Sigma (LSS) in improving quality and reducing cost in casting and forging operations produced more than 20 articles, which shows that the LSS tools are being taken advantage of by many manufacturers around the world. However, there are very likely many smaller and less technology adept manufacturers who could use the LSS tools and techniques but are not due to lack of in a house expertise and/or the cost of hiring consultants. The primary objective here was to survey and study the published works on the use of LSS in casting/forging and allied operations to identify the various response variables and quality improvement tools used in the process of LSS study and implementation. We also wanted to study the findings and results from those works, noting their breadth and degree of improvement of the processes or products for the various response variables. This information was then analyzed, organized and reproduced in a tabular format with certain measures of utility and application readiness in the casting/ forging and allied operations. Our hope is that this information will make the LSS tools and techniques more affordable and appealing, in terms of cost and time horizon, to smaller and less technology adept casting/forging outfits.
Review of Major Process Performance Indices
In Six Sigma quality terminology, process performance is usually explained in terms of sigma level of the process under investigation. The higher the sigma level, the better the process is performing. A different, and perhaps more meaningful, way to report process capability and process performance is through statistical measurements of Cp, and Cpk [2].
Cp or Process Capability (rational number) is an indicator of process capability, which is computed by:
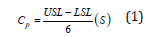
As much as Cp is common and easy to compute, it often does not reflect the true capability of the process under investigation. The more realistic and relevant measure is the Cpk, computed as:

Cpk is an index (rational number) which measures how close a process is running to its specification limits, relative to the natural variability of the process. The larger the index, the less likely it is that any item will be outside the specification [2]. Cpk measures how close one is to target and how consistent one is around one’s average performance. A person may be performing with minimum variation, but s/he can be away from the target towards one of the specification limits, which indicates lower Cpk, in this case Cp will be high. On the other hand, a person could be on average exactly at the target, but the variation in performance is high (but still within the lower and upper specifications). In such a case, the Cpk will be lower, but Cp will be high. Cpk will be higher only when one is meeting the target consistently with little variation.
With a compu value of Cpk=1, one can assert that at least 99.73% of the parts produced are good (or are within the specification). Sigma Level refers to the standard deviation of the process around the process mean. For example, a 3-sigma process would represent that 99.865% of the parts produced are good compared to a 6-sigma process which would imply that 99.999667% of the parts produced are good. Said differently, a 6 -sigma process would guarantee no more than 3.4 defective parts per million prats produced [2].
Compilation of Works from the Literature
As summary of the process improvement results from the papers related to casting and forging studies (generally referred to as foundry operations) are presented in (Table 1). The first column of the table provides reference to the article from which data presented in the table were extracted. The second column represents the type operation studied. The third column identifies the tools used by the authors of the article referenced in column 1. Column 4 delineates the metrics reported by the authors. The columns labeled “Pre” and “Post” provides the values of the metrics obtained or computed prior to the process improvement study and after the completion of the study. The column headed by “Delta” represents the change realized (percentage for rejection rate and rational number for other metrics) for a process represented for the referenced study. The top 5 tools that used by the investigators of the studies (numbered 3 through 15 in the reference section) were Cause and Effect, Design of Experiments (DOE), Pareto Chart, Control Charts and Process Capability. Cause and Effect was by far the most widely used tool of Lean Six Sigma implementations as can be seen in (Table 1). Given the popularity and frequency of use of these five tools, it is recommended that they be the first set of process improvement tools when working in foundry industry [3].
Table 1:Summary of Pre and Post LSS Project Results Collected from Literature Review

As seen in (Table 1), every study achieved and reported appreciable improvements as measured by the specified metrics. For example, Study [3] achieved 2.22% improvement in rejection rate in their process. Study [4] realized 1.29 units improvement in their Cp metric and 1.91 units improvement in their Cpk metric as a result of their LSS initiative. Study number [5-7], a casting operation, achieved 0.21 improvement in the σ Level of their process. As it is observed from (Table 1), there are widespread ranges for the five metrics used. From the use of these tools, significant improvements in a process can be achieved. The most common performance indicators are summarized in term of the average value for the metrics Cp, Cpk, Rejection Rate and Sigma Level, presented in (Table 2).
Table 2:Summary of Performance Indicators of the Reviewed Papers

Bases on the several studies that considered Cp as their measurement metrics, the average were found to be 0.53 and 1.13 units, meaning that on average one could expect that about 0.06 units improvement if engaged in a LSS initiative for their traditional manufacturing processes. With the Rejection Rate, the average pre and post values were 18.04% and 3.77%, respectively, which implies one can expect an average Rejection Rate improvement of 63.25% for attempting to improve Rejection Rate in a traditional manufacturing process. The same narratives apply for Cpk and Sigma Level, using the values associated with these metrics. The last column of (Table 2) may be more helpful as a benchmark since it presents the improvement metrics in the range form. For example, the studies reported in this paper which used Sigma Level as a metric in their LSS initiative, realized improvement in the Sigma Level in the range [1.79, 20.36]. Based on the works reviewed, we can expect an average percentage Sigma Level improvement of 7.68(%) with the range falling in [1.79 %, 20.36%]. These studies were almost entirely based on manufacturing firms outside of the USA and as such the improvement levels realized overseas may not be achievable in the USA due to the initial performance metrics.
Discussion
The work related to the application of Six Sigma in the foundry industry as reported in more than 12 papers was reviewed and analyzed to investigate the methodologies and factors used to improve casting and forging processes. Study factors included Six Sigma tools, response variables, and performance indicators utilized to measure and report their results. These are summarized in Tables 1 and Table 2, respectively. The top performance indicators were identified to be the Cp, Cpk, Rejection Rate and Sigma Level. The top tools utilized to arrive at these performance indicators were Cause and Effect, DOE, Pareto Chart, Control Charts, and Process Capability indexes and their derivatives. Smaller and less capitalized companies that are interested in implementing Lean Six Sigma techniques to improve their processes but do not have in house expertise nor the financial strength to hire expensive consultants should not shy away due to these lacking’s. In fact, Prabu [8], suggests that in order to overcome the economical hurdle of implementing Six Sigma, practitioners should not invest in large scale Six Sigma programs that include belt-based employee investments. They should just simply begin to apply the tools of DMAIC on a small scale. Simple implementation of DMAIC is useful in identifying the most critical to quality defects that bring about solutions to prevent the recurrence of defects [9-15].
Six Sigma provides a universal and suitable toolset to achieve new knowledge and increased productivity in the foundry industry. However, it must be implemented properly as several high-level challenges have been identified in our review of the literature available. Examples are inadequate support from top management, resistance to change within the organization, poor or improper planning, inadequate training, lack of or inadequate cross departmental communication and improper definition of internal and external customers. These challenges must be addressed prior to implementing Lean Six Sigma to any process or organization, if long term success is to be achieved. Small to medium foundry enterprises should simply start online training on the tools used most frequently on processes in their industry and be educated about them so they may be able to hire the right consultant to do the right study with the right tools on targeted processes. Alternatively, they could contact the colleges/universities with industrial and systems engineering program near them and hire one or more undergraduate or graduate interns to work on the project. Of course, there ought to be an informed and knowledgeable manger or engineer to supervise and control the interns’ work.
Summary and Conclusion
It is expected that on average, when using Process Capability, an average projected percent improvement in Cp and Cpk would be 408.35% and 1037.41%, respectively. The corresponding range of improvement in Cp is [4.9%, 1075%] while for Cpk. Cpk is [141.48%, 1933.31%]. If cycle time is the performance indicator, then the average expected percent improvement would be 57.45% though it is not included in (Table 1). Rejection rate was by far the most widely used performance indicator used in the reviewed papers, with an average expected percent improvement of 63.25% and a range of [29.28%, 125.16%]. Sigma level was the last performance indicator with an average expected percent improvement of 7.68% and a range of improvement of [1.79%, 20.36%]. It is always and inherently more difficult to improve the sigma level, as compared to the other performance indicators, and the lower percentage achievement does not indicate less importance, but more challenging to achieve. Therefore, sigma level should not be viewed as a less desirable performance measure to try to work on if/when performance improvement initiatives are being considered.
References
- Grover, Mikell P (2016) Fundamental of modern manufacturing: materials, processes, and systems. 6th
- Levine MD, Patricia PR, Robert KS (2001) Applied Statistics for engineers and scientists: using Microsoft excel & Minitab. Prentice Hall, (1st edn).
- Chandra P, Chandra A, (2009) Quality tools to reduce crankshaft forging defects: An industrial case study. JISE 3(1): 27-37.
- Kumar M, Antony J et al. (2006) Implementing the Lean Sigma framework in an Indian SME: A case study. Production Planning Control 17(4): 407-423.
- Sushil K, Satsangi P, Prajapati DR (2011) Six Sigma and Excellent Tool for Process Improvement-A Case Study. International Journal of Scientific & Engineering Research 2(9): 1-10.
- Kumaravadivel A, Natarajan U (2013) Application of Six-Sigma DMAIC methodology to sand-casting process with response surface methodology. The International Journal of Advanced Manufacturing Technology 69: 1403-1420.
- Liu J (2011) Application of Six Sigma methodology in forging manufacturing plants: an example study.
- Prabu K, Makesh J, et al. (2013) Six sigma implementation through DMAIC: A case study. International Journal of Process Management and Benchmarking 3(3): 386-400.
- Singh H, Aman K (2016) Minimization of the Casting Defects Using Taguchi’s Method. International Journal of Engineering Science Invention 5(12): 6-10.
- Singh Jagdeep, Harwinder S, Pandher RPS (2017) Role of DMAIC approach in manufacturing unit: A case study. IUP Journal of Operations Management 16(4): 52-67.
- Bhupender S, Bansal A (2017) Six sigma implementation in small scale industry-A case study in foundry. International Journal of Advance Engineering and Research Development 4(6): 605-617.
- Sivam Sundar S, Pradeep N, Saravanan et al. (2017) Defect Analysis on casting by Six Sigma-QC techniques to minimize the defects and improve the productivity in oil pump casting. Jr of Industrial Pollution Control 33(2): 1714-1725.
- Patil S, Ganganallimath M et al. (2015) Application of Six Sigma Method to Reduce Defects in Green Casting Process: A Cast Study. IJRMEE 2(6): 37-42.
- Virender V, Amit Sharma, Depak J (2014) Utilization of Six Sigma (DMAIC) approach for reducing casting defects. International Journal of Engineering Research and General Science 2(6): 1065-1075.
- Sandeep JP, Jadhav, Ganesh PJ, Teli SN (2014) Steel Industries and Six Sigma. International Journal of Scientific & Engineering Research 5(12): 53-60.
© 2020 Ali Montazer M. This is an open access article distributed under the terms of the Creative Commons Attribution License , which permits unrestricted use, distribution, and build upon your work non-commercially.
Editor In Chief


.jpg)


Signup for Newsletter

Quick Links
 Editorial Board Registrations
 Submit your Article
 Refer a Friend
 Advertise With Us
Our Recent Edition

.jpg)


Top Editors


.jpg)


.bmp)
.jpg)
.png)
.jpg)


.jpg)


.png)

.png)


.png)


Financial Support

Sponsors

Latest e-Books

Latest Video

 a Creative Commons Attribution 4.0 International License. Based on a work at www.crimsonpublishers.com.
Best viewed in
a Creative Commons Attribution 4.0 International License. Based on a work at www.crimsonpublishers.com.
Best viewed in