- Submissions

Full Text
Annals of Chemical Science Research
A Statistical Analysis of the Mechanical Properties Tests of Three Paper Wrapping Plastic Films
Katerina Chryssou* and Eugenia Lampi
General Chemical State Laboratory, B’ Chemical Division of Athens, Department A’ Tsocha 16, Greece
*Corresponding author:Katerina Chryssou, General Chemical State Laboratory, B’ Chemical Division of Athens, Department A’ Tsocha 16, 11521 Athens, Greece
Submission: April 28, 2025;Published: May 13, 2025

Volume5 Issue1May 13, 2025
Abstract
Statistical tests were used to check the normality of the mechanical properties, and the homogeneity of the variances for the populations of the groups of the properties, of three plastic films before performing the one-way ANOVA test. The tensile strength, the tearing resistance, both in the MD and the CD direction and the thicknesses were the properties of three samples tested. Plastic film samples 2 and 3 MD tensile strength data were found normal using the Shapiro-Wilk test of normality. For plastic film 1 we proceeded with the Spearman’s non-parametric linear correlation test and it was found that the MD tensile strength of film 1 had a weak negative linear correlation with the MD tensile strength of sample 3. Plastic film samples 1, 2 and 3, MD tearing resistance data were found normal using the Shapiro-Wilk test of normality. Plastic film sample’s 1 thickness data was found normal using the Shapiro-Wilk test. For plastic film samples 2 and 3, the Spearman’s non-parametric linear correlation test was applied and the thickness data of sample 2 was correlated weakly and negatively linearly with the thickness of sample 3. Levene’s statistic test of homogeneity of variances for the nine categories of MD mechanical properties and thickness of the films was found statistically significant thus there was no equality between the population variations. The one-way ANOVA test was found statistically significant (F (8,114) =905.319>1.83) (p<0.001) and thus at least two of the nine mean values of the MD mechanical properties, and thickness’s of the three films differed. A post hoc test was then performed; the multiple comparisons Bonferroni test and we detected the values of the mechanical properties between which differences occurred. The same procedure was followed for the CD tensile strength and the CD tearing resistance data, and the thickness’s of the three plastic films. The CD tensile strength data of all three plastic films was found normal. Also, the CD tearing resistance data for all three film samples was found normal. The Levene’s statistic=22.562, p=0.000 test was found statistically significant and no equality of variance was observed. The one-way ANOVA test was also statistically significant (F(8,122)=269.487>1.83) (p<0.001) and at least two, of the mean CD values and the thickness values, differed. The Bonferroni test showed that the CD tensile strength differed significantly, in terms of the mean value, with the CD tearing resistance of all three film samples. Anisotropy was observed on the tensile strength and the tearing resistance of the plastic films 2 and 3, in contrast with film 1 for which isotropy was detected.
Keywords:Thin plastic films; Tensile strength; Thickness; Tearing resistance; Shapiro-Wilk test of normality; Spearman’s nonparametric correlation test; One-Way ANOVA test; Multiple comparisons Bonferroni test
Introduction
Mechanical testing is one of the features used to analyze the material’s capabilities in current biomaterials [1]. Characterization of the mechanical properties of biological materials is also necessary for many applications, including disease diagnosis, tissue modeling, tissue engineering, assessment of cellular adaptation processes and biomimetics [2]. Plastic is a synthetic organic polymer used in various industries, especially food and packaging [3]. In the studies of scientific research, statistical tests are used to check the normality of the distribution of the examined features and are applicable in the study of multivariate samples [4]. It is important to choose an appropriate method of processing statistical data and to use knowledge competently in various research activities [4]. The Shapiro-Wilk test is a general test for normality of the composite hypothesis that the data are independent and identically distributed and normal [5]. Non-parametric Spearman correlation test is a non-parametric measure of relation between variables, using ranks to calculate the correlation. Spearman’s correlation assesses how well the relationship between two variables can be described using a monotonic function [6]. Analysis of variance (ANOVA) is employed to determine the optimum combination of the manufacturing parameters [7]. Multiple comparisons Bonferroni test [8] is performed in order to determine differences among the categories of parameters tested. The Bonferroni approximation is a simpler approximation of the Sidak equation which involves a fractional power and refers to the probability of making as least one Type I error for a family of C tests [8]. The Bonferroni test is the second perhaps more popular multiple comparison tests after the Tukey (HSD) test. The test controls the probability of a type I error with the help of a correction (Bonferroni correction) at the default significance level α. For the calculation of the correction, thus also the application of the test, the number of multiple comparisons that will be carried out must be known in advance. Often overcorrects the probability of a type I error [9,10].
Materials and Methods
Instruments and materials
Test pieces of dimensions of 21.0cmx1.5cm were cut, in the machine direction (MD) and, in the counter machine direction (CD), from three different plastic film samples by a guillotine IDEAL 1043 GS. The test pieces were conditioned at 23 °C and 50%RH for 16hr in a conditioning chamber [11]. A tensile testing machine Zwick Roell Z2.5 BT1-FR 2.5th D14/2008, S.N. 181435/2008, was used for measuring the tensile strength in MPa, of the three wrapping plastic films, across the MD and the CD direction, according to ASTM Standard Method D 882-10 [12] with a 500mm/min constant rate of elongation (cross head speed). The plastic test pieces had a 15mm width. The grip-to-grip separation of the two clamps of the tensile machine was set at 50mm initially for plastic film samples 1 and 2, and was set at 180mm initially for the plastic film sample 3 [12].
A digital precision micro-meter TMI Model No 49-61-01-0002, S.N. 33421-01, with range 0-1.270mm was used to measure the thickness of the three plastic films in mm. Twenty measurements were made on the test pieces of 10cmx10cm dimensions, for each of the three films [13]. The test pieces of the three plastic films were also conditioned at 23 °C and 50%RH for 16hr in a conditioning chamber [11].
A Lorentzen & Wettre, Stockholm Sweden, pendulumtype manual tearing tester with serial number 1210, code:009, type:95021, No:5529, was used to measure the Elmendorf tearing resistance of the three plastic films in mN. Each test piece dimensions were 7.6cmx6.3cm. The test pieces were cut both in the (MD) direction, and in the (CD) direction. A pack of four rectangular sheets of the same size (7.6cmx6.3cm), was tested according to ISO 1974:2012 [14]. The test pieces of the three plastic films were also conditioned at 23 °C and 50%RH for 16hr in a conditioning chamber [11]. IBM SPSS data analysis software was used throughout this study.
Results and Discussion
The tensile strength across the machine direction (MD) in MPa (Figure 1 & Figure 2), the tearing resistance across the MD direction in mN, and the thickness in mm of three different paper wrapping plastic films were determined. The relevant data were compiled in Table 1 [15].
Figure 1:Tensile force curves in Newton versus strain in mm, for the ten specimens of the second paper wrapping plastic film tested in the machine direction (MD) and the relevant statistics. The initial grip to grip separation was set at 50mm (Table 1).
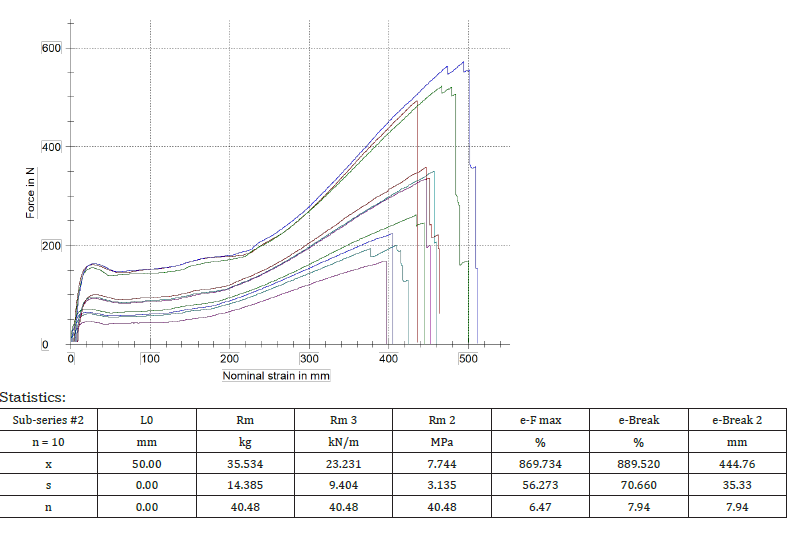
Figure 2:Tensile force curves in Newton versus strain in mm, for the ten specimens of the third paper wrapping plastic film tested in the machine direction (MD) and the relevant statistics (Table 1). The initial grip to grip separation was set at 180mm.
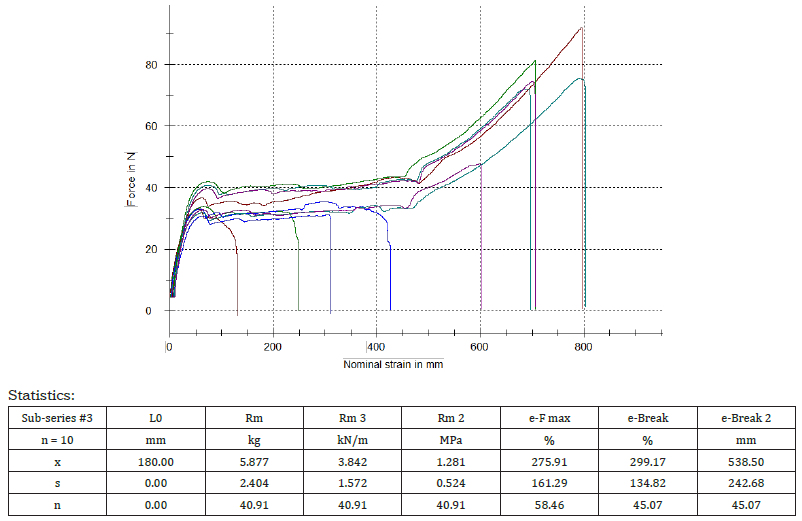
Table 1:MD Tensile strength in MPa, MD Tearing Resistance in mN, and Thickness in mm, of three samples of paper wrapping plastic film.
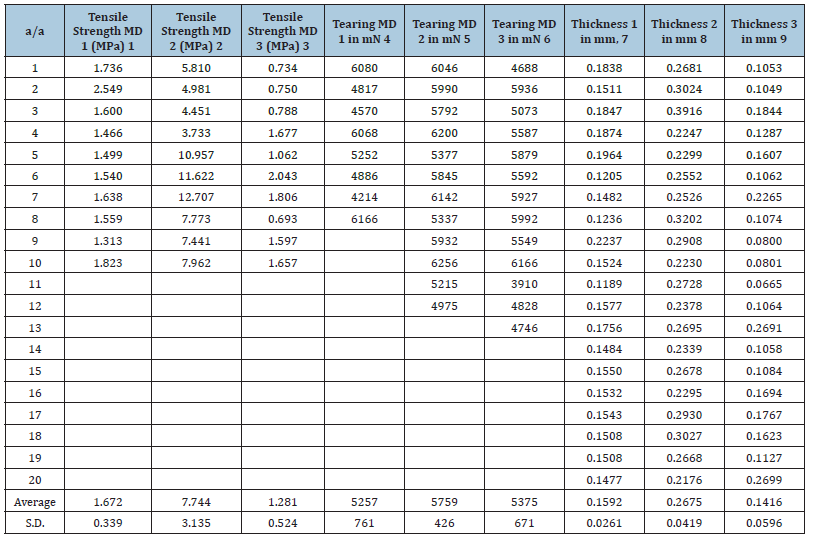
Because the number of observations in Table 1 was less than 50 the Shapiro-Wilk Test was used for checking normality of the Table 1 data, of the three MD tensile strength variables, against the Kolmogorov-Smirnov test. The null hypothesis for the Shapiro-Wilk normality test was that the data set was normally distributed.
Because the p-value from the Shapiro-Wilk test (Figure 3), as for the parameter MD tensile strength, was less than 0.05 for the sample 1 it suggested that the null hypothesis of normality could be rejected for that sample. For this reason, its correlation with sample 3 would be carried out with the non-parametric Spearman correlation test. The test gave a p value of 0.442 for the tensile strength of sample 2, which was greater than 0.05. Therefore, the null hypothesis was accepted and the data set was normally distributed [16]. For samples 2 and 3, the p-value from the Shapiro- Wilk test was greater than 0.05 and the data was normal [5]. Then for samples 1 and 3 we proceeded to apply Spearman’s nonparametric linear correlation test (Figure 4) [17]..
Figure 3:The results of the Shapiro-Wilk test for the three MD tensile strength variables for the three samples of plastic films.

Figure 4:The results of the linear correlation test of Spearman for samples 1 and 3 MD tensile strength.

In Figure 4, the linear Spearman correlation coefficient was -0.297, p=0.405, and it was negative and the control was not statistically significant. That meant that as the MD tensile strength of the sample 1 increased the other variable, the MD tensile strength of the sample 3, tended to decrease. Also, the Spearman coefficient was closer to -1 than to 0 and the relationship between these two variables was weak. That meant that the MD tensile strength of sample 1 was correlated negatively with the MD tensile strength of sample 3, with weak negative linear correlation.
Because the number of observations in Table 1 was less than 50 the Shapiro-Wilk Test was used for checking normality of the table 1 data, of the three MD direction tearing resistance variables, against the Kolmogorov-Smirnov test (Figure 5).
Figure 5:The results of the Shapiro-Wilk test for the three MD direction tearing resistance variables for the three samples of plastic films.

Because the p-values from the Shapiro-Wilk test (Figure 5), as for the parameter MD tearing resistance, were greater than 0.05 for the samples 1 and 2 and 3, it was suggested that the null hypothesis of normality could not be rejected for these three samples. For this reason, their correlation would not be carried out with the non-parametric Spearman correlation test. For samples 1, 2, 3 the p-value from the Shapiro-Wilk test was greater than 0.05 and the data was normal [5].
There should have been quoted here a homogeneity of variances test also, but we had displayed it in Figure 6 (Levene’s test). Because the number of observations in Table 1 was less than 50 the Shapiro- Wilk Test was used for checking normality of the Table 1 data, of the three thickness variables, against the Kolmogorov-Smirnov test.
Figure 6:Equality of variances check.

Because the p-values from the Shapiro-Wilk test (Figure 7) were less than 0.05 for the samples 2 and 3 it suggested that the null hypothesis of normality could be rejected for these two samples. For this reason, their correlation would be carried out with the non-parametric Spearman correlation test. For sample 1 the p-value from the Shapiro-Wilk test was greater than 0.05 and the data was normal [5]. Then for samples 2 and 3 we proceeded to apply Spearman’s non-parametric linear correlation test.
Figure 7:The results of the Shapiro-Wilk test for the three thickness variables for the three samples of plastic films.

Nonparametric Correlations
In Figure 8 the linear Spearman correlation coefficient was -0.092, p=0.701, and it was negative and the control was not statistically significant. That meant that as the thickness of the sample 2 increased the other variable, the thickness of the sample 3, tended to decrease. Also, the Spearman coefficient was closer to 0 than to 1, and thus there was nearly no monotonic relationship between these two variables. That meant that the thickness of sample 2 was correlated negatively with the thickness of sample 3, with very weak negative linear correlation.
Figure 8:The results of the linear correlation test of Spearman for samples 2 and 3 thickness‘s.

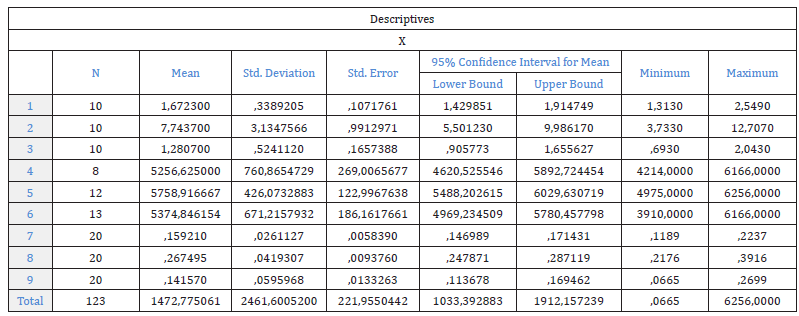
Before proceeding to the application and interpretation of the results of One Way ANOVA we had examined its application assumptions, the most basic of which stated that the distributions of the quantitative variables for the populations of the groups of Table 1 must be normal. Because the ANOVA test was quite resistant to deviations from normality, it was sufficient that the distributions of the groups of data of Table 1 showed elementary symmetry [18,19]. So, then we proceeded with the application of One-Way ANOVA test, for the populations of the groups of Table 1 and in the interpretation of its results. In Figure 9, were shown the descriptive statistics of the three MD mechanical properties, and their thickness, of the three plastic films presented in the Table 1.
From Figure 9 we observed that the second sample of thin film had the largest mean MD tensile strength value of 7.7437MPa, which was presented in position number 2 of the Figure 9, (Table 1) and immediately smaller average value of 1.6723MPa appeared for the first sample of thin film, placed in position 1, and the third sample followed with 1.2807MPa mean MD tensile strength value which was presented in position 3 of the Figure 9 & Table 1. The difference between the mean MD tensile strength values of the thin film samples 1 and 3 was quite large compared to that for sample 2. Also, the second sample of thin film had the largest mean MD tearing resistance value of 5758.916667mN, which was presented in position number 5 of the Figure 9, (Table 1). Finally, the second sample of thin film had the largest mean thickness value of 0.267495mm, which was presented in position number 8 of the Figure 9, (Table 1).
Figure 9:The descriptive statistics of the three mechanical properties, in the MD direction, tensile strength, tearing resistance, and thickness, of the three samples of plastic films.
The table in Figure 6 presented the results of Levene’s test regarding the equality of the population variances of the nine categorical weights (second application criterion of the ANOVA test). From that table we noticed that the test was statistically significant (Levene’s Statistic=35.203, p=0.000), which meant that there was no equality between the population variations of the nine categories of mechanical properties of Table 1. Therefore, the second performance criterion of the ANOVA test did not apply, however we proceeded with the interpretation of the table in Figure 10, which presented the results of the ANOVA test in question.
Figure 10:The results of the One-Way ANOVA test.

From the table in Figure 10 we noticed that the test was statistically significant (F (8,114) =905.319>1.83 and p<0.001). Consequently, at least two of the nine mean values of the mechanical properties of the Table 1 differed. The categories or the values of the mechanical properties, between which differences were observed were determined by the multiple comparison Bonferroni test (post hoc test) that followed in Figure 11.
Figure 11:The results of the multiple comparisons test Bonferroni of the mechanical properties of the Table 1.
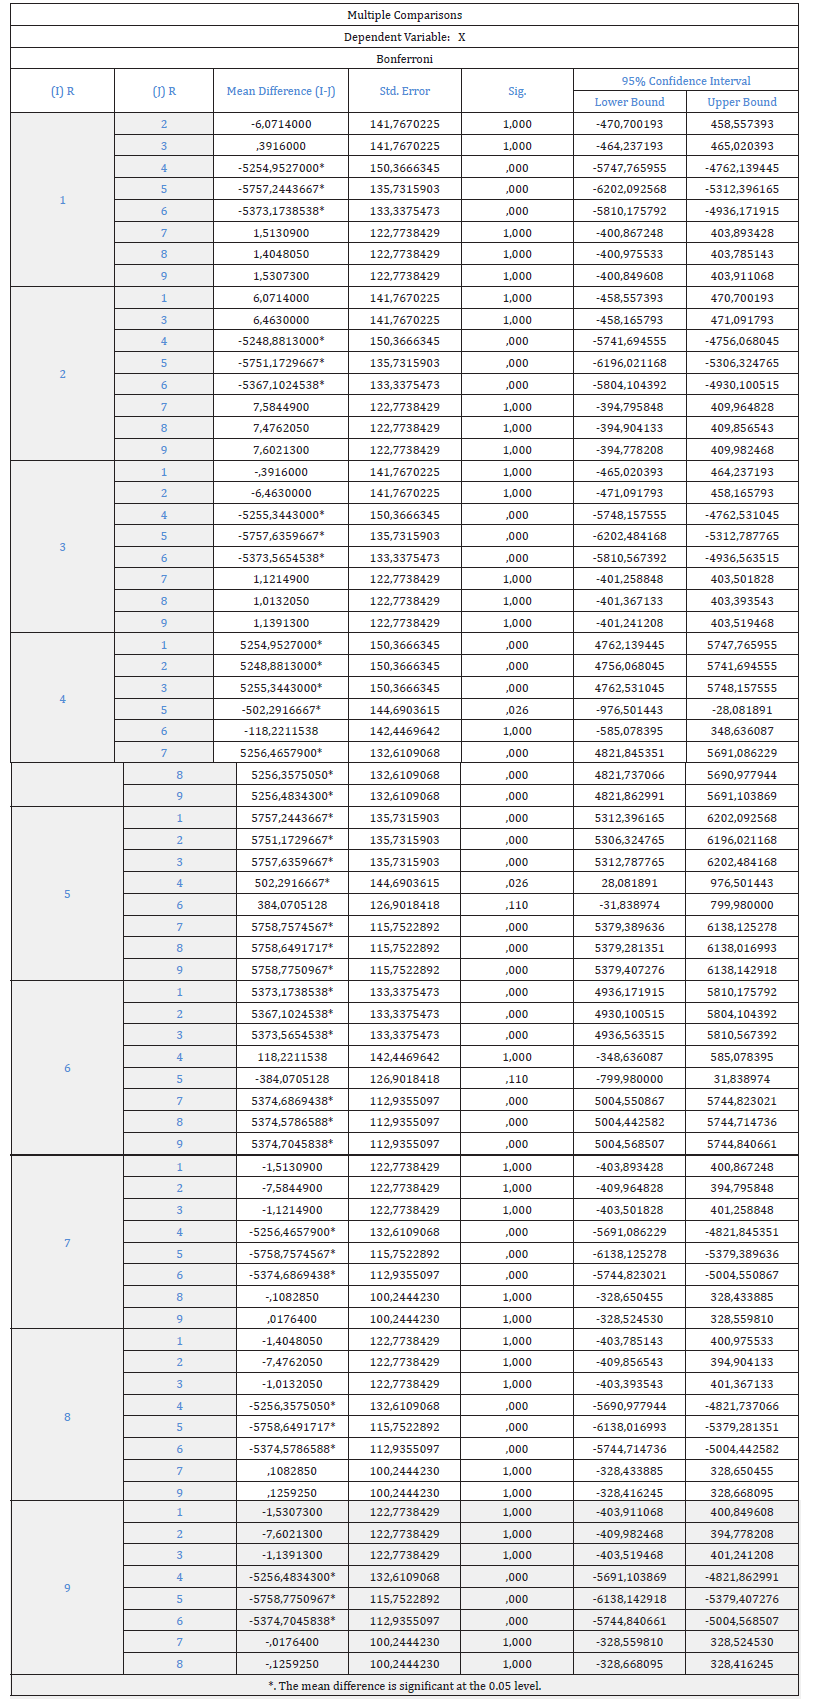
In order to determine among which of these categories there were differences, the Bonferroni test [20], Figure 11 & Table 1 was performed, from which the following results emerged. Significant differences were observed between the first category of the tensile strength MD 1, in terms of the mean value and i) the fourth category of tear strength MD 1 (p=0.000<0.001), ii) the fifth category of tear strength MD 2 (p<0.001) iii) the sixth category of tear strength MD 3 (p<0.001) (Table 1, Figure 11). Significant differences were observed between the second category of the tensile strength MD 2, in terms of the mean value and i) the fourth category of tear strength MD 1 (p<0.001), ii) the fifth category of tear strength MD 2 (p<0.001) iii) the sixth category of tear strength MD 3 (p<0.001) (Table 1, Figure 11). Significant differences were observed between the third category of the tensile strength MD 3, in terms of the mean value and i) the fourth category of the tear strength MD 1 (p<0.001), ii) the fifth category of tear strength MD 2 (p<0.001) (Table 1), iii) the sixth category of tear strength MD 3 (p<0.001) (Table 1, Figure 11). Significant differences were observed between the fourth category of the tearing resistance MD 1, in terms of the mean value and i) the first category of the tensile strength MD 1 (p<0.001) ii) the second category of the tensile strength MD 2 (p<0.001) (Table 1), iii) the third category of the tensile strength MD 3 (p<0.001) (Table 1), iv) the seventh category of the thickness 1 (p<0.001) (Table 1) v) the eighth category of the thickness 2 (p<0.001) (Table 1) vi) the ninth category of the thickness 3 (p<0.001) (Table 1). Significant differences were observed between the fifth category of the tearing resistance MD 2 in terms of the mean value and the i) first category of the tensile strength MD 1 and the ii) second and the iii)third category of the tensile strength MD2, and MD3 (p=0.000<0.001) (Table 1), and iv)the seventh and v)the eighth and vi)the ninth category of the thickness value 1, 2, and 3, (p<0.000<0.001) (Table 1), and the same applied to the sixth category of the tearing resistance MD3. Significant differences were observed between the seventh category of the thickness value of sample 1 and the fourth, fifth and sixth category of the tearing resistance of samples 1, 2, and 3 (Table 1). The same occurred for the eighth and the ninth category of the thickness values of samples 2, and 3 (Table 1) and the fourth, fifth and sixth category of the tearing resistance of samples 1, 2, and 3 (p=0.000<0.001) (Table 1, Figure 11).
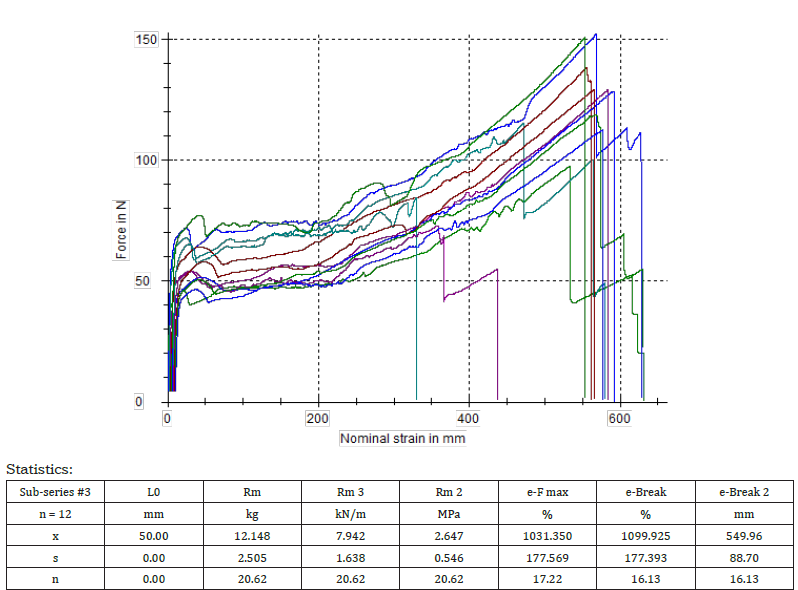
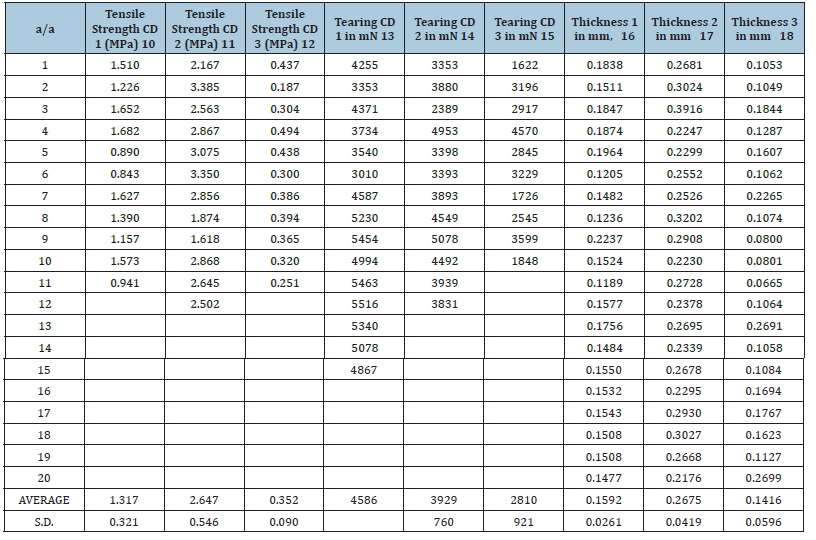
The tensile strength across the counter machine direction (CD) in MPa (Figure 12 & Figure 13), the tearing resistance across the CD direction in mN, and the thickness in mm, of the three different paper wrapping plastic films were determined. The data were compiled in Table 2.
Figure 12:Tensile force curves in Newton versus strain in mm, for the twelve specimens of the second paper wrapping plastic film tested in the counter machine direction (CD) and the relevant statistics. The initial grip to grip separation was set at 50mm (Table 2).
Statistics:
Figure 13:Tensile force curves in Newton versus strain in mm, for the eleven specimens of the third paper wrapping plastic film tested in the counter machine direction (CD) and the relevant statistics (Table 2). The initial grip to grip separation was set at 180mm.
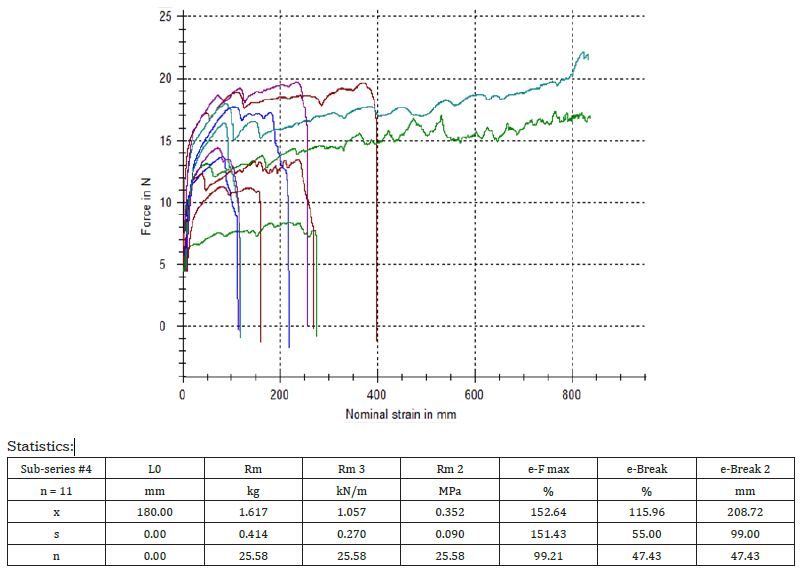
Table 2:CD Tensile strength in MPa, CD Tearing Resistance in mN, and Thickness in mm, of three samples of paper wrapping plastic film.
Because the number of observations in Table 2 was less than 50 the Shapiro-Wilk Test [19] was used for checking normality of the Table 2 data, of the three CD tensile strength variables, against the Kolmogorov-Smirnov test.
Because the p-value from the Shapiro-Wilk test [5] (Figure 14), as for the parameter CD tensile strength, was greater than 0.05 for the sample 1, and for the sample 2, and for the sample 3, it was suggested that the null hypothesis of normality could not be rejected for the three samples and that their data was normal.
Figure 14:The results of the Shapiro-Wilk test for the three CD direction tensile strength variables for the three samples of plastic films.

Because the number of observations in Table 2 was less than 50 the Shapiro-Wilk Test was used for checking normality of the Table 2 data, of the three CD direction tearing resistance variables, against the Kolmogorov-Smirnov test.
Because the p-values from the Shapiro-Wilk test (Figure 15), as for the parameter CD tearing resistance, were greater than 0.05 for the samples 1 and 2 and 3, it suggested that the null hypothesis of normality could not be rejected for these three samples. For this reason, their correlation would not be carried out with the non-parametric Spearman correlation test. For samples 1, 2, 3 the p-value from the Shapiro-Wilk test was greater than 0.05 and the data was normal [5]. So, then we proceeded with the application of One-Way ANOVA test, for the populations of the groups of Table 2 and in the interpretation of its results.
Figure 15:The results of the Shapiro-Wilk test for the three CD direction tearing resistance variables for the three samples of plastic films.

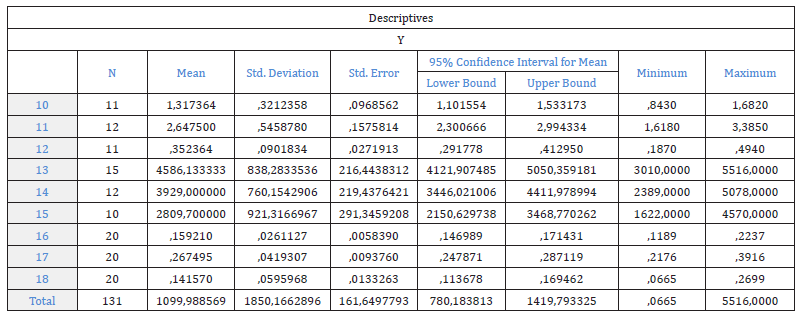
From Figure 16 we observed that the second sample of thin film had the largest mean CD tensile strength value of 2.6475MPa, which was presented in position number 11 of the Figure 16, Table 2 and immediately smaller average value of 1.317364MPa appeared for the first sample of thin film, placed in position 10 and the third sample followed with 0.352364MPa mean CD tensile strength value which was presented in position 12 of the Figure 16, Table 2. The difference between the mean CD tensile strength value of the thin film sample 3 was quite large compared to that for sample 2 and sample 1 (Table 2). Also, the first sample of thin film had the largest mean CD tearing resistance value of 4586.133333mN, which was presented in position number 13 of the Figure 16, Table 2. Finally, the second sample of thin film had the largest mean thickness value of 0.267495mm, which was presented in position number 17 of the Figure 16, (Table 2).
Figure 16:The descriptive statistics of the three mechanical properties, in the CD direction, tensile strength, tearing resistance, and thickness, of the three samples of plastic films.
The table in Figure 17 presented the results of Levene’s test regarding the equality of the population variances of the nine categorical weights (second application criterion of the ANOVA test) (Table 2). From that table we noticed that the test was statistically significant (Levene’s Statistic=22.562, p=0.000), which meant that there was no equality between the population variations of the nine categories of mechanical properties of Table 2. Therefore, the second performance criterion of the ANOVA test did not apply, however we proceeded with the interpretation of the table in Figure 18, which presented the results of the ANOVA test in question.
Figure 17:Equality of variances check.

Figure 18:The results of the One-Way ANOVA test for the data of table 2.

From the table in Figure 18 we noticed that the test was statistically significant (F (8,122) =269.487>1.83 and p<0.001), consequently, at least two of the nine mean values of the mechanical properties of the table 2 differed [21].
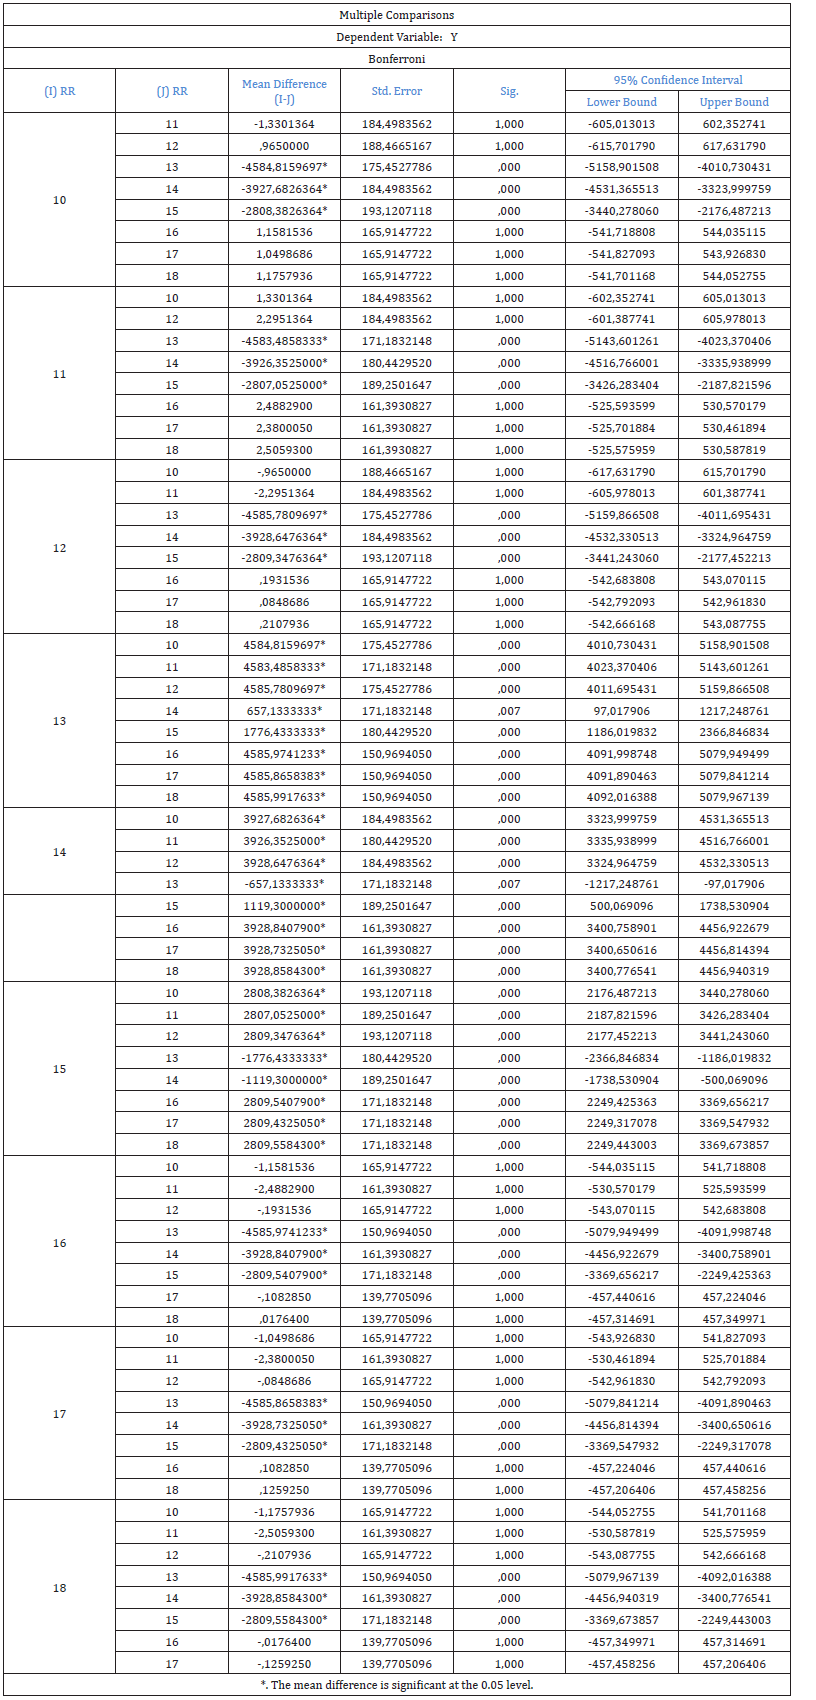
Significant differences were observed, in terms of the mean value, between the tenth category of the tensile strength CD 1 and the thirteenth category of the tearing resistance CD1 (Figure 19, Table 2), (p= 0.000<0.001) and the fourteenth category, and the fifteenth category of the tearing resistance CD2 and CD3 (Table 2) (p<0.000<0.001). Significant differences were also observed in terms of the mean value, between the thirteenth category of the tearing CD1 (Figure 19, Table 2) and the tenth, eleventh, twelfth, fifteenth, sixteenth, seventeenth, and eighteenth category of Table 2 (Figure 19), with the exception of the fourteenth category of the tearing resistance CD2 because p=0.007>0.001 (Figure 19, Table 2). Similar observations may have been made for the other categories in Figure 19 (Table 2).
Figure 19:The results of the multiple comparisons test Bonferroni of the mechanical properties of Table 2 concerning the CD direction tensile properties, and the thickness, of the three samples of paper wrapping plastic films.
Conclusion
The mechanical properties of three paper wrapping plastic thin films were subjected to statistical tests which concerned namely their tensile strength, their tearing resistance and their thickness. The Shapiro-Wilk test was used for checking normality since our observations were less than 50. The MD tensile strength data for samples 2 and 3 were found normal. Sample’s 1 MD tensile strength had a weak negative linear correlation with sample’s 3 MD tensile strength. The MD tearing resistance data for all three plastic films was found normal. Plastic film’s 1 thickness data was found normal, and plastic film’s 2 thickness had a very weak negative linear correlation with the thickness of sample 3. Levene’s statistic for the MD mechanical properties was found statistically significant and there was no equality between the population variations of the data of the MD mechanical properties in Table 1. The result of the One way ANOVA test showed that at least two of the nine mean values of the data of Table 1 differed. The Bonferroni test showed significant differences, in terms of the mean values, between the nine categories of Table 1. The same statistical tests were performed on the same mechanical properties in the counter-machine direction (CD) of the three plastic films. The One-way ANOVA test showed again differences in the mechanical properties tested increasing awareness in materials used in paper transport, as it is the thin plastic films. The Bonferroni test pointed out the differences between the nine categories 10 to 18 of the CD mechanical properties in Table 2. Anisotropy (significant directional dependency) was observed on the mechanical properties, tensile strength and tearing resistance of plastic films 2 and 3, as well as for their thickness, while in plastic film 1 isotropy has been detected. Inconsistencies in the mechanical properties might arise depending on the location along the length of the sheet of the plastic film. Thus, an orientation dependent hardening law could also be proposed which causes the plastic hardening behavior to be orientation dependent, and scale with elastic anisotropy [22]. The significant differences found in the mechanical properties among the three plastic materials tested in this work should suggest that improvements may be needed in plastic film design, used to protect paper rolls being transported, to better mimic paper.
References
- Elias H Arias-Nava, Delia J Valles-Rosales, Patrick Sullivan B (2023) Biopolymer non-parametric analysis: A degradation study under accelerated destructive tests. Polymers 15(620): 1-14.
- Christine Miller Buffinton, Kelly J Tong, Roberta A Blaho, Elise M Buffinton, Donna M Ebenstein (2015) Comparison of mechanical testing methods for biomaterials: Pipette aspiration, nanoindentation, and macroscale testing. J Mech Behav Biomed Mater 51: 367-379.
- Damirson A Co, Lourd Albert T Banaga, Daniel Marco M Dela Concha, Darcy C Mariano, Charlton Lance S Reyes (2023) The Garden Battle: A Comparative study on the tensile properties between Corn-Based and Cassava-based Bioplastics, IEOM Society International, pp. 2150-2162.
- Norbert Abramczyk, Sebastian Drewing, Katarzyna Panasiuk, Daria Zuk (2022) Application of statistical methods to accurately assess the effect of gamma alumium oxide nanopowder on the hardness of composite materials with polyester-glass recyclate. Materials 15(5957): 1-11.
- Dudley R (2012) The Shapiro-Wilk test for normality. MIT 18(465): 1-7.
- Rebekic A, Loncaric Z, Petrovic S, Maric S (2015) Pearson’s or Spearman’s correlation coefficient-which one to use? Poljoprivreda 21(2): 47-54.
- Solomon O Obadimu, Anirudh Kasha, Kyriakos I Kourousis (2022) Tensile performance and plastic anisotropy of material extrusion steal 316L: Influence of primary manufacturing parameters. Additive Manufacturing 60(Part B): 103297.
- Abdi Herve (2007) The Bonferroni and Sidak corrections for multiple comparisons. Encyclopedia of measurement and statistics.
- Mark E Glickman, Sowmya R Rao, Mark R Schultz (2014) False discovery rate control is a recommended alternative to Bonferroni-type adjustments in health studies. J Clin Epidemiol 67(8): 850-857.
- Miguel A Garcia-Perez (2023) Use and misuse of corrections for multiple testing. Methods Psychol 8: 100120.
- ISO 187 (2022) Paper, board and pulps-standard atmosphere for conditioning and testing and procedure for monitoring the atmosphere and conditioning of samples, (3rd edn), pp.1-7.
- ASTM D 882-10 (2010) Standard test method for tensile properties of thin plastic sheeting, pp.1-8.
- ISO 534 (2011) Paper and board-Determination of thickness, density, and specific volume. International Standard, pp.1-13.
- ISO 1974 (2012) Paper-Determination of tearing resistance-Elmendorf method. International Standard, pp.1-13.
- William D Nix (1997) Elastic and plastic properties of thin films on substrates: Nanoindentation techniques. Mater Sci Eng: A 234-236: 37-44.
- Sandeep Tamrakar, Roberto A Lopez-Anido (2010) Effect of strain rate on flexural properties of wood plastic composite sheet pile. For Prod J 60(5): 465-472.
- Philip Sedgwick (2014) Spearman’s rank correlation coefficient. BMJ 349: g7327.
- Palmer A Richard, Strobeck Curtis (2003) CH 17 Fluctuating asymmetry analyses revisited. Developmental Instability: Causes and Consequences, pp. 279-319.
- Shapiro SS, Wilk MB (1965) An analysis of variance test for normality (complete samples). Biometrica 52(3-4): 591-611.
- Burt S Holland, M Di Ponzio Copenhaver (1988) Improved Bonferroni-Type multiple testing procedures. Psychol Bull 104(1): 145-149.
- Tremblay D, Zigras T, Cartier R, Louis Leduc, Butany J, et al. (2009) A comparison of mechanical properties of materials used in aortic arch reconstruction. Ann Thorac Surg 88(5): 1484-1491.
- Wikstrom A, Nygards M (2002) Anisotropy and texture in thin copper films-an elasto-plastic analysis. Acta Mater 50(4): 857-870.
© 2025 Katerina Chryssou. This is an open access article distributed under the terms of the Creative Commons Attribution License , which permits unrestricted use, distribution, and build upon your work non-commercially.
 a Creative Commons Attribution 4.0 International License. Based on a work at www.crimsonpublishers.com.
Best viewed in


.jpg)


 Editorial Board Registrations
 Submit your Article
 Refer a Friend
 Advertise With Us
.jpg)


.jpg)


.bmp)
.jpg)
.png)
.jpg)


.jpg)


.png)

.png)


.png)


