
- About Us
- Information
-

The Author ensures that the research has been conducted responsibly and ethically with adherence to all relevant regulations. read more..
- For Authors
- For Reviewer
- Manuscript Guidelines
- Membership
- Publication Ethics
-
- Journals
- Reprints
- e-Books
- Videos
- Policies
- Contact Us
 COVID-19
- Submissions


Full Text
Annals of Chemical Science Research
Analysis of 100gsm A4 Copy Paper Sample and the X-Ray Diffraction Pattern of its Ash Content on Ignition at 900 °C and at 525 °C and Some of its Mechanical, Structural and Optical Properties
Katerina Chryssou* and Eugenia Lampi
General Chemical State Laboratory, B’ Chemical Division of Athens, Department A’ Tsocha 16, 11521 Athens, Greece
*Corresponding author:Katerina Chryssou, General Chemical State Laboratory, B’ Chemical Division of Athens, Department A’ Tsocha 16, 11521 Athens, Greece
Submission: July 10, 2023;Published: July 25, 2023

Volume4 Issue2July , 2023
Abstract
The residue on ignition at 900 °C of the copy paper sample Multipaper Fabriano 100g/m2 was determined to be 12.96%w/w and its XRD pattern showed the presence of lime, syn CaO, peaks placed at 2θ values of 32o, 37o, 37o, 38o, 48o, 54o, 64o, 67o, 67o, 80o, 89o, 92o, 103o, 107o which corresponded to crystal planes of 111, 002, 211, 220, 221, 311, 311, 400, 411, 420, 422 and 500. The high values of tensile force, made of 100% chemical pulp of 4.91KN/m in the machine direction and of 3.28KN/m in the cross direction of the paper sample correlated with an alkaline pH value of 8.8 and a low value of residue on ignition. Also, the average low roughness Bendtsen of the paper of 64ml/min related with the low pick resistance measured to be 1.18m/s in the machine direction and 0.19m/s in the cross direction. The residue on ignition, of the same copy paper sample, at 525 °C was also determined to be 22.8%w/w and calcite, magnesian, gallium iron sulfide was identified from their XRD pattern. The band gap energy Eg from the diffuse reflection spectroscopy study of the 100gsm A4 copy paper sample was calculated to be 1.1654879939663700eV at room temperature. The crystallographic phase of the residue on ignition at 900 °C was determined by X-Ray diffraction (XRD) and the powder diffraction pattern of CaO was indexed by trial and error and all of the peaks were assigned their hkl values. The Miller indices of the reflections were determined and also the separation of planes. The average crystallite size τ of the pattern of CaO was determined to be on average below 60nm, by using the Scherrer equation. A graphical representation of the line broadening of the diffraction peaks as a function of the crystallite size was also presented. The peak broadening factor β which was equal to FWHM of the reflections of the sample was related to the micro-strain ε and a graph was plotted and from its intercept the lattice strain was calculated to be 4.719727188044x10⁻⁴rad.
Keywords: Residue on ignition at 900 °C; Residue on ignition at 525 °C; XRD pattern; Lime; Magnesian; Full width at half maximum (FWHM); Reflectance spectrum; Tauc plot; Band gap energy
Introduction
Paper contains, apart from cellulose, in small proportions resins, gum, proteins and minerals from wood. The minerals are mainly silicon, chlorides, sulphur, phosphates, carbonates, iron and magnesium oxides, calcium, potassium and sodium salts. There are several minerals used in paper filling and coating such as kaolin clay, calcium carbonate, titanium dioxide and talc, for improving paper properties [1,2]. In order to produce good quality paper wood adhesives have to be utilized also [3]. Starting in the 1960s in Europe there has been a strong trend in the direction of calcium carbonate fillers [4]. Because the presence of calcium carbonate generally causes the pH of a papermaking system to remain above a value of 7, the term “alkaline papermaking” has been used. The higher extract pH of paper made under alkaline papermaking conditions has had a favorable side benefit, a much slower deterioration of the strength properties of paper upon storage, compared to paper made under acidic conditions with aluminum sulfate [4].
The identification of the species present in the ash on ignition of a A4 100gsm copy paper sample from its powder diffraction pattern is based upon the position of the lines in terms of 2θ and their relative intensities. The diffraction angle 2θ is determined by the spacing between a particular set of planes, with the aid of the Bragg equation [5]. This distance d is calculated from the known wavelength of the source and the measured angle. Line intensities depend upon the number and kind of atomic reflection centers that exist in each set of planes. Powder x-ray diffraction is one of the primary techniques used to examine the physic-chemical composition of unknown materials [6]. Materials are generally made up of atoms arranged in crystal microstructures. Minerals are crystalline inorganic solids possessing well-defined chemical composition [7].
The present work aims at presenting technical information about the crystal structure of the minerals present in a paper sample and its connection with its properties both mechanical and optical, as well structural. Paper is a complex composite material. Its structure characteristics as well as its surface influence its printability. The roughness among others is important for the absorption and the spreading of inks, and also determines the amount of coating of the paper sample [8]. The characterization of the paper surface is crucial for the understanding of light reflection and scattering that controls the level of gloss of the paper. The paper’s optical properties have a large impact on the print quality because the paper is visible between the printed area and defines also the background reflectance for the toner layer [9].
Materials and Methods
Instruments and materials
The pH value of the paper sample was determined using a Metrohm 716 DMS Titrino, Swiss made, pH-meter and corresponded to the equilibrium pH for 2g of the paper sample dispersed in 100ml of water at 25 °C (298K). The measurement was done in duplicate and the average value was reported. For the residue on ignition method the principle required weighing the paper sample pieces in two heat-resistant crucibles of 50ml capacity and igniting both of them at 900 °C in an oven. Also, in two other crucibles of 50ml capacity the paper sample pieces were ignited at 525 °C. The ash mass was determined, in both cases, by weighing the crucible after the paper sample had been ignited for 1 hour in the oven. The European reference test methods used to determine the ash content were ISO 2144 [10] and ISO 1762 [11] respectively. An oven Carbolite England, OAF 11/1 maximum temperature 1100 °C, was used to incinerate the paper sample test pieces inside the crusibles for both temperatures.
The A4 paper sample tested was conditioned in a standard atmosphere according to standard ISO 187 [12], at the temperature of 23 °C and relative humidity of 50%. The basic paper properties i.e., basis weight (ISO 536), thickness and density (ISO 534), moisture content (ISO 287) were determined according to standardized methods. A spectrophotometer CM-3630 was used for measuring the optical properties of the A4 100gsm copy paper sample, ISO brightness (ISO 2470), opacity and transparency (ISO 2471). It was a model BCMTS M Type 40605 with Touchscreen M software of the company Frank-PTI Germany. The reflectometer had a reference standard for its calibration. It had also a non-fluorescent calibration plate of ceramic, a non-fluorescent working standard, Konica Minolta, made in Japan, no20286101. It had a black cavity, made in Japan, for calibration of the low end of the photometric scale.
A digital precision micrometer TMI Model No 49-61-01-0002, S.N. 33421-01 with range 0-1.270mm, was used for measuring the thickness of the A4 copy paper sample. The tensile testing machine Zwick Roel was used for measuring the tensile strength of the paper sample. The machine extended the paper test pieces of dimensions 15mmx210mm at 20mm/min constant rate of elongation and measured the maximum tensile force. It had a strength force of 2.5KN. The machine had also a long-stroke extensometer placed directly on the paper test pieces for the measurement of their elongation. The machine was connected with a computer LG. Two clamps for holding the paper test pieces of 15mm width were used. The clamps grab the test pieces firmly along a straight line across the full width of the test pieces and adjusted the clamping force pneumatically. A guillotine IDEAL 1043 GS made in Germany was used for cutting the paper test pieces to dimensions of 15mmx210mm.
A conditioning chamber that was capable of providing and maintaining standard conditions of temperature and humidity, where the paper test pieces were pre-conditioned at 23 °C ± 2 °C and 30%r.h. ± 5%r.h. for 24hours and were conditioned at 23 °C ± 1 oC and 50%r.h. ± 2%r.h for 16hours. The paper samples were conditioned for 16 hours at 23 ± 1 °C temperature and 50% ± 2% relative humidity in accordance with the ISO 187 standard [12]. Weighing’s were carried out on an electronic balance Sartorius Basic plus, AG Göttingen Germany BP 221S, with maximum capacity 220g and accuracy to 0.1mg.
Pick velocity was determined according to ISO 3783 [13]. For measuring the picking or the pick velocity an IGT Global Standard Tester 1, with printing force 350N and printing velocity 4.00m/s, and a high-speed inking unit 4, software Version 3.01, consisting of 5 inking drums having contact with the top-roller, was used. Thus, the determination of the pick resistance IGT of the paper sample was calculated. The IGT pick test oil was of middle viscosity with number 404.004.020 and consisted of poly-isobutene’s. The tester had an aluminum disc 10mm wide with smooth edges, and a diameter of 65.0mm. A paper pack consisting of 6 layers of paper with a total thickness of 1.5mm was used. An ink pipette for applying an accurate quantity of pick-test oil to the inking device, having a volume of 2ml, was used. The distributing time of the ink was 15s and the inking time of the aluminum disc was 10s. The speed during inking time was 0.4m/s and the temperature was kept at 23.2 °C. The ink layer thus formed was 8μm thick. Also, a pick-start viewer was used to determine the starting point of pick. It had a light source providing grazing incident light to the paper test piece in order to observe pick velocity. Petroleum ether 60-80 °C of analytical reagent grade solvent was used to wet the cleaning rag, lint-free, which served as cleaning aid. A tank filled with water with a built-in thermometer which kept the ambient temperature near the printing device at 23 °C with an accuracy of 0.1 °C was used. Test prints were made in accordance with the ISO 3783 [13] standard.
The specular gloss was determined according to TAPPI T480 om-09, on a Glossmeter T480A Model Technidyne Corporation, New Albany, Indiana USA, S.N. 481313. Water absorptiveness was assessed as Cobb value 60s as per ISO 535. The surface roughness and porosity were determined using Bendtsen roughness and air permeability tester ([14], ISO 5636-2). More specifically the Bendtsen roughness [14] and air permeability were measured by a Messmer Buchel roughness and air permeance tester Bendtsen method model No.K513, TMI INC, TMI K513, S.N. 8008-01 with accessories. Τhe crystalline structures and phase identifications, of the CaO present and also of calcite, magnesian, gallium iron sulfides, in the ash contents of the paper sample, were investigated by a Rigaku Miniflex 300/600 Benchtop X-ray diffractometer using a CuKa radiation (λ=1.5418Å) with a current of 15mA and an anode voltage of 40kV.
Results and Discussion
Tensile Properties and other physical and optical properties of the A4 copy paper sample
A copy A4 paper Multi-paper Fabriano 100g/m2 was tested in this work which was not a common A4 copy paper 80gsm. The paper properties such as grammage, thickness, Bendtsen roughness, tensile strength, pick velocity IGT, were measured. The A4 copy paper sample 100gsm Multi-paper Fabriano had a tensile index 47.90 KN.m/Kg lengthwise (Machine Direction or MD) and 32.0 KN.m/Kg crosswise (Counter machine Direction or CD) (Table 1,2) [15]. The grammage of the A4 copy paper sample was 102.5g/sq.m [16]. The elongation at break of the dry A4 copy paper sample was 3.01% lengthwise (MD) and 6.29% crosswise (CD) (Figure 1 & 2). The copy paper sample had thus more paper fibers oriented in the machine direction (MD) than in the cross direction (CD) and was stronger in the machine direction in tension. The density of the 100gsm paper sample was calculated to be 0.9234g/cm3 and its specific volume was calculated to be 1.0829cm3/g [17].
Table 1:Tensile strength of the copy paper sample A4 in KN/m in the two directions of the paper MD and CD.

Table 2:Tensile strength of the copy paper sample A4 in MPa in the two directions of the paper MD and CD.

Figure 1:Tensile force of the dry A4 multi-paper fabriano 100gsm, copy paper sample strips along the machine direction (MD) as a function of the strain of its paper specimens.

Figure 2:Tensile force of the dry A4 multi-paper fabriano 100gsm, copy paper sample strips along the counter machine direction (CD) as a function of the strain of its paper specimens.

The thickness of the 100gsm copy paper sample was measured to be 0.1111mm or 111μm ± 5.5μm. The pick velocity IGT was determined to be 1.2m/s lengthwise in MD, and 0.2m/s crosswise in CD at 23 °C according to ISO 3783 [13]. The pick velocity was defined as the velocity at which picking started. The picking of paper was defined as the damage of the paper surface caused by the tensile force during the printing operation. Lower was the surface strength of the paper sample the lower was its pick velocity, as in this sample, whereas a pick velocity of around 2m/s would be more adequate. The pick resistance at 23 °C was then calculated to be P(23)=1.2*51.2/52.0=1.1815m/s in the MD direction and P(23)=0.2*51.2/ 52.0m/s in the CD direction, whereas the general relation applied P(23)= vp*VT/V23 ∗ and P(23) was the pick resistance at 23 °C in m/s, vp was the mean velocity at the point where pick began in m/s, VT was the viscosity of the pick test oil used at average temperature T=23.1 °C during the test in Pa.s, being 51.2Pa.s, and V23 was the viscosity of the pick-test oil at 23.0 °C in Pa.s, being 52.0Pa.s. The Bendtsen roughness of the paper was measured to be 67ml/min for side A upwards and 61ml/min for side A downwards. The pH value of the paper [18] was determined to be 8.8 at 20.2 °C (293.35K) and its ash content on ignition at 900 °C was found to be 12.96%w/w. The low pick resistance was related to this scale of roughness Bendtsen for this value of pH 8.8, below pH 9.0 and ash content on ignition below 13%w/w. The high value of lightness L* and ISO brightness, beside a positive value of colour coordinate a* and a negative value of colour coordinate b* revealed that the copy paper sample had a natural blue-red look (Table 3). The outdoor daylight CIE Whiteness D65/10o, UV adjusted was measured to be 165 whiteness units. The copy paper sample had thus a high whiteness and also had a high ISO brightness. The ISO brightness was defined as the diffuse reflectance of a thick stack of paper sheets i.e., 10 paper sheets, at the mean wavelength of about 457nm. The paper whiteness correlated with the lightness (L* value) and color (b* value). The measurement of each side of Bendtsen roughness revealed no difference in surface roughness between the two sides. The small Bendtsen roughness of 64ml/min on average, meant that the surface of the paper sample was very smooth.
Table 3:Surface, mechanical, and optical properties of A4 copy paper Multi-paper Fabriano 100gsm are given as mean value.

The high density of the paper sample may have resulted from the presence of fillers present in it and from the brought distribution of the fiber dimensions resulting in a good alignment of fibers and the web connectivity [18]. Despite high air permeability and high density, water absorptiveness, Cobb value, was average to high, meaning that less sizing agents were added in the paper’s production process. A low surface roughness coincided with a low value of specular gloss [19]. The ash content on ignition of the copy paper sample at 900 °C was determined to be 12.96%w/w, and the ash content on ignition of the copy paper sample at 525 °C was determined separately to be 22.8%w/w.
X-ray diffraction pattern of the ash content on ignition at 900 °C, of the copy paper Multi-paper Fabriano sample
The ash on ignition, of the paper sample Multi-paper Fabriano 100gsm, at 900 °C was determined to be 12.9%w/w (Figure 3 & 4). For diffraction studies the sample ash on ignition of 0.2779g was ground to a fine homogeneous powder and the phase of the species syn CaO, lime, from its powder diffraction pattern was based upon the position of the lines in terms of 2θ and their relative intensities. The wavelengths were: Target: Cu, the X-ray type: Ka, Ka1:1.54056(ang.), Ka2:1.54440(ang.), Kb:1.39220(ang.) and the Kalpha12 ratio: 0.4970 and the horizontal polarization was 0.500. The optical device had an incident mirror, the incident monochromator: Use, the receiving monochromator: fixed monochromator, the optics: slit conditions: Incident slit, receiving slit#1, Receiving#2. The Measurement had Measurement axis: 2Theta/Theta, Target: Cu and wavelength type: KAlpha(KAlpha1+KAlpha2). The X-ray diffraction pattern of the ash on ignition at 900 °C was lime syn CaO. The resulting X-ray powder diffraction data for syn CaO together with the observed 2θ, the d-spacings as well as the relative intensities of the reflections are given in Figure 7. The results of the XRD analysis confirmed the formation of CaO species of diameter less than 60nm in the ash on ignition at 900 °C of the copy paper sample tested.
Figure 3:XRD pattern of the ash on ignition at 900 °C of a 100g/m2 A4 copy paper sample Multi-paper Fabriano..

Figure 4:The XRD pattern of the ash on ignition at 525°C of the 100g/m2 A4 copy paper sample Multipaper Fabriano.

The ash on ignition, of the paper sample Multi-paper Fabriano 100gsm, at 525 °C was determined to be 22.78%w/w. For the diffraction studies the sample ash on ignition of 0.4860g was ground to a fine homogeneous powder. The identification of the species CaCO3 (calcite) in the presence of MgCO3 (magnesian) and GaS, FeS (gallium iron sulfide) also present (Figure 4) from its powder diffraction pattern was based upon the position of the lines in terms of 2θ and their relative intensities. Apart from calcite and magnesian it was possible to recognize a third phase gallium iron sulfide in the ash at 525 °C of the paper sample tested (Figure 5 & 6). XRD diagrams were taken for each ignition temperature separately [20]. The X-ray source was CuKa radiation with wavelength of λ=1.54Å. The sample i.e., ash on ignition at 900 °C, was scanned in step-scan mode in area between 3o and 110o2θ with step size of 0.02o2θ (Figure 6 & 7).
Figure 5:More detailed XRD pattern syn CaO, of the ash on ignition at 900 °C of a 100g/m2 copy paper sample.

Figure 6:Measurement conditions of the XRD pattern of the syn CaO (lime).

Figure 7:Peak list of the XRD pattern of syn CaO. The x-ray diffractogram of the ash on ignition of the paper sample at 900oC showed a single-phase lime CaO.

Figure 8:Scheme of chemical reaction of CaCO3 present in the paper sample to becoming CaO during ignition of the copy paper sample in the oven at 900 °C.

Crystallite size basic theory for the XRD pattern of syn CaO
The full width at half maximum (FWHM) of the reflection depended both on the diffractometer geometry and the setups such as the slits, the optics, the 2θ angle and the detector, also on the sample itself. For ideal conditions the standard powder diffractometer may have produced diffractograms with peak widths (FWHM) between 0.03o and 0.1o 2θ over the whole angular range. Here the peak width (FWHM) was between 0.110o and 0.286o 2θ. Τhe peak broadening caused by the sample, i.e., ash on ignition at 900 °C, could have been explained by the presence of very small crystallites and micro-strain.
Particle size calculation of the XRD phase CaO (lime)
For Rietveld refinement (WPPF) the background was calculated with a β-spline function. Β-spline was selected as the function expressing the background. The function β-spline used a smooth curve passing through the calculated points at the background level as the function expressing the background (Table 4).
Table 4:The grain size of CaO nanoparticles present in the ash on ignition at 900 °C of the copy paper sample.

The Crystallite size calculation, and micro-strain ε, related to peak broadening, for the XRD pattern of syn CaO (lime)
The Scherrer equation [21] described the relation between the broadening of the reflection and the average crystallite size τ, by the following relation:
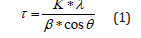
whereas β was the broadening of the reflection due to small crystallite sizes and was equal to FWHM of the reflection of the real sample, K was approximately 0.9 and λ was the wavelength and θ the diffraction angle.
Figure 9 described the line broadening effect given by decreasing crystallite sizes. Its influence was stronger than instrumental broadening for crystallite sizes which were much smaller than 1μm, as could be seen in Table 4 & 5. Figure 9 described the line broadening effect given by the crystallite sizes. The diffraction peak width may have been containing microstructural information.
Table 5:In Table 5 we represented the line width (o2θ) i.e., Int. W(deg) (Figure 7) along with the particle dimension as calculated in Table 4.

Figure 9:Line broadening as a function of the crystallite size.

In order to distinguish between broadening by strain and broadening by crystallite size the reflection profile was analyzed. It was calculated the product of β by cosθ, whereas β was the broadening of the reflection due to small crystallite sizes and was equal to FWHM of the reflection of the real sample and θ was the diffraction angle. Also, sinθ was calculated, and a graphical representation was constructed of sinθ versus βcosθ (Table 6).
Table 6:In table 6 we represented βcosθ whereas β was FWHM in radians (Table 4) along sinθ, whereas θ was the diffraction angle.

From the plot of structure β*cosθ on y axis against sinθ on x-axis (Figure 10 &11) we calculated the strain component from the slope which was -0.00213252rad. The negative strain component indicated that the micro strain was compressive. Also, from the plot of structure β*cosθ on y-axis against sinθ on x-axis we calculated the particle size component from the y intercept which was 0.004006175rad (Table 7).
Table 7:In Table 7 we represented β/4tanθ=ε i.e., the micro-strain, along β which was the FWHM of the reflection of the sample in radians.

Figure 10:By plotting structure β*cosθ on y axis against sinθ on x axis we obtained the different elastic properties, such as crystallite size and lattice strain.

Figure 11:The peak broadening β was related to micro-strain β/4tanθ=ε and the lattice strain was calculated to be 0.0004719727188044rad or 4.719727188044x10⁻⁴ rad from the intercept of the graph.

Estimation of the band gap energy Eg from the DRS study of the A4 copy paper sample
A graph was plotted of (K/S hv)2 versus hv. The extrapolation of the straight line to (K/S hv)2=0 axis (Tauc Plot) gave the value of the band gap energy Eg. The ISO brightness was measured to be 100.95%. Its opacity was 95.87% and transparency 11.82%. The K/S value according to equation (2)
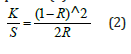
was calculated to be 49.47995295. Equation (2) was the Kubelka-Munk equation at any wavelength. It was applicable in the limiting case of an infinitely thick sample like a paper sheet, where thickness and sample holder have no influence on the value of reflectance (R) [22].
The band gap energy of the chromophores presents in the cellulose of the 100g/m2 A4 copy paper sample was estimated to be 1.1654879939663700eV for permitted indirect transitions, or 1.867111765E-19Joules, at room temperature (Figure 12). The band gap was estimated from the function trend in the excel spreadsheet with the data calculated for the whole range of wavelengths 400-705nm. A pH value of 8.80 led to an optical band gap value of 1.1654879939663700eV which was a pH lower than 9, or 10, but still resulting in the paper’s nanoparticle aggregation. The trend in the band gap was a decreasing energy band gap because of the presence of calcite CaCO3 and magnesian MgCO3 in the paper polymer matrix, compared to a previous band gap of 1.1697157220054000eV at a pH value of 9.6 [23], where only calcite was present. The concentration of ions specifically H+ and of OH- also affected the band gap of the paper sample towards a lower band gap. The indirect bandgap thus decreased when the pH lowered from 9.6 to 8.8 [24].
Figure 12:Kubelka-Munk transformed reflectance spectra of the A4 copy paper sample 100g/m2 Multi-paper Fabriano, consisting of 100% cellulose, for the calculation of band gap energy for permitted indirect transitions n=2.

General Indexing Method (trial and error) for the XRD pattern of syn CaO (lime)
The general indexing method was applied in this study whereas certain parameters were known, such as the wavelength of the radiation, the θ and 2θ values of the reflections from the experiment, the crystal system, the constants a, b, c, α, β, γ, of the crystalline material from the experiment or from the literature. The principle of the method was the determination of the values of the hkl indices of a reflection for which the squared difference of the experimental and theoretical value of a quantity became minimal, i.e.,
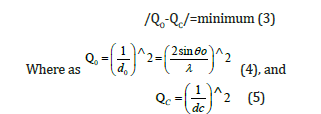
The quantity 1/dhkl was a quantity whose experimental value was given by Bragg’s equation by solving for 1/dhkl and raising it to the square, which was the quadratic form of the Bragg equation.
The procedure was to successively giving h,k,l, simple integer values (positive, or negative or 0), until the best possible agreement between the experimental value and the corresponding theoretical value was obtained. Thus, we determined the hkl indices of the reflections which corresponded to each specific θ. The crystal system of lime syn, CaO, identified by experiment was cubic. The space group was Fm3m with unit cell with a=b=c=4.81Å and the corners were α=β=γ=90ο and the wavelength was λ=1.5406Å.
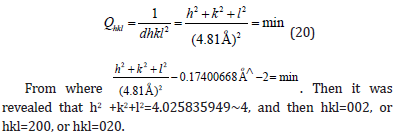
From the peak list in Figure 7, we read 2θ=32.1464o from the experiment. Then
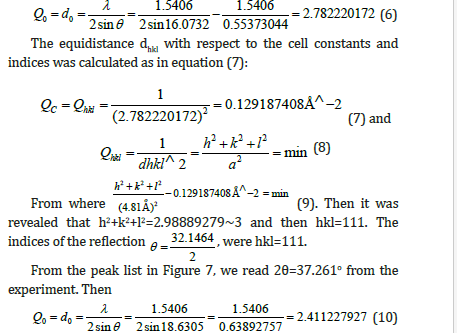
The equidistance dhkl with respect to the cell constants and indices was calculated as in equation (11):
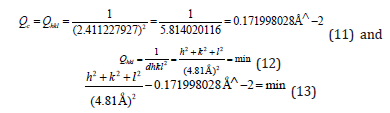
Then it was revealed that h2+k2+l2=3.979363576~4, and then hkl=002, or hkl=200, or hkl=020.
From the peak list in Figure 7, we read 2θ=37.343ο from the experiment. Then
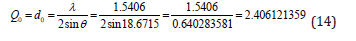
The equidistance dhkl with respect to the cell constants and indices was calculated as in equation (15):
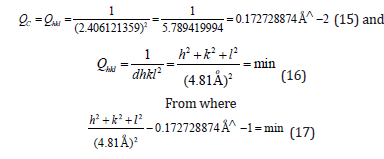
Then it was revealed that h2+k2+l2=3.996272502~4, and then hkl=002, or hkl=200, or hkl=020.
From the peak list in Figure 7, we read 2θ=37.486ο from the experiment. Then
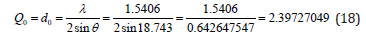
The equidistance dhkl with respect to the cell constants and indices was calculated as in equation (19):
Indexing process of powder diffraction pattern was done and Miller Indices (hkl) to each peak was assigned in first step. Indexing has been done in two different methods and data were in Table 8-10 [25]. In Table 9 we found a dividing constant and the values of the third column became approximately indegers. Here the constant was calculated to be 25.403(=102.057-76.654).
Table 8:X-ray powder diffraction data of the syn lime (CaO) with all the reflexions hkl.

Table 9:Simple peak indexing for the XRD pattern of syn CaO.

Table 10:Peak indexing from d-spacing for the XRD pattern of syn CaO.

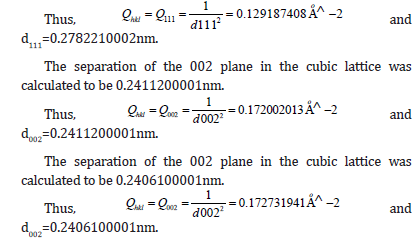
Four main peaks at 2θ values of 32.1464, 37.261, 37.486 and 53.8231 degrees corresponding to (111), (002), (002) and (220) planes of CaO were observed. In Table 10 we found a dividing constant and the values of the third column became approximately indegers. Here the constant was 42.815 (= 172.0020132-129.187).
The separation of planes in the cubic lattice of syn CaO.
The Miller indices were useful for expressing the separation of planes (Table 8). The separation of the 111 plane in the cubic lattice was calculated to be 0.2782210002nm.
XRD was applied to identify qualitatively the powder’s ash on ignition crystalline phases. A diffractogram was constructed by plotting the produced pattern to link the diffraction angle to the diffracted intensity. The CaCO3 present along with MgCO3, GaS and FeS in the copy paper sample and identified by XRD, improved the mechanical and the optical properties of the final product.
For the A4 copy paper sample 100gsm studied in this work it was of interest to carry out a study of the powder residue on ignition x-ray powder diffraction structure, among its other properties. The small bandgap of 1.1654879939663700eV of the copy paper sample could classify the material as semiconductor which contained four types of cations of Ca, Mg, Ga, Fe and anion S [26].
Conclusion
This study reported the presence of CaO present in the residue on ignition of a copy paper sample at a temperature of 900 °C for one hour time. The presence also of CaCO3, MgCO3, GaS and FeS was also revealed in the residue on ignition of the same copy paper sample, but at a temperature of 525 °C for also a one-hour time. The mineralogical changes that had occurred in the ashes on ignition, of the paper sample, as a function of temperature, were identified by X-Ray Diffraction (XRD). Calcite (CaCO3) was decomposed at 900 °C to CaO. A higher particle size of 53.5nm in the phase of CaO coincided with a lower band gap value of the paper material studied. Finally, XRD data could provide useful information and also helped correlate microscopic observations with the bulk sample such as copy paper.
Acknowledgements
The authors thank management of R&D, Neuland laboratories Private Limited for encouraging this review article.
References
- Mahendra Patel (2009) Minerals in paper manufacturing, Micro and Nanotechnology in Paper Manufacturing, ISBN No. 978-81-923542-2-4.
- Hazwan Hussin M, Nur Hanis Abd Latif, Tuan Sherwyn Hamidon, Nor Najhan Idris, Rokiah Hashim, et al. (2022) Latest advancements in high performance bio-based wood adhesives: A critical review. J Mater Res Technol 21: 3909-3946.
- Wayne M Bundy, Joseph N Ishley (1991) Kaolin in paper filling and coating. Appl Clay Sci 5(5-6): 397-420.
- Hubbe MA, Gill RA (2016) Fillers for paper making: A review of their properties, usage practices and their mechanistic role. BioRes 11(1): 2886-2963.
- Delphine D LePevelen (2010) Small molecule x-ray crystallography, theory and workflow. Encyclopedia of Spectrometry (Second edition), pp. 2559-2576.
- Theivasanthi T, Alagar M (2010) X-Ray diffraction studies of copper nano-powder. ArXiv:1003.6068 [physics.gen-ph], pp. 1-6.
- Asif Ali, Yi Wai Chiang, Rafael M Santos (2022) X-ray diffraction techniques for mineral characterization: A review for engineers of the fundamentals, applications, and research directions. Minerals 12(2): 1-25.
- Pierre Vernhes, Jean-Francis Bloch, Christophe Mercier, Anne Blayo, Bernard Pineaux (2008) Statistical analysis of paper surface microstructure: A multi-scale approach. Appl Surf Sci 254(22): 7431-7437.
- Guichun Hu, Shiyu Fu, Fuqing Chu, Maohai Lin (2017) Relationship between paper whiteness and color reproduction in inkjet printing. Bioresources 12(3): 4854-4866.
- ISO 2144 (2019) Paper, board, pulps and cellulose nanomaterials-Determination of residue (ash content) on ignition at 900 °C, pp. 1-10.
- ISO 1762 (2019) Paper, board, pulps and cellulose nanomaterials-Determination of residue (ash content) on ignition at 525 °C, pp. 1-9.
- ISO 187 (2022) Paper, board and pulps-Standard atmosphere for conditioning and testing and procedure for monitoring the atmosphere and conditioning of samples, pp. 1-7.
- ISO 3783 (2006) Paper and board-Determination of resistance to picking-Accelerated speed method using the IGT-type tester (electric model), pp. 1-12.
- ISO 8791-2 (2013) Paper and board-Determination of roughness/smoothness (air leak methods)-Part 2: Bendtsen method, pp. 1-16.
- ISO 1924-2 (2008) Paper and board-Determination of tensile properties-Part 2: Constant rate of elongation method (20mm/min), pp. 1-12.
- ISO 536 (2019) Paper and board-Determination of grammage, pp. 1-8.
- ISO 534 (2011) Paper and board-Determination of thickness, density and specific volume, pp. 1-13.
- ISO 6588-1 (2021) Paper, board and pulps-Determination of pH of aqueous extracts-Part 1: Cold extraction, pp. 1-7.
- Lavric Gregor, Plesa Tanja, Mendizza Ana, Ropret Marusa, Karlovits Igor, et al. (2018) Printability characteristics of paper made from a Japanese knotweed, pp. 99-102.
- Stergiou A, Kerasiotis I, Stergiou C (2007) Crystallographic study of mixture Ba6Nd0.4CuOy, in the range of annealing temperatures 860-910 °C. J Optoelectron Adv Mater 9(9): 2799-2803.
- Ahmad Monshi, Mohammad Reza Foroughi, Mohammad Reza Monshi (2012) Modified Scherrer equation to estimate more accurately nano-crystallite size using XRD. World J Nano Sci Eng 2: 154-160.
- Escobedo Morales A, Sanchez Mora E, Pal U (2007) Use of diffuse reflectance spectroscopy for optical characterization of un-supported nanostructures. Rev Mex Fis S 53(5): 18-22.
- Chryssou K, Lampi E (2023) The X-Ray diffraction pattern of the ash content on ignition at 900 °C of a copy paper sample and its mechanical and optical properties. Ann Chem Sci Res 3(4): 1-9.
- Gherbi Bachir, Salah Eddine Laouini, Souhaila Meneceur, Abderrhmane Bouafia, Hadia Hemmami, et al. (2022) Effect of pH value on the bandgap energy and particles size for biosynthesis of ZnO nanoparticles: Efficiency for photocatalytic adsorption of methyl orange. Sustainability 14(11300): 1-14.
- Amargeetha A, Velavan S (2018) X-ray diffraction (XRD) and energy dispersive spectroscopy (EDS) analysis of silver nanoparticles synthesized from erythrina indica flowers. Nanosci Technol 5(1): 1-5.
- Delgado GE, Sagredo V (2019) Synthesis and crystal structure of the quaternary semiconductor Cu2NiGeS4, a new stannite-type compound. Rev Mex Fis 65: 355-359.
© 2023 Katerina Chryssou. This is an open access article distributed under the terms of the Creative Commons Attribution License , which permits unrestricted use, distribution, and build upon your work non-commercially.
Editor In Chief


.jpg)


Signup for Newsletter

Quick Links
 Editorial Board Registrations
 Submit your Article
 Refer a Friend
 Advertise With Us
Our Recent Edition

.jpg)


Top Editors


.jpg)


.bmp)
.jpg)
.png)
.jpg)


.jpg)


.png)

.png)


.png)


Financial Support

Sponsors

Latest e-Books

Latest Video

 a Creative Commons Attribution 4.0 International License. Based on a work at www.crimsonpublishers.com.
Best viewed in
a Creative Commons Attribution 4.0 International License. Based on a work at www.crimsonpublishers.com.
Best viewed in