
- About Us
- Information
-

The Author ensures that the research has been conducted responsibly and ethically with adherence to all relevant regulations. read more..
- For Authors
- For Reviewer
- Manuscript Guidelines
- Membership
- Publication Ethics
-
- Journals
- Reprints
- e-Books
- Videos
- Policies
- Contact Us
 COVID-19
- Submissions


Full Text
Annals of Chemical Science Research
The X-Ray Diffraction Pattern of the Ash Content on Ignition at 900 ˚C of a Copy Paper Sample and its Mechanical and Optical Properties
Katerina Chryssou* and Eugenia Lampi
General Chemical State Laboratory, B’ Chemical Service of Athens, An. Tsocha 16, 11521 Athens, Greece
*Corresponding author:Katerina Chryssou, General Chemical State Laboratory, B’ Chemical Service of Athens, An. Tsocha 16, 11521 Athens, Greece
Submission: January 17, 2023;Published: February 02, 2023

Volume3 Issue4February 02, 2023
Abstract
The ash on ignition at 900 ˚C of a A4 copy paper sample UPM New Future Multi was determined to be 15.4%w/w and its X-ray diffraction pattern showed the presence of only portlandite syn Ca(OH)2 peaks placed at 2θ values of 18o, 29o, 34o, 46o, 47o, 51o, 54o, 63o, 72o which corresponded to crystal planes of 111, 110, 112. The high tensile force value of 4.5KN/m of the dry A4 copy paper sample correlated well with its high pH value of 9.6 and high ash on ignition content of 15.4%w/w. Along with them the roughness Bendtsen of the paper was found in a scale which related well with its pick resistance measured to be 1.96m/s in the machine direction and 0.39m/s in the counter direction. The band gap energy Eg from the Diffuse Reflection Spectroscopy (DRS) study of the A4 copy paper sample was calculated to be 1.169715722005400000000000eV. The absorption coefficient α(ν) near the edges was calculated to be 4.27185997cm-1 and the band gap was obtained by intercepting the linear fitted line in the plot of (αhv)^2 versus hv. The X-Ray powder diffraction pattern of portlandite was indexed by trial and error, and some peaks were assigned their hkl values. Finally, the Miller indices of the reflections were determined as well as the separation of planes. The separation of the 111 plane in the rhombohedral lattice was calculated to be 0.2984038nm. The separation of the 110 plane in the rhombohedral lattice was calculated to be 0.423379nm and of the 112 plane was 0.2205806429nm.
Keywords: Ash on ignition at 900 ˚C; X-ray diffraction pattern; Copy paper; Tensile force; Band gap energy; Tauc plot; Portlandite
Introduction
Paper is a multi-scale material and its structure as well as its surface properties influence its printability. The determination of the percentage of inorganic components is used as a control of the overall quality of a photocopy paper. The 900 ˚C ignition process can be used as a preliminary step when determining specific metal components [1]. The amount of residue on ignition can be related to the metal content of a sample of copier paper. Generally, for coated papers and products with fillers, the amount of metallic constituents could be calculated from the loss on ignition at 900 ˚C. This ash value varies from pigment to pigment and also between different batches of the same pigment. The metallic components could be calcium carbonate [2], silica, silica salts, as well as metallic particles.
Also, the roughness Bendtsen [3] of the paper is primordial for the absorption and the spreading of inks, and also for determining the amount of coating. Relation could be considered as to the scale of roughness to properties of paper such as gloss and pick resistance [4,5]. The effect of the pH value could be examined as to its influence on the optical and morphological properties of a copy paper sample. The cellulose chains are functionalized with oxygen containing surface groups which are able to control and stabilize phases and structures during paper making. The effect of pH on the optical band gap of the copy paper sample will be examined since the morphology of the paper significantly depends on the amount of H+ or OH- ions present on its surface. The pH value influences the optical properties of paper, such as brightness, gloss and opacity.
The X-ray powder diffraction pattern of a component present in the paper sample with broadened lines can be indicative of the presence of nano-size particles [6,7]. Nanoparticles usually speak of particles with a size up to 100nm with increasing in surface to volume ratio, providing active surface atoms to improve the properties of the materials tested [8].
Materials and Methods
Instruments and materials
The principle of the ash on ignition method required weighing the paper sample in a heat-resistant crucible 50ml capacity, and then igniting the paper at 900 °C ± 25 °C, in an oven. The ash mass was determined by weighing the crucible after the paper sample had been ignited for 1 hour at 900 °C ± 25 °C in an oven. The European reference test method used to determine the ash content was ISO 2144 [9]. An oven carbolite England, OAF 11/1 maximum temperature 1100 ˚C, was used to incinerate the paper sample inside the crucibles.
A spectrophotometer CM-3630 was used for the measurement of the optical properties of the paper sample. It was a model BCMTS M Type 40605 with Touchscreen M software of the company Frank- PTI Germany. The keyboard was a Logitech K120, the monitor screen was Hans G, the mouse was Logitech RX250, and the printer was HP Laser Jet P1102. The reflectometer had reference standards for its calibration, and also a non-fluorescent calibration plate of ceramic, a non-fluorescent working standard, Konica Minolta, made in Japan, no20286101. It was also accompanied by a black cavity, made in Japan, for calibration of the low end of the photometric scale. The reference standards, the non-fluorescent working standard, and the black cavity were stored in a black box with a protective cover so they were in a dust-free environment.
The thickness of the copy paper sample was measured using a digital precision micrometer TMI Model No 49-61-01-0002, S.N. 33421-01 with range 0-1.270mm. A tensile testing machine Zwick Roel was used which extended the paper test pieces of dimensions 15mmx210mm at 20mm/min constant rate of elongation and measured the maximum tensile force. It had a strength force of 2.5KN. The machine had a long stroke extensometer placed directly on the paper test piece for the measurement of its elongation. The machine was connected with a computer LG and included two clamps for holding the paper test piece of 15mm width. The clamps grab the test pieces firmly along a straight line across the full width of the test piece and adjusted the clamping force pneumatically. A guillotine was used for cutting the paper test pieces to dimensions of 15mmx210mm.
A conditioning chamber that was capable of providing and maintaining standard conditions of temperature and humidity, where the paper test pieces were pre-conditioned at 23 ˚C ± 2 ˚C and 30%r.h.±5%r.h. and were conditioned at 23 ˚C ± 1 ˚C and 50%r.h.±2%r.h. The paper sample was conditioned for 24 hours at 23±1 ˚C temperature and 50%±2% relative humidity in accordance with the ISO 187 standard [10]. Weighing’s were carried out on an electronic balance Sartorius Basic-plus, AG Göttingen Germany BP 221S, with maximum capacity 220g, precision of four decimal places, and accuracy to 0.1mg and it was accreditated every three years.
An IGT Global Standard Tester 1 with printing force 350N and printing velocity 4.00m/s, and a high-speed inking unit 4, software Version 3.01, consisting of 5 inking drums having contact with the top-roller was used for the determination of the pick-picking IGT value Machine Direction and Cross Direction. The IGT pick test oil was of middle viscosity with number 404.004.020 and consisted of poly-isobutene’s. The tester was accompanied by an aluminum disc 10mm wide with smooth edges, and a diameter of 65.0mm. There was also a paper pack consisting of 6 layers of paper with a total thickness of 1.5mm. There was also an ink pipette for applying an accurate quantity of pick-test oil to the inking device, having a volume of 2ml. The distributing time of the ink was 15s and the inking time of the aluminum disc was 10s. The speed during inking time was 0.4m/s and the temperature was kept at 23.2 °C. The ink layer thus formed was approximately 8μm thick. Also, a pick-start viewer was used to determine the starting point of pick, which had a light source providing grazing incident light to the paper test piece and observed pick velocity. Petroleum ether 60-80 °C of analytical reagent grade solvent was used to wet the cleaning rag, lint-free, which served as cleaning aid. There was also a tank filled with water with a built-in thermometer which kept the ambient temperature near the printing device at 23 °C with an accuracy of 0.1 °C. Test prints were made with the IGT Global Standard Tester 1 at 350N/ m^2 printing pressure and 4.0m/s printing speed in accordance with the ISO 3783 [11] standard under optimum printing room conditions (55mm printing width).
The Bendtsen roughness was measured by a Messmer Buchel Roughness and air permeance tester Bendtsen method model No.K513, TMI INC, TMI K513, S.N. 8008-01 with accessories. Τhe crystalline structure and phase identification of the Ca(OH)2 present in the ash content of the paper sample was investigated by a Rigaku Mini-flex 300/600 Benchtop X-ray diffractometer using a Cu Ka radiation (λ=1.5418Å) with a current of 15mA and an anode voltage of 40kV.
Results and Discussion
Tensile properties
Table 1:Tensile strength of the copy paper sample A4 in KN/m in the two directions of the paper MD and CD.

Table 2:Tensile strength of the copy paper sample A4 in MPa in the two directions of the paper MD and CD.

An office A4 paper UPM New Future Multi was chosen which was a common copy paper. Paper properties such as basis weight, thickness, Bendtsen roughness, tensile strength, pick velocity IGT, were measured. The A4 copy paper sample UPM New Future Multi had also a tensile index 57.43 KN.m/Kg lengthwise (Machine Direction or MD) and 19.31 KN.m/Kg crosswise (Counter machine Direction or CD) (Table 1,2). The grammage of the A4 copy paper sample was 78.7g/ sqm. The elongation at rupture of the dry A4 copy paper sample was 1.51% lengthwise (MD) and 3.60% crosswise (CD) (Figure 1,2). The A4 copy paper sample manufactured on a paper machine had more paper fibers oriented in the machine direction (MD) than in the cross direction (CD) and thus was stronger in the machine direction than in the counter machine direction in tension. The density of the paper sample was calculated to be 0.7716g/cm^3, and its specific volume 1.2961cm^3/g.
Figure 1:Tensile force of the dry A4 copy paper sample strips along the machine direction (MD) as a function of the strain of its paper specimens.

Figure 2:Tensile force of the dry A4 copy paper sample strips along the counter machine direction (CD) as a function of the strain of its paper specimens.

Table 3:Physical and optical A4 copy paper UPM new future multi properties.

The thickness of the copy paper sample was measured to be 0.1023mm or 102μm±5.5μm. The pick velocity IGT was determined to be 2.0m/s lengthwise in MD, and 0.4m/s crosswise in CD at 23 ˚C according to ISO 3783 [11]. The pick resistance at 23 ˚C was then calculated to be P(23)=1.96m/s in the MD and P(23)=0.39m/s in the CD. The roughness of paper was measured to be 240ml/min for side A upwards and 272ml/min for side A downwards. There was a relation to this scale of roughness Bendtsen as to the pick resistance which was larger for this value of alkaline pH 9.6 and ash content on ignition of 15.4%w/w [12]. The L*,a*,b* values of colour coordinates told us that the paper had a natural blue-red look (Table 3). The measurements of each side of Bendtsen roughness revealed no noticeable difference in surface roughness.
X-ray diffraction pattern of the ash content on ignition at 900 ˚C, of the copy paper sample
The ash on ignition of the copy paper sample UPM New Future Multi was determined to be 15.4%w/w. For diffraction studies the sample ash on ignition was ground to a fine homogeneous powder. In that form the enormous number of small crystallites present in the powder were oriented in every possible direction; thus, when the X-ray beam traversed the material, a significant number of the particles were oriented in ways as to fulfill the Bragg condition for reflection from every possible interplanar spacing (Figure 3). The identification of the species Ca(OH)2 from its powder diffraction pattern was based upon the position of the lines in terms of 2θ and their relative intensities.
Figure 3:Powder X-ray diffraction pattern of the ash content on ignition at 900 ˚C, of the sample copy paper A4, Bragg angle (2θ, degrees) versus Intensity.

The wavelengths were : Target: Cu, the X-ray type : Ka, Ka1:1.54056(ang.), Ka2:1.54440(ang.), Kb:1.39220(ang.), and the Kalpha12 ratio:0.4970, and Horizontal polarization:0.500. The Optical device: Incident mirror, the Incident monochromator: Use, the Receiving monochromator: Fixed Monochromator, the Optics: Slit conditions: Incident slit, Receiving slit#1, Receiving#2, Measurement: Measurement axis: 2Theta/Theta, Target: Cu and Wavelength type: KAlpha(KAlpha1+KAlpha2). The X-ray diffraction pattern of the ash on ignition at 900 ˚C was portlandite syn Ca(OH)2.
The XRD pattern for the same material, such as portlandite, syn, Ca(OH)2, could have a range of possible relative intensities depending on the direction and degree of alignment of particles in the XRD sample. The key to recognizing the preferred orientation effects on relative peak intensities was to index the XRD pattern fully, that is assign the (hkl) values to each peak (Figure 4) and look for enhancements in the relative intensities of related families of planes [13]. The measurement conditions were presented in Figure 5. The XRD pattern for the ash on ignition showed the presence of only portlandite syn peaks placed at 2θ values of ̴18o, ̴29o, ̴34o, ̴46o, ̴47o, ̴51o, ̴54o, ̴63o, ̴72o which corresponded to crystal planes of 111, 110, 112 (Figure 4,6). The X-ray source was CuKα radiation with wavelength of λ=1.54Å. The sample was measured in step-scan mode in an area between 3o and 110°2θ with step size of 0.02°2θ [14].
Figure 4:Peak list of the XRD pattern.

Figure 5:Measurement conditions

Figure 6:Scheme of chemical reaction of CaCO3 present in the paper sample to becoming Ca(OH)2 during ignition of the paper sample in the oven at 900 ˚C.

Particle size calculation
From this study, considering the peak at degrees, average particle size has been estimated by using Debye-Scherrer formula (1) [14,15]:
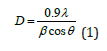
Where λ was the wavelength of X-ray (0.1541nm), β was FWHM (full width at half maximum), θ was the diffraction angle and D was the particle diameter size. The average crystalline size according to Debye-Scherrer equation calculated was found to be 13.05nm and was represented in Table 4.
Table 4:The grain size of Ca(OH)2 nanoparticles present in the ash on ignition of the paper sample.

Estimation of the band gap energy Eg from the DRS studies of the A4 copy paper sample
A graph was plotted of (K/S hv)^2 versus hv. The extrapolation of straight line to (K/S hv)^2=0 axis (Tauc Plot) gave the value of the band gap energy Eg. The ISO brightness was measured to be 98.7%. Its opacity was 94.57% and transparency 13.78%. The K/S value according to equation (1)
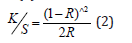
was calculated to be 48.34506688 (Figure 7).
Figure 7:Kubelka-Munk transformed reflectance spectra of the A4 copy paper sample, consisting of 100% cellulose, for the calculation of band gap energy for permitted indirect transitions n=2.

Figure 8:Third derivative-Munk transformed reflectance spectra of the A4 copy paper sample and the Eg=Trend=2.2 5182636876304000000eV calculated from the function trend in the excel spreadsheet.

The band gap energy of the chromophores present in the cellulose of the copy paper sample was estimated to be 1,169715722005400000000000eV for permitted indirect transitions, or 1.874091194E-19Joules at room temperature (Figure 4,5). The band gap was estimated from the function trend in the excel spreadsheet with the data calculated for the whole range of wavelengths 400-700nm (Figure 4). The band gap value calculated was narrow and a narrow band gap may allow electrons to drift easily within electronic states as opposed to larger band gaps. Thus, the optical properties of a paper sample may become a guide for experimentalists for synthesizing paper semiconductors with band gap ranges useful in applications in semiconductor technology. The pH value of the paper sample was determined following a published methodology [16] and corresponded to the equilibrium pH for 2g of the paper material dispersed in 100ml of water at 25 ˚C. A pH value of 9.6 led to an optical band gap value of 1.16971572200540000eV (Figure 4,5). At very high pH≥ 9, 10 the reduction rate was high resulting in the paper’s nanoparticle aggregation. The concentration of ions specifically H+ and OHdirectly affected the band gap of the paper sample. The change in electron density generated by OH- ion’s approximation due to alkaline pH influenced the material’s band gap. The previous trend in the band gap was 1,1698446901002600000eV [17]. The present trend in the band gap was a decreasing energy band gap when adding CaCO3 in the polymer matrix, compared to the previous band gap of 1.1698446901002600000eV (Figure 8).
Optical parameters
Equation (2) was used to calculate the absorption coefficient α(ν), near the edges [18-21]:
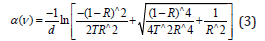
where d was the thickness of the A4 copy paper sample, i.e., 0.1023mm; R was the reflectance, i.e., 0.005770859%, T was the transmittance of the sample for the incident photon, i.e., 98.68%. The shift observed in the fundamental absorption edge of UVvisible spectra could be correlated with the optical band gap by Tauc’s expression [22
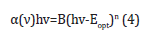
where Eopt was the optical band gap energy; B was a constant called band tailing parameter; ν was the frequency; n was the index that can have different values n=1/3, ½, 3 and 2 depending on the mechanism of inter-band transitions that was corresponding to direct forbidden transitions, direct allowed, indirect forbidden, and indirect allowed, respectively. The optical band gap Eopt values could be obtained by intercepting the linear fitted line in the plot of (αhv)^2 versus hν, as shown in Figure 9. The absorption coefficient α(ν) was calculated to be 4.27185997cm-1 [19,23].
Figure 9:Tauc’s plot of the A4 copy paper sample.

The band gap energy of the chromophores present in cellulose was also estimated from Tauc’s plot to be 1,169715722005400000000000eV for permitted indirect transitions at room temperature.
General Indexing Method (trial and error)
The general indexing method could be applied in all cases when they were known the following parameters, i.e., the wavelength of the radiation, the θ or 2θ values of the reflections from the experiment, the crystal system from the experiment or from the literature, the constants (a, b, c, α, β, γ) of the crystalline material from the experiment or the literature by approximation. The basic principle of the method was the determination of the appropriate values of the hkl indices of a reflection for which the squared difference of the experimental and theoretical value of a quantity became minimal.
Τhe 1/dhkl was chosen as such quantity, whose experimental value was given by Bragg›s equation by solving for 1/dhkl and raising it to the square (quadratic form of the Bragg equation), i.e.,
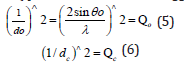
The theoretical value was given by the relation which related for the specific crystal system, 1/dhkl, to the constants of the crystal and the indices.
In practice it was intended to find the appropriate integers h, k, l for which
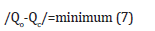
This was done by successively giving h,k,l various simple integer values (positive, or negative, or 0), until the best possible agreement between the experimental data and the corresponding theoretical ones was obtained. These values would be the hkl indices of the reflection, which corresponded to the specific θ. The crystal system of portlandite, syn, Ca(OH)2, identified by the experiment, was trigonal or rhombohedral. The space group was trigonal P3m1 with unit cell with a=3.585Å, b=3.585Å and c=4.871Å and the wavelength was λ=1.5406Å. Then the corners were α=β=γ≤120˚≠90˚.
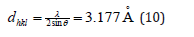
From the peak list in Figure 5, we read 2θ=17.944 from the experiment. Then
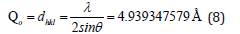
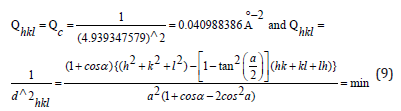
We had the relation of the square of the inverse of the equidistance dhkl with respect to the crystal constants and the corresponding plane indices for the rhombohedral system. The hkl values were the requested Miller indices of the corresponding reflections. It went without saying that more than one solution for each relation separately was accepted as equivalent reflections. E.g., 211 was equivalent to 112 since both verified the below relation (9).
Τhe equidistance dhkl with respect to cell constants and indices was calculated as in equation (9):
From where hkl=111. The indices of the reflection θ=17.944/2, were hkl=111. Or hkl=111.
From the peak list in Figure 5, we read 2θ=28.62 from the experiment. Then
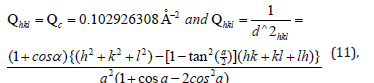
The indices of the reflection θ=28.62/2, were hkl=110.
From the peak list in Figure 5, we read 2θ=34.034 from the experiment. Then
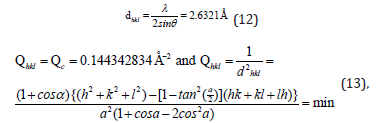
The indices of the reflection θ=45.78/2, were hkl=111.
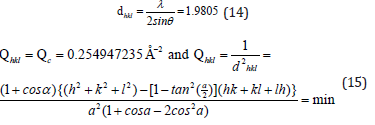
From the peak list we read 2θ=45.78 from the experiment. Then
The separation of planes
The Miller indices were very useful for expressing the separation of planes. The separation of the 111 plane in the rhombohedral lattice was calculated to be 0.2984038nm.

The separation of the 110 plane in the rhombohedral lattice was calculated to be 0.423379nm.

The separation of the 112 plane in the rhombohedral lattice was calculated to be 0.2205806429nm.

XRD was then applied to identify qualitatively the powder’s ash on ignition crystalline phases. XRD worked by using electrons to hit the solid ash sample which then emitted x-rays. A diffractogram was constructed by plotting the produced pattern to link the diffraction angle to the diffracted intensity [24,25]. The CaCO3 present in the paper sample and identified by XRD, increased the strength of the final product.
Conclusion
This work showed the effect of the CaCO3 present in the paper in increasing the tensile strength and improving the quality of the paper sample tested. The role of CaCO3 within the paper sample in influencing the optical properties was analysed and discussed. This spectroscopic and structural investigation may contribute towards the development of photonics. Optical materials such as the A4 copy paper sample tested in this work that are opaque in the visible, because of their comparatively small bandgaps (≤1.25eV), can be classified as infrared semiconductors.
<Conclusion
Paper colorimetric detectors can be used for testing different PDMS membranes to select the best one for the IMS instrument. We want to select a thin membrane, relatively strong due to the presence of mechanical support and modified with PEO or PPO derivatives rapidly reacting to the CWA simulants action in the gas phase.
References
- Vladimir Zarko, Anatoly Glazunov (2020) Review of experimental methods for measuring the ignition and combustion characteristics of metal nanoparticles. Nanomaterials (Basel) 10(10): 2008.
- Kenneth A Ibe, Mbonu JI, Umukoro GK (2015) The Effects of Wood Ash on Ignition Point of Wood. International Scholarly and Scientific Research and Innovation 9(6): 1579-1582.
- Haonan Zhang, Xingping Wen, Junlong Xu, Dayou Luo, Ping He (2020) Study on the effect of surface roughness on the spectral unmixing of mixed pixels. J Spectrosc 2020: 1-10.
- Cem Aydemir, Nemanja Kasikovic, Csaba Horvath, Stefan Durdevic (2021) Effect of paper surface properties on ink color change, print gloss and light fastness resistance. Cellulose Chem Technil 55(1-2): 133-139.
- Gregor Lavric, Tanja Plesa, Ana Mendizza, Marusa Ropret, Igor Karlovits, et al. (2018) Printability characteristics of paper made from a Japanese knotweed. Conference: 9th International Symposium on Graphic Engineering and Design November (2018), pp. 99-102.
- Londoño-Restrepo SM, Jeronimo-Cruz R, Millán-Malo BM, Rivera-Muñoz EM, Rodriguez-García ME (2019) Effect of the nano crystal size on the x-ray diffraction patterns of biogenic hydroxyapatite from human, bovine, and porcine Bones, (2019) Nature Scientific Reports 9(1): 5915.
- Asif Ali, Yi Wai Chiang, Rafael M Santos (2022) X-ray diffraction techniques for mineral characterization: a review for engineers of the fundamentals, applications and research directions. Minerals 12(2): 205.
- Stefanos Mourdikoudis, Roger M Pallares, Nguyen TK Thanh (2018) Characterization techniques for nanoparticles: comparison and complementarity upon studying nanoparticle properties. Nanoscale 10(27): 12871-12934.
- ISO 2144 (2019) Paper, board, pulps and cellulose nanomaterials-determination of residue (ash content) on ignition at 900 ˚C, pp. 1-10.
- ISO 187 (1990) Paper, board and pulps-standard atmosphere for conditioning and testing and procedure for monitoring the atmosphere and conditioning of samples, pp. 1-8.
- NEN-ISO 3783 (2006) Paper and board-determination of resistance to picking-accelerated speed method using the IGT-type tester (electric model), pp.1-12.
- Sanja Dimter, Martina Zagvozda, Tea Tonc, Miroslav Šimun (2022) Evaluation of strength properties of sand stabilized with wood fly ash (WFA) and cement. Materials 15(9): 3090.
- Cameron F Holder, Raymond E Schaak (2019) Tutorial on powder x-ray diffraction for characterizing nanoscale materials. ACS Nano 13(7): 7359-7365.
- Amargeetha A, Velavan S (2018) X-ray diffraction and energy dispersive spectroscopy (EDS) analysis of silver nanoparticles synthesized from erythrina indica flowers. Nanosci Technol 5(1): 1-5.
- Hejing Wang, Jian Zhou (2016) Asymmetry of 1nm XRD reflection and measurement of illite crtystallinity. Acta Phys Pol A 130(4): 886-888.
- ISO 6588-1 (2020) Paper, board and pulps-determination of pH of aqueous extracts-Part 1: Cold extraction, pp. 1-7.
- Katerina Chryssou, Eugenia Lampi (2022) Analysis of a detergent product and identification with an infrared absorption spectrum and a reflectance graph. Ann Chem Sci Res 3(2): 1-7.
- Elimat ZM, Zihlif AM, Maurizio Avella (2008) Thermal and optical properties of poly(methyl methacrylate)/calcium carbonate nanocomposite. J Exp Nanosci 3(4): 259-269.
- Renato Marchesini, Bertoni A, Andreola S, Melloni E, Sichirollo AE (1989) Extinction and absorption coefficients and scattering phase functions of human tissues in vitro. Appl Opt 28(12): 2318-2324.
- Khaled H Mahmoud, Zeinhom M El-Bahy, Ahmed I Hanafy (2011) Calorimetric, optical and catalytic activity studies of europium chloride-polyvinyl alcohol composite system. J Phys Chem Solids 72(9): 1057-1065.
- Alsubaie ASA (2022) Characterization and optical studies of hydroxyethyl cellulose-copper oxide nanocomposites. J Spectrosc 2022: 1-9.
- Dolia SN, Rakesh Sharma, Sharma MP, Saxena NS (2006) Synthesis, X-ray diffraction and optical band gap study- of nanoparticles of NiFe2O4. Indian Journal of Pure & Applied Physics 44: 774-776.
- Van Veen R I P, Sterenborg HJ CM, Pifferi A, Torricelli A, Cubeddu R (2004) Determination of VIS-NIR absorption coefficients of mammalian fat, with time- and spatially resolved diffuse reflectance and transmission spectroscopy. Biomedical Topical Meeting, OSA Technical Digest (Optica Publishing Group, 2004), paper SF4.
- Seham S Alterary, Narguess H Marei (2021) Fly ash properties, characterization and applications: A review. Journal of King Saud University-Science 33(6): 101536.
- Qing Lei Xu, Meng Tao, Miao Zhou Huang (2011) Effects of Nano-CaCO3 on the compressive strength and microstructure of high strength concrete in different curing temperature. Applied Mechanics and Materials VL 121-126.
© 2023 Katerina Chryssou. This is an open access article distributed under the terms of the Creative Commons Attribution License , which permits unrestricted use, distribution, and build upon your work non-commercially.
Editor In Chief


.jpg)


Signup for Newsletter

Quick Links
 Editorial Board Registrations
 Submit your Article
 Refer a Friend
 Advertise With Us
Our Recent Edition

.jpg)


Top Editors


.jpg)


.bmp)
.jpg)
.png)
.jpg)


.jpg)


.png)

.png)


.png)


Financial Support

Sponsors

Latest e-Books

Latest Video

 a Creative Commons Attribution 4.0 International License. Based on a work at www.crimsonpublishers.com.
Best viewed in
a Creative Commons Attribution 4.0 International License. Based on a work at www.crimsonpublishers.com.
Best viewed in