- Submissions

Full Text
Annals of Chemical Science Research
Analysis of a Detergent Product and Identification with an Infrared Absorption Spectrum and a Reflectance Graph
Katerina Chryssou * and Eugenia Lampi
General Chemical State Laboratory, B’ Chemical Division of Athens, Department A’ Tsocha 16, Greece
*Corresponding author:Katerina Chryssou, General Chemical State Laboratory, B’ Chemical Division of Athens, Department A’ Tsocha 16, 11521 Athens, Greece
Submission: June 30, 2022;Published: July 14, 2022

Volume3 Issue2July, 2022
Abstract
Analysis of a commercial detergent product dual power professional citrus fruits 1000mle concentrated Gel Dishes from Italchimica SRL was performed and its soluble matter ethanolic 95˚ was characterized by FT-IR. The anionic active matter content present in the detergent product was calculated to be 9.71%w/w. The pH of the liquid detergent was determined to be 7.45 at 25 ˚C (298K). Absorptions in IR characterizing the anionic surfactant at 1185cm-1 and the non-ionic surfactant at 1098cm-1 appeared. The reflectance ISO brightness of the detergent product was measured 6.29%. The Delta E (ΔΕ*) value for the detergent and standard used was calculated to be 63.25units. The optical band gap of the commercial detergent sample was calculated to be 1.169844690100260eV, using the Kubelka-Munk model.
Introduction
All compounds were AR quality and they were used without further purification. All solutions were prepared using deionized water of conductivity <1μS/cm. Hyamine 1622 0.004M solution Benzethonium chloride standard volumetric solution c(C27H42ClNO2) =0.004mol/l, Merck 1.15480.1000 HC892461 Barcode4022536160498, was used for the determination of anionic-active matter content of the detergent. Ethanol absolute anhydrous (1L) Carlo Erba UN1170 gradient grade was used for the preparation of ethanol 95% v/v solution, neutralized to the phenolphthalein solution. Sulfuric acid standard solution 2.5M (5N) Fluka Analytical 1L Sigma-Aldrich UN 2796 M.W.:98.08g/mol was used for the preparation of the acid solution of the mixed indicator solution. Sodium hydroxide 0.1N (N/10) RPE UN 1824 for analysis Carlo Erba, was used in the determination of the anionic-active matter content of the detergent. Potassium hydroxide approximately 0.5N standard volumetric solution in ethanol was used in the determination of soap present in the detergent analyzed and was prepared from KOH (Potassium hydroxide) 1Kg ERFAR, MW:56.11, DAB 6, B.P. 1968. Phenolphthalein 1%w/v in ethanol 95o was used in the determination of the anionic-active matter content. Water solution 0.1%v/v of 2,7-dichlorofluorescein indicator was used in the determination of soap present in the detergent. Chloroform AG PENTA 1000ml Batch No. 2110271016, Product code 17130-11000 was used in the determination of anionic-active matter content and also in the determination of soap both present in the detergent.
Experimental
Reagents
All compounds were AR quality and they were used without further purification. All solutions were prepared using deionized water of conductivity <1μS/cm. Hyamine 1622 0.004M solution Benzethonium chloride standard volumetric solution c(C27H42ClNO2) =0.004mol/l, Merck 1.15480.1000 HC892461 Barcode4022536160498, was used for the determination of anionic-active matter content of the detergent. Ethanol absolute anhydrous (1L) Carlo Erba UN1170 gradient grade was used for the preparation of ethanol 95% v/v solution, neutralized to the phenolphthalein solution. Sulfuric acid standard solution 2.5M (5N) Fluka Analytical 1L Sigma-Aldrich UN 2796 M.W.:98.08g/mol was used for the preparation of the acid solution of the mixed indicator solution. Sodium hydroxide 0.1N (N/10) RPE UN 1824 for analysis Carlo Erba, was used in the determination of the anionic-active matter content of the detergent. Potassium hydroxide approximately 0.5N standard volumetric solution in ethanol was used in the determination of soap present in the detergent analyzed and was prepared from KOH (Potassium hydroxide) 1Kg ERFAR, MW:56.11, DAB 6, B.P. 1968. Phenolphthalein 1%w/v in ethanol 95o was used in the determination of the anionic-active matter content. Water solution 0.1%v/v of 2,7-dichlorofluorescein indicator was used in the determination of soap present in the detergent. Chloroform AG PENTA 1000ml Batch No. 2110271016, Product code 17130-11000 was used in the determination of anionic-active matter content and also in the determination of soap both present in the detergent.
Apparatus
A pH-meter Metrohm 716 DMS Titrino, Swiss made, was used for the determination of pH. An analytical balance Mettler Toledo AB 204-S/FACT accurate to 0.1mg, maximum capacity 220g was used for the weighing. An oven Memmert direkt, capable of being controlled at 103 ˚C ± 2 ˚C was used for heating the soluble matter to constant mass. A Water bath FALC, 220/240V, 50Hz was used for heating until evaporating off the ethanolic solution of the filtrate in the glass container. FT-IR Spectrometer Perkin Elmer Inc Spectrum 2000 Version 5.0.2 Copyright 2004, was used for the acquisition of IR-spectrum. Spectrophotometer CM-3630 BCMTS M Type 40605, S.N. 43029, Touch Screen-M V 2.0, Frank-PTI, was used for obtaining of the UV-Vis spectrum of the detergent product.
Ordinary laboratory apparatus
Beakers of capacity 250ml, one-mark volumetric flask of capacity 500ml, one-mark volumetric flask of capacity 250ml, conical flasks of capacity 250ml, burette of capacity 50ml, graduated cylinders of capacity 100ml, glass funnel of diameter 80mm, glass container of capacity 250ml.
Analysis of detergent product
Preparation of the mixed acid indicator stock solutionProcedure
We weighed 0.5g of dimidium bromide into a 100ml beaker and we added 20ml of hot 10% v/v ethanol to the beaker. We weighed 0.25g of Disulfine Blue VN 150 into a second beaker and we added to it 30ml of hot 10% v/v ethanol. We stirred the two solutions until dissolved and we transferred the two solutions to a 250ml one-mark volumetric flask. We rinsed the beakers into the volumetric flask with the hot 10% v/v ethanol and we diluted to the mark with the ethanol.
Preparation of the acid solution of the mixed indicator solution
We added 100ml of water to 10ml of the stock solution in a 250ml one-mark volumetric flask. We added to it 10ml of 2.5M (5N) sulfuric acid solution, we mixed them and we diluted to the mark with water. We stored in the dark.
Preparation of water solution 0.1%v/v of 2’,7’-dichlorofluorescein indicator
We weighed 0.1g of 2’,7’-dichlorofluorescein into a 100ml one-mark volumetric flask and we diluted to the mark with the water.
Determination of soluble-insoluble matter ethanolic 95% w/v
We weighed 21.9657g of the detergent sample dual power professional citrus fruit concentrated gel dishes 1000ml, in a 250ml beaker. We added 75ml ethanol 95w/v and we heated on a water bath for 2 hours while stirring often with a glass rod. The glass beaker was covered with a watch glass all time. We then dried a filter paper to be used for the filtration of the insoluble matter, in the oven controlled at 103˚ ± 2 ˚C for 1hour. We allowed it to cool to ambient temperature in a desiccator for 20min and we weighed it to be, 1.0159g. We placed it in a funnel mounted on a glass container on the water bath. When the dissolution of the detergent appeared to be complete, we decanted the supernatant liquid, on to the filter paper. After decantation we added 25ml of ethanol 95%w/v to the 250ml glass beaker and after heating it to near its boiling point, we transferred the insoluble matter to the filter paper with the aid of small quantities of the warm ethanol. The filter paper and the residue were washed with the warm ethanol until entirely free from detergent. We then dried the filter paper in air and we placed it in the oven at 103˚ ± 2 ˚C. After 1hour we removed the filter paper and we left it in the desiccator for 20min for it to cool, and we weighed it. Yield: 0.0411g, 0.19%w/w. The ethanolic solution of the filtrate in the glass container on the water bath was then heated. We evaporated off all of the ethanolic solution. We then heated the glass container with the soluble matter to constant mass in the oven controlled at 103˚ ± 2 ˚C. We finally cooled in a desiccator and we weighed the contents. Yield: 2.6886g, i.e. 12.24% w/w. The percentage of yield for the insoluble matter ethanolic, for the detergent Dual Power, was calculated as [(mass of insoluble matter ethanolic in g)/(mass of detergent sample in g)]*100=[(0.0411g)/(21.9657g)]*100=0.19% w/w. Also the percentage of yield for soluble matter ethanolic for the detergent Dual Power was calculated as [(mass of soluble matter ethanolic in g)/ (mass of detergent sample in g)] *100=[(2.6886g)/(21.9657g)]*100=12.24%w/w.
Determination of the anionic–active matter content by manual direct two-phase titration procedure
We weighed 3.5170g of the detergent product Dual Power into a 250ml beaker, an amount of laboratory sample which contained about 0.004mol of the anionic-active matter. We transferred quantitatively to a 500ml one-mark volumetric flask with ground glass stopper and we diluted to the mark with water. We mixed thoroughly and by means of a pipette we transferred 20ml of this solution to the measuring cylinder. We then added a few drops of the phenolphthalein solution, and we neutralized to a faint pink colour with the sodium hydroxide solution 0.1M as required. We then added to the measuring cylinder solution 10ml of water, 15ml of chloroform and finally 10ml of the mixed indicator solution. We then titrated against the benzethonium chloride solution. We stoppered the measuring cylinder after each addition of the hyamine 1622 0.004M, and we Shaked well. Then the lower chloroform layer was colored pink. We continued the titration with repeated vigorous shaking. As the end point approached, the emulsion formed during shaking, tended to break easily. We continued the titration drop by drop shaking after each addition of titrant until the end point was reached. The end point was reached at the moment when the pink colour was completely discharged from the chloroform layer, which became a faint greyish blue color. Volume of benzethonium chloride solution used: 9.8ml. The anionic active matter content was calculated to be {[(volume V in ml of Hyamine 1622 0.004M)*0.004M*(348.49g/mol)*5]/(mass of the detergent in 1L solution)}=[(9.8ml*0.004M*348.49g/mol*5)/(7.0340g)]=9.71% w/w.
Yield: 9.71% w/w of anionic surfactant from 3.5170g of detergent sample in 500ml deionized water solution
Determination of soap by manual direct two-phase titration procedure in detergent
We weighed 3.5170g of the detergent sample dual power into a 250ml beaker of the detergent sample which contained about 0.004mol of soap. We transferred quantitatively to a 500ml one-mark volumetric flask with ground glass stopper and diluted to the mark with water. We mixed thoroughly and by means of a pipette we transferred 20ml of this solution to a marked measuring cylinder. We then added to the measuring cylinder solution 10ml of water and 5 drops of the indicator solution 2,7-dichlorofluoresquein 0.1% v/v. We then added 15ml of chloroform and finally 2ml ethanolic solution KOH 0.5M. We then titrated against the benzethenium chloride solution. We stoppered the measuring cylinder after each addition of the hyamine 1622 0.004M and we Shaked well. Then the lower chloroform layer was colored yellow. We continued the titration with repeated vigorous shaking. As the end point approached the emulsion formed during shaking tended to break and was colored faintly pink. We continued the titration drop by drop, shaking after each addition of titrant, until the end point was reached. This is at the moment when the faintly pink colour from the chloroform layer became a strong pink. Volume of benzethonium chloride solution:(11.1ml-9.8ml) i.e., 1.3ml Yield: 1.21%w/w soap. The percentage of yield of the soap present in the detergent sample was calculated as {[volume (V’-V) in ml of Hyamine 1622 used] *0.004*(326g/mol) *5}/ (mass of detergent in 1L solution)} ={(1.3ml*0.004mol*326g/mol*5)/ (7.0340g)} =1.21% w/w.
Yield: 1.21%w/w soap from 3.5170g of detergent sample in 500ml deionized water solution.
Results and Discussion
We measured the pH of the detergent solution Dual Power as it is to be pH 7.45 at 25 ˚C (298K) in the Metrohm 716 DMS Titrino pH-meter. We prepared a 1% w/w solution of the detergent solution dual power in deionized water and we measured pH=7.61 at a temperature of 25 ˚C (298K) in the Metro hm 716 DMS Titrino pH-meter. We then prepared a 10% w/w solution of the detergent solution and we measured pH=7.78 at a temperature of 25 ˚C (298K) in the Metro hm 716 DMS Titrino pH-meter. All measurements were done in duplicate and the average value was reported.
Acquisition of IR-spectra
Infrared Transmittance data
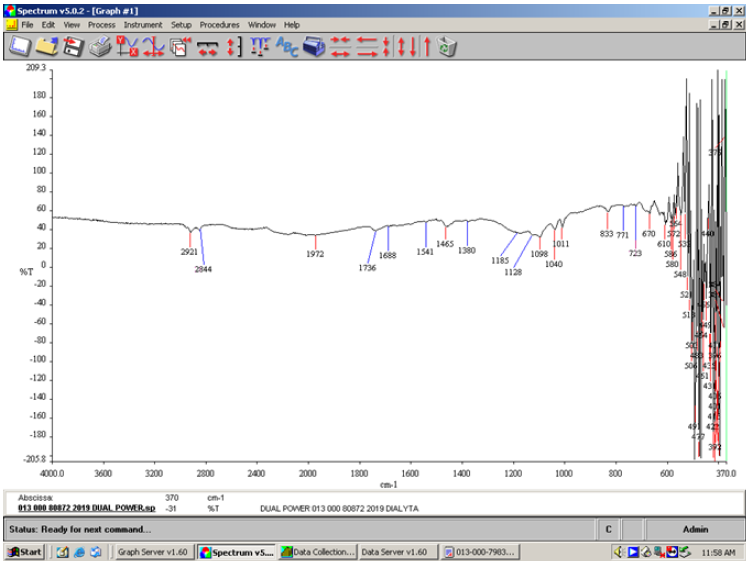
The infrared spectra were recorded in the solid state. The material of the ATR crystal was diamond. In the FT-IR spectrum (Figure 1) of the soluble matter ethanolic of the detergent Dual Power the sulfates (organic) showed sulfate absorption at 1185cm-1, the secondary sulfate displayed a shift toward longer wavelength at 1185cm-1 (Table 1). The sulfates appeared at 1380cm-1 and 1185cm-1. Sulfonate salts appeared at 1040cm-1. Various strong S-O-C stretching absorptions appeared at 1011cm-1 and 833cm-1. At 1128cm-1 the absorption was due to secondary C-O-stretching vibration of the hydroxyl component in the monoglyceride sulfate. The absorption of the anionic surfactant benzenesulfonic acid 4-C10-13-sec-alkyl-derivatives, sodium salts (sodium 4-undecyl benzene sulfonate) appeared at 1185cm-1. The absorption of the non-ionic surfactant, alcohols, C12-14 (even numbered), ethoxylated (<2.5% E.O.) sulfates, sodium salts appeared at 1098cm-1. At 1098cm-1 there was the alcoholic C-O absorption for the saturated tertiary and secondary high symmetrical. The C-O stretching vibrations in alcohol and phenol produced a strong band in the 1260-1000cm-1 region of the spectrum. The C-O stretching mode was coupled with the adjacent C-C stretching vibration, thus the vibration could better be described as an asymmetric C-C-O stretching vibration. The C…C ring stretch appeared at 1465cm-1. The ester sulfonate absorptions were seen at 1736cm-1. At 2844 cm-1 appeared the C-H stretch of the methylene absorption. The fingerprint region at 833cm-1 was characteristic for the primary alcohol sulfates. In the region 771-670cm-1 appeared a broad absorption band because of out-of-plane bending of the bonded O-H group (Figure 1).
Table 1:The maximum of the S=O stretching vibration of the anionic surfactant is listed.

Figure 1:FT-IR spectrum of the soluble matter ethanolic of the detergent Dual power showing the absorption of the anionic surfactant and the non-ionic surfactant present.
Calculation of Kubelka-Munk K/S value for the detergent product (absorption coefficient / scattering coefficient ratio).
The K/S ratio for the detergent Dual Power was found K/ S=2.224491256 and the reflectance ISO brightness used was measured 6.29% at common laboratory conditions (22 ˚C and 52% relative humidity). The ISO brightness measured was the numerical value of the reflectance of the detergent at 457nm, blue light reflectance. In this work the Kubelka-Munk theory was used for predicting optical properties for the Dual power detergent product. The appearance of the liquid detergent was the result of its optical properties. As known the Kubelka-Munk theory is based on the assumption that the interaction between the diffuse light and the liquid detergent material could be described in terms of two fundamental optical constants. The specific scattering coefficient (S) and the specific absorption coefficient (K). Although the Kubelka-Munk theory holds strictly for homogeneous materials only, it worked also for the detergent solution containing more than one substance. The equation of Kubelka-Munk used above was K/S=(1-R)^2/2R where K is the absorption or coefficient of reflectivity and S is the coefficient of light scattering; R was the observed reflectivity for monochromatic light. From the K/S ratio calculated above we can assume that light absorption was high in the detergent product indicating the presence of more colored matter other than anionic matter and soap which was converted to heat thereby reducing the brightness of the detergent product.
CIE L*a*b* values for the detergent sample analyzed
The color of the detergent Dual Power in the CIE L*a*b* system for illuminant C/2 was L*=33.86, a*=-3.33 and b*=6.45. L is the measure of lightness and varies from 100 for a perfect white to 0 for the absolute black. Here -a indicated the greenness of the detergent and +b indicated its yellowness. Here the color measured indicated the presence of a green yellowish, rather than a white liquid detergent. With the use of the CIE L* a* b* color system the magnitude and direction of color difference between the detergent sample and the standard could be determined. The Delta E (ΔΕ*) (Table 2) was overall color difference value which took into account lightness/darkness differences as well as chromatic differences. The intended object of the system was for a color difference of 1.0 unit to be exactly the same visual color difference anywhere in color space. Here ΔΕ* was 63.25 units. The opacity calculated for the detergent Dual Power was 24.81% and the transparency was 86.64% (Table 3).
Table 2: In the table CIE L*, a*, b* values for the detergent sample were presented, as well as of the calibration standard used, and the ΔΕ*=[(ΔL*)2+(Δa*)2 +(Δb*)2]1/2 value was calculated, where L*(C/2), a*(C/2), b*(C/2), ΔΕ*.

Table 3:Substrate, Dual Power detergent details.

Estimation of the Band gap from diffuse reflectance spectroscopy
reflectance graph (Figure 2) of the detergent was based on the chromophores present in it. Chromophores are organic molecules and ions containing groups of atoms that contain unsaturated bonds and lone-pair electrons. The chromophore carbonyl group was present in the non-ionic surfactant poly(oxy- 1,2-ethanediyl), α-sulfo-w-hydroxy-C12-14alkyl ethers, sodium salts and also in the colorant CI 19140, i.e., trisodium 5-hydroxy-1- (4-sulphophenyl)-4-(4-sulphophenylazo) pyrazole-3-carboxylate. The liquid detergent dual power comprised the anionic surfactant benzenesulfonic acid 4C10-13sec alkyl derivatives sodium salts and also the non-ionic surfactant alcohols (C12-14) ethoxylated sulfates sodium salts and the fragrance with limonene and citral. It also comprised the conservatives methylisothiazolinone, and benzisothiazolinone, sodium chloride, betaine, sodium hydroxide and tetrasodium glutamate diacetate and water.
Figure 2: Reflectance graph for the liquid detergent product Dual Power as it was.
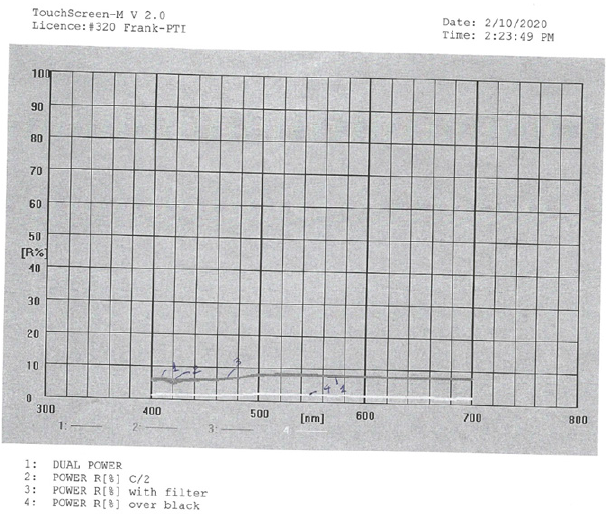
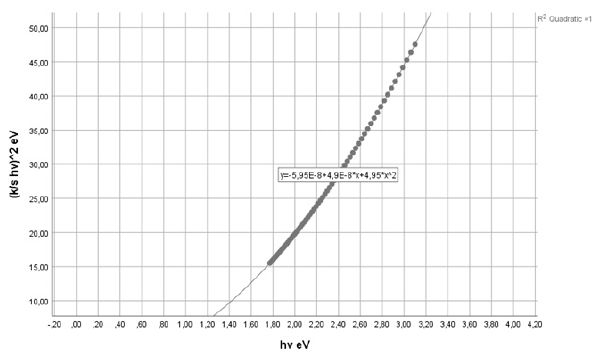
From the diffuse reflectance spectrum using the Kubelka-Munk equation a plot with hv along the x-axis and (K/S hv)^2 along y-axis was plotted (Figure 3). The band gap (Eg) for permitted indirect transitions of the detergent material was estimated by extrapolating the straight line in the graph to y-axis=0 on energy axis (Figure 4) [8-10]. Figure 2 depicted the diffuse reflectance spectrum of the detergent product. Then K/S=(1-R)^2/2R was calculated to be 2.224491256. The band gap energy was estimated to be 1.169844690100260eV (Figure 3 & 4).
Figure 3: hv versus [K/S hv]2 graph of the chromophore presents in the liquid detergent product in aqueous solution, for calculating the band gap energy for permitted indirect transitions.
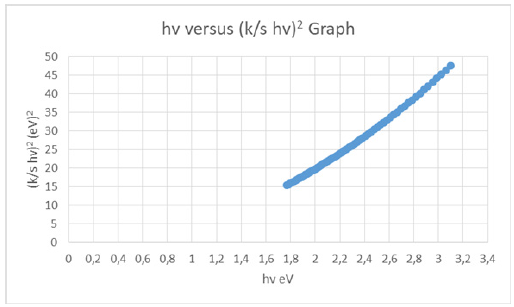
Figure 4:hv versus [K/S hv]2 graph of the chromophore in the liquid detergent product in aqueous solution, in IBM SPSS Statistics. Method of band gap energy determination from the Tauc plot. The final part of the plot is extrapolated to the x-axis.
<
Conclusion
The detergent product Dual Power, which was a commercial product, has been analyzed and its anionic active matter content was determined, as well as its soluble matter ethanolic was characterized by FT-IR. The diffuse reflectance spectrum of the detergent was used to estimate the band gap energy of the liquid detergent as semiconductor. In conclusion, the FTIR method and the Reflectance graph, are simple, accurate and easily applicable methods to the identification of finished products of detergent samples. Presently, we are investigating the use of FTIR for a more wide variety of detergent, and cosmetic finished products.
References
- Imtiaz Ahmad, Suhail HS, Ali Rizwan, Malik SM (2021) Spectroscopic analysis for harnessing the quality and potential of gemstones for small and medium-sized enterprises (SMEs). J Spectrosc, pp.1-12.
- Purnendu Parhi, Manivannan V, Sandeep K, Patrick McCurdy (2008) Synthesis and characterization of M3V2O8 (M=Ca, Sr and Ba) by a solid-state metathesis approach. Bull Mater Sci 31(6): 885-890.
- Sabiu SA, Sadik G, Yuksel K, Ibrahim MM, Bala Ismai A, et al. (2016) Simple method for the determination of band gap of a nano powdered sample using KUBELKA MUNK theory, (2016) Journal of the Nigerian Association of Mathematical Physics 35: 241-246.
- Kubelka P, Munk F (1931) A contribution to the optics of paint coatings. Time For Techn Physics 12: 593-601.
- Nadeem MY, Sadhana TB, Altaf M, Chaudhry MA (2004) Optical band gap in MnO-CdO-P2O5 J Res Sci 15(3): 245-251.
- Patrycja Makula, Michal Pacia, Wojciech Macyk (2018) How to correctly determine the band gap energy of modified semiconductor photocatalysts based on UV-V is spectra. J Phys Chem Lett 9: 6814-6817.
- Marie Sabo, John Gross, Rosenberg IE (1984) Quantitation of anionic surfactants in aqueous systems via Fourier transform infrared spectroscopy. J Soc Cosmet Chem 35: 207-220.
- Samaneh B, Zainal AT, Zobir Hussein M, Ali Ahmed AA (2014) Optical and thermal properties of Zn/Al-Layered double hydroxide nanocomposite intercalated with sodium dodecyl sulfate. J Spectrosc, pp. 1-10.
- Tauc J, Grigorovici R, Vancu A (1966) Optical properties and electronic structure of amorphous germanium. Phys Stat Sol 15: 627-637.
- Brian DV, Shane Patel, Benjamin ED, Birnie DP (2015) Evaluation of the Tauc method for optical absorption edge determination: ZnO thin films as a model system. Phys Stat Sol 252(8): 1700-1710.
© 2022 Katerina Chryssou. This is an open access article distributed under the terms of the Creative Commons Attribution License , which permits unrestricted use, distribution, and build upon your work non-commercially.
 a Creative Commons Attribution 4.0 International License. Based on a work at www.crimsonpublishers.com.
Best viewed in


.jpg)


 Editorial Board Registrations
 Submit your Article
 Refer a Friend
 Advertise With Us
.jpg)


.jpg)


.bmp)
.jpg)
.png)
.jpg)


.jpg)


.png)

.png)


.png)


