- Submissions

Full Text
Annals of Chemical Science Research
Analysis of a Liquid Handwashing Detergent Product and Identification with an Infrared Absorption Spectrum and a Reflectance Graph
Katerina Chryssou* and Eugenia Lampi
General Chemical State Laboratory, B’ Chemical Division of Athens, Department A’ Tsocha 16, Greece
*Corresponding author:Katerina Chryssou, General Chemical State Laboratory, B’ Chemical Division of Athens, Department A’ Tsocha 16, 11521 Athens Greece
Submission: September 13, 2022;Published: September 27, 2022

Volume3 Issue2September, 2022
Abstract
Analysis of a commercial liquid detergent handwashing product ROL Classic New 750mle from ROLCOVIANYL S.A., was performed and its soluble matter ethanolic 95˚, 15.74%w/w of yield, was characterized by FT-IR, as well as its insoluble matter ethanolic 95˚ 0.23w/w of yield. The anionic active matter content present in the detergent product was specified to be 11.21%w/w. The pH of the liquid detergent was determined to be 8.99 at 25 ˚C (298K) and this alkaline pH value may have altered the optical band gap to higher values. Absorptions in IR characterizing the anionic surfactant at 1193cm-1 and the non-ionic surfactant at 1128cm-1 appeared in the FT-IR spectrum of soluble matter ethanolic of the detergent. Sulfonic acid appeared hydrated at 1122cm-1 in the FT-IR spectrum of the insoluble matter ethanolic of the detergent. The reflectance ISO brightness of the detergent product was measured 8.01%. The Delta E (ΔΕ*) value for the detergent and white standard used for calibration was calculated to be 62.9units. The optical band gap of the commercial detergent sample was calculated to be 1.174117281562370eV, using the Kubelka-Munk theory. The optical band gap value was associated to the number of carbon atoms per molecule involved in the chromophore, in the detergent sample ROL Classic, calculated to be approximately 44. Finally, a periodogram of hv eV by frequency, and a periodogram of (K/S hv)^2 by frequency were used as part of a univariate analysis, and no significant peaks in the frequency band were found.
Keywords: Diffuse reflectance spectroscopy; Surfactants; Direct two-phase titration method; Kubelka Munk equation; Optical band gap; Urea; pH
Introduction
Detergent products are by their chemical composition complex materials, commonly classified by their origin as a mixture of anionic and nonionic surfactants, or as of single surfactants. One of the most prominent applications of detergents is for domestic cleaning [1] as for the detergents currently examined. Reflectance spectra can be recorded only from the surface [2] of the detergent sample and surface anomalies or possible contamination and also various additives can markedly influence the spectra. Problems occur also with the measurement of very small samples because then it may be impossible to obtain good-quality reflectance spectra. When using reflectance mode, the key factor is selection of a suitable sample area (aperture) and good focusing of the radiation on the sample surface [2].
A variety of techniques having suitability to different materials have been employed to determine energy band gap of materials, especially of semiconductors. If the material is in the form of thin films it is convenient to estimate the energy band gap from the transmittance spectrum. The most commonly employed technique to extract energy band gap is from the absorption spectrum of the material. Diffuse reflectance spectroscopy is a very useful companion technique to transmission spectroscopy. It can provide absorption data in cases like liquid detergents where transmission measurements may fail [3]. The construction of the tauc plot [4] for the indirect allowed transition for the band gap calculation [5,6] in a liquid detergent is a research area which has not been used enough so far. The tauc plot is a method that is widely used for the determination of band gap. The energy gap is an important feature of semiconductors which determines their applications in optoelectronics. The determination of band gap in materials is important to obtain the basic solid-state physics. Band gap indicates the difference in energy between the top of the valence band filled with electrons and the bottom of the conduction band devoid of electrons [7]. The band gap is related to the electric conductivity of the materials. There is generally no band gap in metals, but the band gap value in insulators is known to be large and that in semiconductors is typically intermediate between these two. Here we introduce band gap determination from tauc plot obtained from diffuse reflectance spectra of a sample of liquid detergent molecule consisting of compound semiconductor material.
The quantitation of the anionic surfactant present in the liquid handwashing detergent product is carried out through the twophase titration method. This method is not quantitative for all anionic surfactants, particularly when the hydrophobic group is short [8,9]. The anionic surfactants present in slightly alkaline pH should be studied as they may help tune the band gap in a value around and below 1.4eV, which is appropriate for making solar cells in the near infrared spectrum [10]. Finally, infrared spectroscopy has been used extensively as before for the qualitative identification of anionic and nonionic surfactants and of other molecules also present in the composition of liquid detergent products.
Experimental
Reagents
All compounds were AR quality and they were used without further purification. All solutions were prepared using deionized water of conductivity <1μS/cm. Hyamine 1622 0.004M solution Benzethonium chloride standard volumetric solution c(C27H42ClNO2)=0.004mol/l, Merck 1.15480.1000 HC892461 Barcode 4022536160498, was used for the determination of anionic-active matter content of the detergent sample. Ethanol absolute anhydrous (1L) Carlo Erba UN1170 gradient grade was used for the preparation of ethanol 95%v/v solution, neutralized to the phenolphthalein solution. Sulfuric acid standard solution 2.5M (5N) Fluka Analytical 1L Sigma-Aldrich UN 2796 M.W.:98.08g/ mol was used for the preparation of the acid solution of the mixed indicator solution. Sodium hydroxide 0.1N (N/10) RPE UN 1824 for analysis Carlo Erba, was used in the determination of the anionicactive matter content of the detergent. Potassium hydroxide approximately 0.5N standard volumetric solution in ethanol was used in the determination of soap present in the detergent analyzed and was prepared from KOH (Potassium hydroxide) 1Kg ERFAR, MW:56.11, DAB 6, B.P. 1968. Phenolphthalein 1%w/v in ethanol 95˚ was used in the determination of the anionic-active matter content. Water solution 0.1%v/v of 2,7-dichlorofluorescein indicator was used in the determination of soap present in the detergent sample.
Chloroform AG PENTA 1000ml Batch No. 2110271016, Product code 17130-11000 was used in the determination of anionic-active matter content and also in the determination of soap both present in the detergent ROL Classic New.
Apparatus
A pH-meter Metrohm 716 DMS Titrino, Swiss made, was used for the measurement of pH. An analytical balance Mettler Toledo AB 204-S/FACT accurate to 0.1mg, maximum capacity 220g was used for the weighing done. An oven Memmert direkt, capable of being controlled at 103 ˚C ± 2 ˚C was used for heating the soluble matter to constant mass, as well as the filter paper with the insoluble matter ethanolic. A water bath FALC, 220/240V, 50Hz was used for heating until evaporating off the ethanolic solution of the filtrate in a glass container. FT-IR Spectrometer Perkin Elmer Inc Spectrum 2000 Version 5.0.2 Copyright 2004, was used for the acquisition of IR-spectrum using as ATR crystal a diamond. Spectrophotometer CM-3630 BCMTS M Type 40605, S.N. 43029, Touch Screen-MV 2.0, Frank-PTI, was used to measure the optical properties of the sample detergent product.
Analysis of detergent product
ProcedureDetermination of soluble-insoluble matter ethanolic 95%w/v:
We weighed 17.9535g of the detergent sample handwashing Liquid ROL Classic 750ml, in a 250ml beaker. We then added 75ml ethanol 95w/v and we heated on a water bath for 2 hours while stirring often with a glass rod. The glass beaker was covered with a watch glass all time. We then dried a filter paper to be used for the filtration of the insoluble matter, in the oven controlled at 103˚ ± 2 ˚C for 1 hour. We allowed it to cool in a desiccator for approximately 20min and we weighed it to be, 0.9943g. Yield: 2.8255g, i.e., 15.74%w/w of insoluble matter ethanolic. Τhe percentage of yield for the insoluble matter ethanolic, for the detergent ROL Classic, was calculated as [(mass of insoluble matter ethanolic in g)/(mass of detergent sample in g)]*100=[(0.0407g)/ (17.9535g)]*100=0.23%w/w. Also, the percentage of yield for soluble matter ethanolic for the detergent ROL Classic was calculated as [(mass of soluble matter ethanolic in g)/(mass of detergent sample in g)]*100= [(2.8255g)/ (17.9535g)]*100=15.74%w/w of soluble matter ethanolic. The soluble matter ethanolic contained the percentage of the anionic surfactant and that of the non-ionic surfactant as well the percentage of soap present in the detergent sample ROL Classic.
Determination of the anionic–active matter content by manual direct two-phase titration procedure:
We weighed 3.6052g of the detergent product ROL Classic into a 250ml beaker, an amount of laboratory sample which contained about 0.004mol of the anionic-active matter content. We transferred it to a 500ml one-mark volumetric flask with ground glass stopper and we diluted to the mark with water. We mixed thoroughly and by means of a pipette we transferred 20ml of this solution to a measuring cylinder. We then added a few drops of the phenolphthalein solution, and we neutralized to a faint pink colour with the sodium hydroxide solution 0.1M. We then added to the measuring cylinder solution 10ml of water, 15ml of chloroform and finally 10ml of the mixed indicator solution and we titrated against the benzethonium chloride solution. The end point was reached when the pink colour was completely discharged from the chloroform layer and became a faint greyish blue color. Volume of benzethonium chloride solution used: 11.6ml. The anionic active matter content was calculated to be {[(volume V in ml of Hyamine 1622 0.004M)*0.004M*(348.49g/ mol)*5]/(mass of the detergent in 1L solution)} = [ (11.6ml* 0.004M* 348.49g/mol*5)/(7.2104g)]=11.21%w/w.
Yield: 11.21%w/w of anionic surfactant from 7.2104g of detergent sample ROL Classic in 1L deionized water solution
Determination of soap by manual direct two-phase titration procedure in detergent:
We weighed 3.6052g of the detergent sample ROL Classic into a 250ml beaker of the detergent sample which contained about 0.004mol of soap. We transferred quantitatively to a 500ml one-mark volumetric flask with ground glass stopper and diluted to the mark with water. We mixed thoroughly and by means of a pipette we transferred 20ml of this solution to a marked measuring cylinder. We then added to the measuring cylinder solution 10ml of water and 5 drops of the indicator solution 2,7-dichlorofluoresquein 0.1%v/v. We then added 15 ml of chloroform and finally 2ml ethanolic solution KOH 0.5M. We then titrated against the benzethenium chloride solution. We continued the titration drop by drop, shaking after each addition of titrant, until the end point was reached which was when the faintly pink colour from the chloroform layer became a strong pink. Volume of benzethonium chloride solution: (12.9ml-11.6ml) i.e., 1.3ml, Yield: 1.18%w/w of soap. The percentage of yield of the soap present in the detergent sample was calculated as {[volume (V’-V) in ml of Hyamine 1622 used]*0.004*(326g/mol)*5}/(mass of detergent in 1L solution)}={(12.9-11.6)ml*0.004mol*326g/ mol*5)/(7.2104g)}=1.18%w/w, i.e. {(1.3ml)* 0.004mol* 326g / mol*5)/(7.2104g)}=1.18%w/w of soap.
Yield: 1.18%w/w of soap from 7.2104g of detergent sample in
1L deionized water solution./p>
Results and Discussion
Determination of pH
We measured the pH of the detergent solution ROL Classic New as it was to be pH 8.99 at 25 ˚C (298K) in the Metrohm 716 DMS Titrino pH-meter [11]. The pH measurement was performed in this work in order to relate it to any changes to the band gap value of the detergent, acting as semiconductor. The role of the pH around 9 in the use of semiconductor materials of detergent solutions has thus started to be studied. We then prepared a 1%w/w solution of the detergent solution ROL Classic New in deionized water and we measured pH 8.34 at a temperature of 25 ˚C (298K) in the Metrohm 716 DMS Titrino pH-meter. We also prepared a 10%w/w solution of the detergent solution and we measured pH 9.06 at a temperature of 25 ˚C (298K) in the Metrohm 716 DMS Titrino pH-meter. All measurements were performed in duplicate and the average values were recorded with ±0,7 uncertainty at 95% confidence level.
Acquisition of IR-spectra
Infrared Transmittance data:
All the infrared spectra were recorded in the solid state. The material of the ATR crystal was diamond. Measurements were done in the spectral range 370- 4000cm-1.
Figure 1:FT-IR spectrum of the soluble matter ethanolic of the liquid handwashing detergent ROL Classic showing the absorption of the anionic surfactant and the non-ionic surfactant both present.
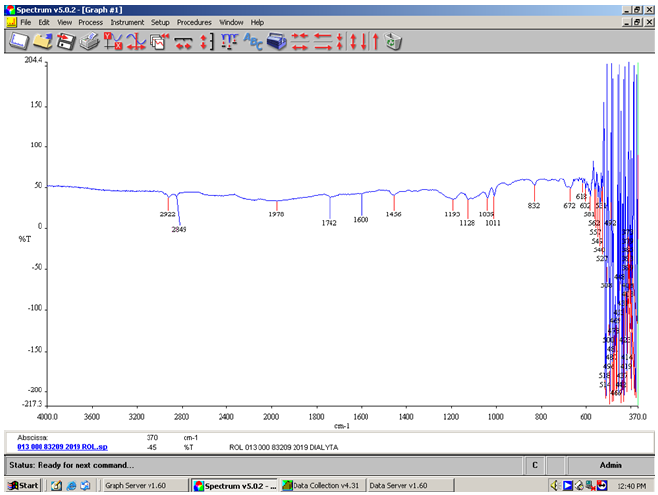
In the FT-IR spectrum of the soluble matter ethanolic of the detergent ROL Classic the sulfates (organic) showed sulfate absorption at 1193cm-1, (Figure 1) the secondary sulfate displayed a shift toward longer wavelength at 1193cm-1 (Table 1). The sulfates appeared at 1380cm-1 and 1193cm-1. The sulfonate salts appeared at 1039cm-1. The absorption of the anionic surfactant sodium alkylbenzenesulfonate C10-13, appeared at 1193cm-1. The absorption of the non-ionic surfactant, alcohols ethoxylated C12-15 appeared at 1128cm-1 attributed to stretching C-OH vibrations. The C...-C ring stretch appeared at 1600cm-1 and at 1456cm-1 (Figure 1). The ester sulfonate absorptions appeared at 1742cm-1. Normal ester C=O stretch appeared at 1740cm-1 (Figure 1) [12].
Table 1:The maximum of the S=O stretching vibration of the anionic surfactant present was listed.

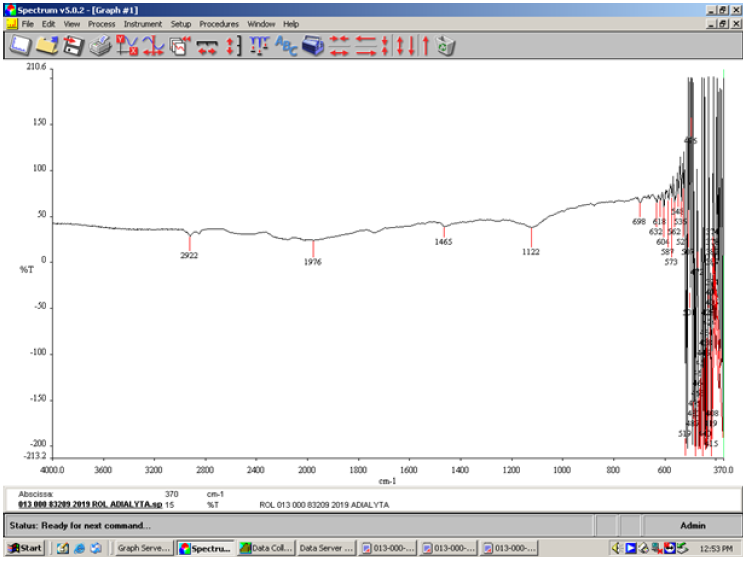
In the FT-IR spectrum of the insoluble matter ethanolic of the detergent ROL Classic the sulfonic acid appeared hydrated at 1122cm-1 (Figure 2). Sulfonic acids hydrated readily to give bands that were probably a result of the formation of hydronium sulfonate salts in the 1230-1120cm-1 range.
Figure 2:FT-IR spectrum of the insoluble matter ethanolic of the liquid handwashing detergent ROL Classic showing the absorption of the sodium sulfate present among others.
Calculation of Kubelka-Munk K/S ratio for the detergent product ROL Classic
The K/S ratio for the detergent ROL Classic New was calculated K/S=3.067421973 and the reflectance ISO brightness was found 8.01% (Table 2) at common laboratory conditions i.e. 22 ˚C and 52% relative humidity. The ISO brightness measured in this work was the numerical value of the reflectance of the detergent ROL Classic at 457nm, blue light reflectance. The theory which makes possible to use diffuse reflectance spectra was proposed by Kubelka and Munk [13].
Table 2:Substrate, ROL Classic New detergent details.

In this work the Kubelka-Munk theory was used to detect the optical properties for the ROL Classic detergent product. The appearance of this liqid detergent product was the result of its optical properties. The Kubelka-Munk theory was applied here on the assumption that the interaction between the diffuse light and the liquid detergent material could be described by the specific scattering coefficient (S) and the specific absorption coefficient (K). The equation of Kubelka-Munk used was:

where K was the absorption or coefficient of reflectivity, and S was the coefficient of light scattering; R was the observed reflectivity for monochromatic light.
From the K/S ratio estimated from the above equation (1) we can deduce that light absorption was high in the ROL Classic detergent product showing the presence of more colored matter other than anionic matter, non-ionic matter, soap and colorant, which was converted to heat thereby reducing the ISO brightness [14] of the detergent product to 8.01% from a usual value of 90% on solid white paper samples [16].
The CIE L*, a*, and b* values of the detergent sample analyzed
The color of the detergent ROL Classic in the CIE L*a*b* system for illuminant C/2 was L*=33.80, a*=-1.51 and b*=-0.35 were L* was the measure of lightness and varied from 100 for a perfect white to 0 for the absolute black. Also, –a* indicated the greenness of the detergent and –b* indicated its blueness. Here the color measured indicated the presence of a green-blue, rather than a white liquid detergent. The CIE L* a* b* color system was used to determine the magnitude and direction of color difference between the detergent sample ROL Classic and the white standard used for calibration of the spectrophotometer Frank-PTI. The Delta E (ΔΕ*) value (Τable 3) was the overall color difference value and was found here to be ΔΕ* 62.9 units. The opacity calculated for the detergent ROL Classic was found to be 65.95% and the transparency was 58.23% (Table 2). The opacity was measured at 572nm.
Table 3:In the table CIE L*, a*, b* values for the detergent sample ROL Classic were presented, as well as of the white calibration standard used, and the ΔΕ*=[(ΔL*)^2+(Δa*)^2+ (Δb*)^2]^1/2 value was calculated, where L*(C/2), a*(C/2), b*(C/2), ΔΕ*.

Diffuse reflectance spectroscopy and optical parameters
Figure 3:Reflectance graph for the liquid detergent product ROL Classic as it was, after selection of a suitable sample area on the detergent sample surface.

The reflectance graph (Figure 3) of the detergent ROL Classic
was based on the chromophore molecules present in it which were
organic molecules and ions containing groups of atoms that contained
unsaturated bonds and lone-pair electrons. The chromophore
carbonyl group was actually present in the soap sodium palm
kernelate i.e., C16H31NaO2, 0.8838%w/w, and also in the colorant
CI 42051:2, 0.0004%w/w, Patent Blue V, i.e., C27H31N2NaO7S
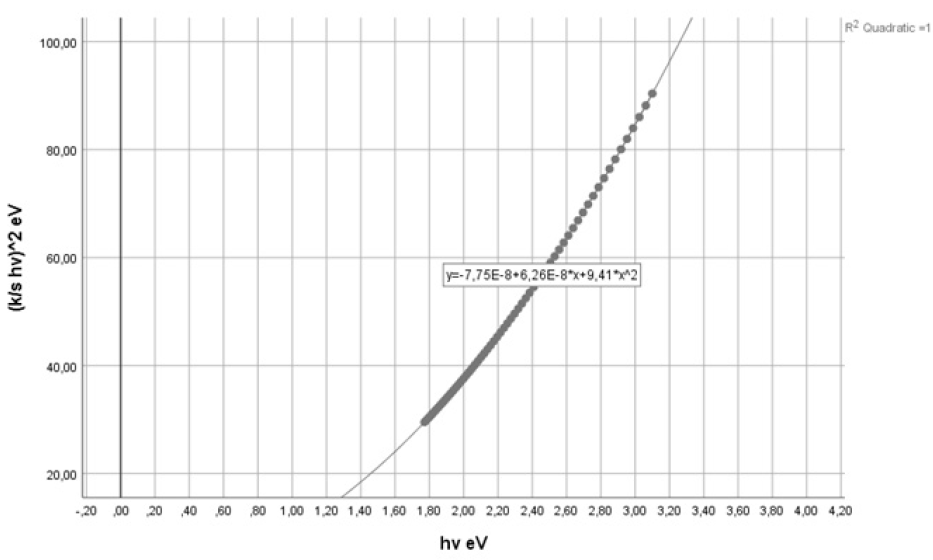
From the diffuse reflectance spectrum using the Kubelka- Munk equation (1) a plot with hv along the x-axis and (K/S hv)^2 along y-axis was plotted (Figure 4-6). The band gap (Eg) for permitted indirect transitions of the detergent material ROL Classic was estimated (Figure 5) [18-21]. Figure 3 showed the diffuse reflectance spectrum of the detergent product ROL Classic. Then K/ S=(1-R)^2/2R was calculated from equation (1) to be 3.067421973. The extrapolation of straight line to (K/S hv)^2=0 axis (Tauc Plot) gave the value of the band gap energy. A line was drawn tangent to the point of inflection on the curve of Figure 4 and the hv value at the point of intersection of the tangent line and the horizontal axis was the band gap value (Figure 5). The band gap energy was estimated to be 1.174117281562370eV for the 400-695nm of wavelength range used (Figure 5,6). An increase in the optical band gap estimated was observed in comparison with a detergent product examined previously [22] where the band gap energy was calculated to be 1.169844690100260eV. The lower energy transition became possible in it because of the formation of trap levels between the HOMO and LUMO energy states. This drop in the energy band gap might be assigned to the band formation between the non-ionic surfactant and the NaO molecule of the colorant, both present in the chromophore molecule of the detergent Dual Power Professional previously examined [20]. In the detergent ROL Classic examined in this work the non-ionic surfactant has been replaced by the molecule of sodium palm kernelate as bearing the chromophore, which is a much smaller molecule, and thus no band formation could take place between that molecule and the NaO of the colorant.
Figure 4: The Tauc plot, i.e., hv versus [K/S hv]^2 graph, of the chromophore present in the liquid detergent product ROL Classic in aqueous solution, for calculating the band gap energy for permitted indirect transitions. Method of band gap energy determination from the Tauc plot. The linear part of the plot was extrapolated to the x-axis.
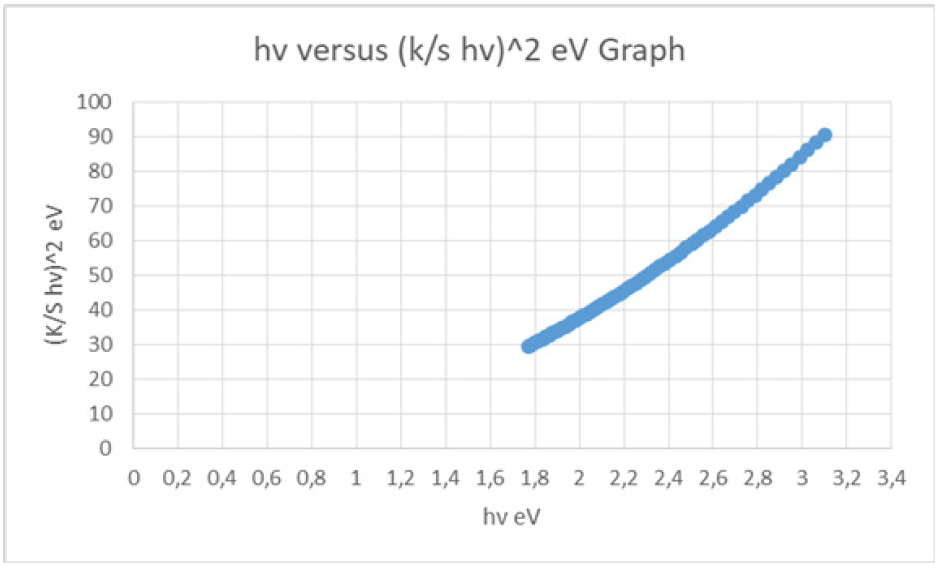
Figure 5: The Tauc plot, i.e., hv versus [K/S hv]^2 graph, for the chromophore present in the liquid detergent product ROL Classic in aqueous solution, for calculating the band gap energy for permitted indirect transitions. Vertical line indicates the position of the optical band gap [17]. The intersection between the linear fit and the photon energy axis gave the value to energy band gap.
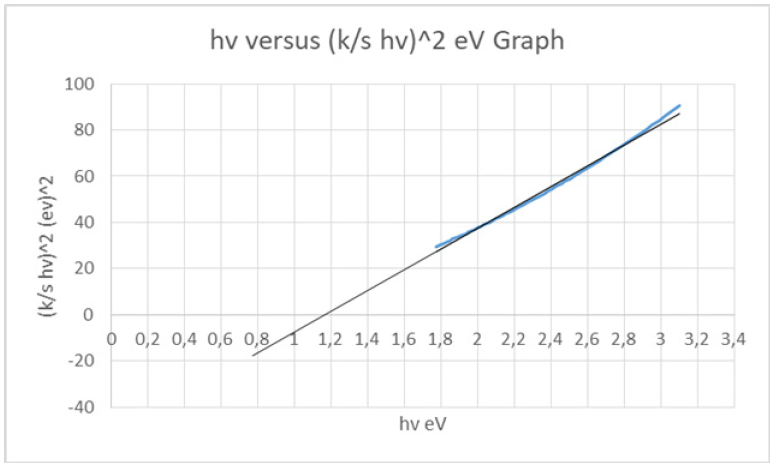
Figure 6: hv versus [K/S hv]^2 graph of the chromophore in the liquid detergent product ROL Classic New in aqueous solution, in IBM SPSS Statistics. Method of band gap energy determination from the Tauc plot. The final part of the plot was extrapolated to the x-axis, indicating the position of the optical band gap.
Moreover, the optical band gap value could be associated with the number of carbon atoms per molecule involved in the chromophore molecule present, through the equation (2)[20]:

where M was the carbon atoms number in the carbonaceous cluster of the chromophore molecule. The M value for the molecules involved in the chromophore in the detergent ROL Classic was calculated to be approximately 43 giving an optical band gap energy of 5.23eV. The increase observed from the band gap calculated by the Kubelka-Munk equation could be assigned to the conjugation increase in monomer units [20] in the chromophore with the NaO molecule of the colorant CI 42051:2. Respectively, the M value for the molecules involved in the chromophore in the detergent Dual Power examined previously [22] was calculated to be 32 giving an optical band gap energy value Eopt of 6.06eV, which is higher than 5.23eV calculated for the detergent ROL Classic. Again, this increase, found here, could be assigned to extensive conjugation in monomer units in the chromophore in the former detergent product Dual Power professional [22].
Urea, also present in the liquid detergent product ROL Classic, could have formed the base of a singly resonant optical parametric oscillator (OPO) for the visible light [23,24]. Urea had also a carbonyl group which contributed also as chromophore in the ROL Classic detergent. Τhe M value, as mentioned above, was calculated to be then 44 giving, according to equation (2), an optical band gap energy of 5.17eV. The (OPO) might have been a source of coherent light tunable over wider spectral regions. Luminescence originating from transitions in this laser pulse could be induced by photon energies far below the band gap of the material thus expanding the energy band gap of the sample detergent product ROL Classic [25] to 1.174117281562370eV. Because of urea present, the band gap may have become larger than in previous detergent products [22,25]. The pH measurement was used also in this work to characterize the detergent as semiconductor as before [22], relating the change in the pH from 7.45 to 8.99 to the increase of the optical band gap. This increase in pH level of the detergent ROL Classic and the solution effect on the aggregation of its constituent molecules and the resulting reduction of grain size of them in its solution, may have led to the higher value of band gap from 1.169844690100260eV [22] to 1.174117281562370eV. Thus, by tuning the pH of the detergent, in future work, an appropriate band gap of semiconductor with usability in solar cells could be achieved [26].
Periodogram of hv eV by frequency and Periodogram of (K/S hv)^2 by frequency
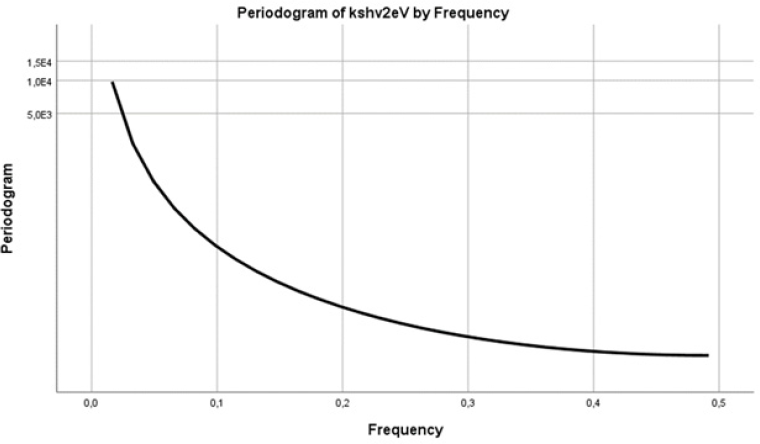
The values of a periodogram were recovered as a test statistic that allowed us to calculate how likely was the hypothesis that the data of the series hv eV contained a signal of a given frequency f [27,28]. A periodogram was used, as part of a univariate analysis, to identify periodic behavior in two time series (Figure 7,8). We searched for periodicities in our data of hv eV and also of (K/S hv)^2. Here the smoothed periodogram with the Hamming spectral window had no significant peaks in the frequency band for both series (Figure 7,8). There were no dominant periods, or frequencies, in the time series examined.
Figure 7: The Hamming spectral window of the periodogram had no significant peaks in the frequency band except for the main one at f=0 [27]. The series was hv eV.
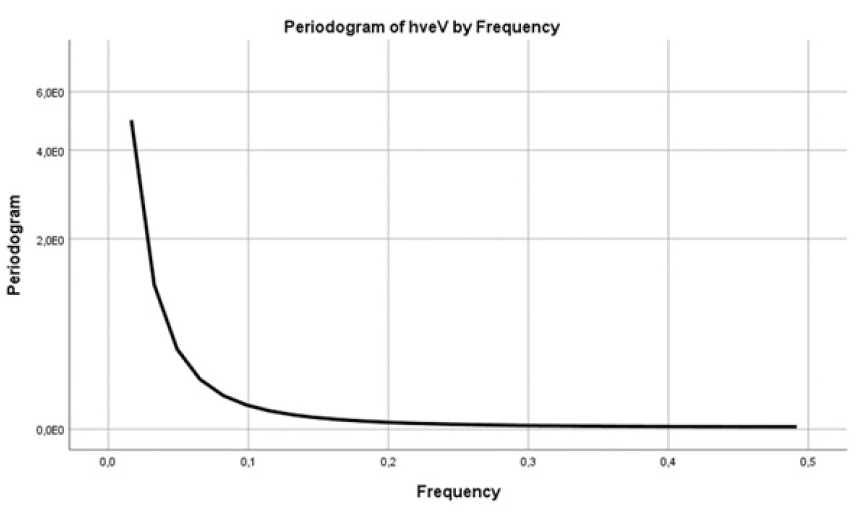
Figure 8: hThe Hamming spectral window of the periodogram had no significant peaks in the frequency band except for the main one at f=0 [27]. The series was [K/S hv]^2.
Conclusion
Conclusion We have presented in this work a simple method for the determination of band gap energy of the detergent product ROL Classic New, a commercial product, by diffuse reflectance spectra using Kubelka-Munk theory. The detergent product ROL Classic New, a handwashing product, has been examined for its anionic active matter content. It’s soluble matter ethanolic and insoluble matter ethanolic were depicted by FT-IR. The diffuse reflectance spectrum of the detergent was used to estimate the band gap energy of the liquid detergent, which is a significant factor for semiconducting materials. These novel optical properties of liquid detergents may be potentially useful for technological applications. The band gap was calculated by plotting the graph of the (K/S hv)^2 versus energy hv, where the straight line touching the energy axis from the straight segment of the graph gave the band gap. An effort was made to associate the carbonaceous cluster of the chromophore present, to an arithmetic calculation of the band gap. Components of the detergent ROL Classic examined, like a urea molecule, could contribute to a larger band gap estimated. Moreover, a wide band gap consists one of the novel properties of semiconductors and was related here to an increase in pH value of the solution of the detergent. At last, the periodogram was determined also as part of a univariate analysis and showed no peaks in the frequency band. The FTIR method and the Reflectance graph were thus straightforward, precise methods to the characterization of commercial products of detergent samples. We continue to apply the FTIR method to new products of liquid household detergents.
References
- Kai C, Zhi Sheng K, Newton Well L, Wei Jie T, Nishanth G (2020) Design and performance optimization of detergent product containing binary mixture of anionic-nonionic surfactants. Heliyon 6(5): 03861.
- Pilleriin Peets, Karl Kaupmees, Signe Vahur, Ivo Leito (2019) Reflectance FT-IR spectroscopy as a viable option for textile fiber identification. Herit Sci 7(93): 1-10.
- Harry Hecht (1976) The Interpretation of diffuse reflectance spectra. Journal of Research of the National Bureau of Standards-A. Physics and Chemistry 80(4): 567-583.
- Sergej Bock, Christian Kijatkin, Dirk Berben, Mirco Imlau (2019) Absorption and remission characterization of pure, dielectric (nano)powders using diffuse reflectance spectroscopy: An end-to-end instruction. Appl Sci 9(22): 4933.
- Samaneh B, Zainal Abidin T, Mohd Zobir H, Abdullah Ahmed (2014) Optical and thermal properties of Zn/Al-layered double hydroxide nanocomposite intercalated with sodium dodecyl sulfate. J Spectrosc 467064: 1-10.
- Imtiaz Ahmad, Suhail Serbaya, Ali Rizwan, Malik Sajjad (2021) Spectroscopic analysis for harnessing the quality and potential of gemstones for small and medium-sized enterprises (SMEs). J Spectrosc 6629640: 1-12.
- Patrycja Makula, Michal Pacia, Wojciech Macyk (2018) How to correctly determine the band gap energy of modified semiconductor photocatalysts based on UV-Vis spectra. J Phys Chem Lett 9(23): 6814-6817.
- Zhi-Ping L, Milton Rosen (1981) Two-phase mixed indicator titration method for the determination of anionic surfactants. Ana Chem 53(9): 1516-1519.
- Lawrence Wang, Pedro Panzardi, William Schuster, Donald Aulenbach (1975) Direct Two-phase titration method for analyzing anionic nonsoap surfactants in fresh and saline waters. J of Environmental Health 38(3): 159-163.
- Sargent EH (2005) Infrared quantum dots. Adv Mater 17(5): 515-522.
- DIN EN 1262:2004-01 (2004) Surface active agents-determination of pH value of solutions or dispersions, pp. 1-8.
- Robert M Silverstein, G Clayton Bassler, Terence C Morril (1963) Spectrometric identification of organic compounds. In: (4th edn), John Wiley & Sons, USA.
- P Kubelka, F Munk (1931) A contribution to the optic of the paint strokes. Z Tech Phys 12: 593-601.
- ISO 2470-1 (2016) Paper, board and pulps-measurement of diffuse blue reflectance factor-Part 1:Indoor daylight conditions (ISO brightness), pp. 1-11.
- ISO 2471 (2008) Paper and board-determination of opacity (paper backing)-Diffuse reflectance method, pp. 1-8.
- Guichun Hu, Shiyu Fu, Fuqing Chu, Maohai Lin (2017) Relationship between paper whiteness and color reproduction in inkjet printing. Bioresources 12(3): 4854-4866.
- KV Shportko (2019) Disorder and compositional dependences in urbach-martienssen tails in amorphous (GeTe)x(Sb2Te3)1-x Scientific Reports nature research 9(1): 6030.
- J Tauc, R Grigorovici, A Vancu (1966) Optical properties and electronic structure of amorphous germanium. Phys Stat Sol 15(2): 627-637.
- Sabiu SA, Sadik G, Yuksel K, Ibrahim M, Bala Ismail A, et al. (2016) Simple method for the determination of band gap of a nano-powdered sample using kubelka munk theory. J of NAMP 35: 241-246.
- Alsubaie ASA (2022) Characterization and optical studies of hydroxyethyl cellulose-copper oxide nanocomposites. Journal of Spectroscopy 2022(8422803): 1-9.
- Escobedo Morales A, Sanchez Mora E, Pal U (2007) Use of diffuse reflectance spectroscopy for optical characterization of un-supported nanostructures. Rev Mex De Fis S 53(5): 18-22.
- Chryssou K, Lampi E (2022) Analysis of a detergent product and identification with an infrared absorption spectrum and a reflectance graph. Ann Chem Sci Res 3(2):1-7.
- Mollenauer LF, White JC (1987) Topics in applied physics. Tunable Lasers 59(5): 209-222.
- Zheshuai Lin, Zhizhong Wang, Chungtian Chen (2003) Mechanism of linear and nonlinear optical effects of KDP and urea crystals. J Chem Phys 118(5): 2349-2356.
- Klik MAJ, Gregorkiewicz T (2001) Excitation of Si: Er with sub-band-gap energies. Physica B Condensed Matter 308-310: 348-349.
- Nader G, Parisa S, Gholamhosain H, Seyyede S (2018) The effect of pH on the optical band gap of PbSe thin film with usability in the quantum dot solar cell and photocatalytic activity. J interfaces-thin films low dimens Syst 2(1): 139-147.
- RV Baluev (2008) Assessing the statistical significance of periodogram peaks. Mon Not R Astron Soc 385: 1279-1285.
- Antonio GM, Santiago Segarra, Geert Leus, Alejandro Ribeiro (2017) Stationary graph processes and spectral estimation, IEEE Transactions on Signal Processing 65(22): 5911-5926.
© 2022 Katerina Chryssou. This is an open access article distributed under the terms of the Creative Commons Attribution License , which permits unrestricted use, distribution, and build upon your work non-commercially.
 a Creative Commons Attribution 4.0 International License. Based on a work at www.crimsonpublishers.com.
Best viewed in


.jpg)


 Editorial Board Registrations
 Submit your Article
 Refer a Friend
 Advertise With Us
.jpg)


.jpg)


.bmp)
.jpg)
.png)
.jpg)


.jpg)


.png)

.png)


.png)


