- Submissions

Full Text
Annals of Chemical Science Research
Determination of the Mechanical and Optical Properties of an A4 Copy Paper Sample and Application in the Mechanics of the System of a Linear Second Order Ordinary Differential Equation
Katerina Chryssou*, Maria Stassinopoulou and Eugenia Lampi
General Chemical State Laboratory, B’ Chemical Division of Athens, Department A’ Tsocha 16, 11521 Athens, Greece
*Corresponding author: Katerina Chryssou, General Chemical State Laboratory, B’ Chemical Division of Athens, Department A’ Tsocha 16, 11521 Athens, Greece
Submission: September 16, 2021;Published: September 28, 2021

Volume2 Issue4September, 2021
Abstract
A white Α4 copy paper sample Q-Connect was tested for its tensile and optical properties as well as the fibre component of its pulp i.e., chemical pulp, using the optical microscope. Also, other substrate properties of the copy paper sample were determined i.e. tensile strength 0.32MPa in the machine direction and 0.11MPa in cross direction, tensile index 59.7KN.m/Kg (MD) and 19.7KN.m/Kg (CD), elongation at rupture 1.6% (MD) and 3.9% (CD), brightness 95%, grammage 81.8gsm, the band gap energy and finally application in the mechanics of the system of a linear second order ordinary differential equation was implemented on the dry paper strips used for determining its dry tensile strength. The band gap energy Eg for permitted indirect transitions was estimated as 1.16984469010026eV. The differential equation of the motion of the body was solved and the removal of the body at the moment t was found to be 0.01333*exp(-2.0*t) *(15.0*cos (6.708*t) +4.472*sin (6.708*t)).
Keywords:Cellulose; Optical microscope; Tensile strength; Absorption spectra; Kubelka-Munk K/S value; Band gap energy; Ordinary differential equation
Introduction
Structure and mechanical as well as optical property relationship of the cellulose molecule in paper has been investigated before [1]. In recent years, with the development of computational physics and chemistry, theoretical results are often used to explain the experimental results or predict the behavior of mechanical systems [2]. Three key properties of paper samples are the tensile strength, elongation at rupture and tensile index. In this work a fibre furnish analysis was carried out under the optical microscope to determine the fibre component of the pulp of an A4 copy paper sample quantitatively. The Herzberg staining test was applicable to the qualitative and quantitative differentiation between chemical, mechanical and rag pulp. The tensile property of the dry copy paper sample was carried out using a Zwick-Roell Z.2.5 machine with a 2.5KN load cell. Pre-conditioning and conditioning of the paper test specimens’ strips ware applied before and during the testing. The mechanical property of the A4 copy paper sample was analyzed [3].
The mechanical properties such as tensile strength and elongation at rupture are necessary for producing paper products and plastic products and evaluating their reliability [4]. The tensile strength was calculated by dividing the maximum force by the cross-sectional area A of the paper 15mm strip of the copy paper sample. The mean tensile strength and the standard deviation were calculated also. Second order differential equations appear frequently in the applied sciences. Examples of that are the mass movement under the action of a force, problems of orbital dynamics, electrical circuits, mechanical oscillators, or in general, any problem involving Newton’s second law [5]. This work deals with a special ordinary differential equation (ODE) implemented for the strip of a copy paper sample, in the MATLAB R2020a computing environment [6]. The purpose of it was to propose a mathematical model. Many of the forces that we use in Newton’s second law yield linear second order ODE’s like the damped driven harmonic oscillator.
mx’’=-K(x(t)-a)-bx’(t) +F(t) (1)
There are “exact solutions” to these, and we use those to test our numerical method. The differential equation itself is only part of the physical problem. We also provide initial conditions or boundary conditions. For the second order differential equation like Newton’s second law [7,8] we must give two constants and we typically associate those with the position and velocity at time t=0, so we agree to provide x(0) and x’(0). Our observational input might be “the mass was at location a at time t=0, and at location b five seconds later” which would amount to giving x(0)=a and x(5s)=b. The latter case is called a “boundary value” formulation of the problem of motion. We can provide the position at time to and velocity at time T. In the end, the general constants of integration can be set with a variety of physical inputs when we write a solution for the simple harmonic oscillator as:
x(t)=A cos(ωt)+B sin(ωt) (2)
and we can set A and B however we like.
Experimental
Materials and Methods
Reagents
All the chemicals used were of analytical reagent grade quality and they were used without further purification. Solutions were prepared using deionized water of conductivity <1μS/cm. Zinc chloride for analysis (250g) was procured from M EMSURE (M.W.136.30g/mol). Potassium Iodide for analysis (250g) was procured from M EMSURE (M.W. 166.00g/mol). Iodine, IODIO BISUBLIMATO (100g) was procured from Carlo Erba (Cod. 455959). Calcium chloride anhydrous (M.W. 110.99g/mol) QP desiccant was procured from Panreac (1000g) (Code 211221.1211). Ordinary laboratory equipment such as beakers of capacity 100ml, and glass cylinders of capacity 100ml were used.
Apparatus
The microscope used was a projection optical microscope SDL S.N., 232431, 220V, 60W, S1 with a round screen and no binoculars, and with a magnification of x10/0.2 to x20/0.4. The microscope slides used were of size 25mmx75mm. Rectangular microscope cover glasses of size 22mmx33mm were also used. An ultrasonic disperser was used to prepare the paper fiber suspension. A dropper, which was a glass tube of 100mm in length and with an internal diameter 5mm with one end carefully smoothed and the other end fitted with a rubber bulb, which discharged 0.5ml of paper fibre suspension onto the microscope slides. Absorption spectra were obtained also by means of a Spectrophotometer CM- 3630, BCMTS M Type 40605, S.N. 43029, Touch Screen-M V 2.0, Frank-PTI. The spectrophotometer CM-3630, Model BCMTS M Type 40605, had a software Touchscreen M. Weighing’s were carried out on an electronic balance Sartorius Basicplus, AG Göttingen Germany BP 221S, with maximum capacity 220g, precision of four decimal places, and accuracy to 0.1mg and it was accreditated every three years.
A tensile testing machine Zwick Roel was used which extended the paper test pieces of dimensions 15mm x 210mm at 20mm/min constant rate of elongation and measured the maximum tensile force. It had a strength force of 2.5KN. The machine had a long stroke extensometer placed directly on the paper test piece for the measurement of its elongation. The machine was connected with a computer LG and was accreditated every three years. The tensile testing machine included two clamps for holding the paper test piece of 15mm width. The clamps grab the test pieces firmly along a straight line across the full width of the test piece and adjust the clamping force pneumatically. A guillotine was used for cutting the paper test pieces to dimensions of 15mmx210mm.
An accreditated ruler for measuring the width of the paper test piece and also of measuring the rate of elongation was used. A conditioning chamber, that was capable of providing and maintaining standard conditions of temperature and humidity, where the paper test pieces were pre-conditioned at 23 °C ± 2 °C and 30% r.h ± 5% r.h and were conditioned at 23 °C ± 1 °C and 50% r.h ± 2% r.h and was accreditated each year.
Preparation of Herzberg stain
We weighed 50g of ZnCl2 into a 100ml glass beaker and we added 25ml of deionized water. We then weighed 0.25g of I2 and 5.25g of KI into another 100ml glass beaker and we added 12.5ml of deionized water. We then stirred the contents of the two beakers with glass rods until dissolved and we transferred the two solutions to a glass cylinder of 100ml capacity and we stoppered the cylinder. We shaked the cylinder well to mix the solutions and finally left it overnight away from light and air, in the dark, so that the precipitate formed settled. After 24 hours we decanted the clear solution into a brown dropper bottle with a ground-glass stopper and we kept it away from air and light in the dark.
Preparation of the copy paper fiber suspension
The paper fiber suspensions were prepared in the ultra-sonic disperser by putting the test paper pieces of the copy paper sample, of size approximately 1cmx1cm and adding 400ml deionized water. The paper pulp was homogenized in a Waring commercial blender (mixer) setting low and high for 3 minutes.
Staining and preparation of fibre slides for optical microscopy
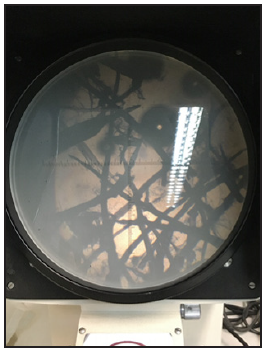
We put 1ml of the paper fiber suspension on to the microscope slide and we dried the slide with the suspension onto it, for 10 min in the oven memmert direct controlled at 103 °C ± 2 °C. As the slide with the suspension was hot from the oven, we stained the fibres of the paper sample by applying 3 drops of the Herzberg stain onto the fibre slide. We then put three (3) rectangular microscope cover glasses onto the glass microscope slides with each of the paper fiber suspensions on them. We placed the stained fibre slides under the optical microscope and we examined them using a magnification of x10/0.2 to x20/0.4. The microscope was equipped with a mechanical stage and crosshair and a central dot. For the illumination we used a normal vacuum lamp with daylight filter, namely a Halostar UV-stop OSRAM lamp (>500 °C) with barcode 4050300324432 made in Germany as shows in Figure 1. We identified the fibers as chemical pulp and we counted the fibres on the basis of the bluish-violet colour developed by the Herzberg stain [9-11].
Figure 1:The A4 copy paper sample Q Connect consisted of chemical pulp i.e. cellulose, since the color of the stained specimen in the optical microscope was dark bluish-violet. The microscope used was a projection optical microscope SDL S.N., 232431, 220V, 60W, S1, with a round screen and no binoculars, and with a magnification of x10/0.2 to x20/0.4.
Sampling
Sampling from a lot was in accordance with the relevant ISO 186 [12], for paper. For the determination of tensile strength 20 test pieces were prepared for each direction of the paper (machine and cross direction) and they were selected that they were representative of the sample copy paper A4 received. Each test piece was cut with the guillotine and it had dimensions 15mmx210mm. Rubber gloves were used, clean and dry for the handling of the paper test pieces during their preparation.
Procedure
The specimens of the paper used for determining the tensile strength were pre-conditioned and conditioned in a conditioning chamber that was capable of providing and maintaining standard conditions of temperature and humidity. The paper test pieces were pre-conditioned at 23 °C ± 2 °C and 30% r.h. ± 5% r.h and were conditioned at 23 °C ± 1 °C and 50% r.h. ± 2% r.h. The chamber was accreditated each year. The test pieces were kept in the conditioning atmosphere throughout the test of the tensile strength. The paper strips of the test pieces were handled carefully using rubber gloves during the test. The clamps of the tensile machine were adjusted to the initial test length of 180mm and then the test pieces were placed in the clamps. The test strips were aligned and tightly clamped so that there was not any observable slack but also, they were not placed under significant stress. The test pieces were clamped in a manner that it was parallel to the direction of application of the tensile force. The test was commenced and continued until the test piece broke. The maximum tensile force exerted to it was recorded to the computer connected to the tensile machine. Twenty test strips were tested in the machine direction (MD) and twenty in the cross-direction (CD) until ten valid results were obtained in each direction. The samples which had broken near the edge of the clamps were excluded from the analysis. The test machine held the test strip in the vertical position. The results were calculated by the computer separately for the machine and cross-directions. The computer evaluated the maximum tensile force for each test piece. Finally, the mean maximum tensile force was calculated and expressed in kilonewtons per meter.
Test pieces were prepared for each one of the methods used in this work. The test pieces were always representative of the sample available. ISO 1924-2 [13] was applied for the method of the determination of tensile strength of the paper sample. ISO 2470- 1 [14] sets the procedure used for determining the brightness of paper. The pre-conditioning and conditioning of the paper samples was done according to ISO 187 [15] because the properties of the paper depended on the atmospheric conditions. Here the pulp of the copy paper sample was identified as chemical i.e., cellulose. The chemical pulp of the A4 copy paper sample consisted of 24%w/w softwood fibers i.e., wide long fibers with round ends and 76%w/w hardwood fibers i.e., narrow short fibers with pointed ends (Figure 1).
Results and Discussion
Tensile properties
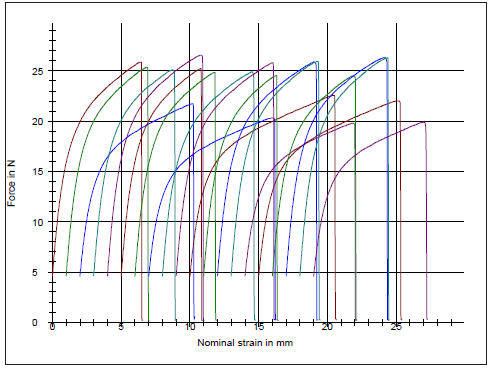
The mechanical property of the A4 copy paper sample was mainly dependent on the strength of the cellulosic fibers used in the production of its chemical pulp. The tensile strength was the maximum stress until the fiber network of the paper sample broke and it was dependent on the degree of fiber-fiber bonding. The A4 copy paper sample was as usual stronger in the machine direction (MD) than in the counter machine direction (CD) direction in tension. The copy paper manufactured on the paper machine, had more fibers oriented in the machine direction than in the cross direction. In general papers have different properties in the machine and the cross direction. The A4 copy paper sample had a tensile index 59.7KN.m/Kg lengthwise (MD) and 19.7KN.m/Kg crosswise (CD). The grammage of the A4 copy paper sample was 81.8g/m2 [16]. The elongation at rupture of the dry A4 copy paper sample was 1.6% lengthwise (MD) and 3.9% crosswise (CD) (Figure 2,3).
Figure 2:Tensile force of the dry A4 copy paper sample strips along the machine direction (MD) as a function of the strain of its paper specimens.
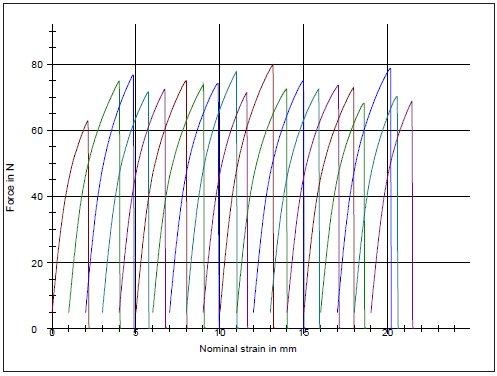
Figure 3:Tensile force of the dry A4 copy paper sample strips along the counter machine direction (CD) as a function of the strain of its paper specimens.
In Table 1 the tensile strength in KN/m for the copy paper sample in the dry conditioned state is presented, as well as its expanded uncertainty. In Table 2 the tensile strength in MPa for the copy paper sample in dry conditioned state is presented as well as its expanded uncertainty. Calculation of Kubelka-Munk K/S value for the A4 copy paper sample (absorption coefficient/ scattering coefficient ratio). The optical property of the copy paper sample was examined using a UV-visible Spectrophotometer at room temperature. The K/S ratio for the A4 copy paper sample was found K/S=46.63024934 and the reflectance ISO brightness used was measured 95.25%. The ISO brightness [14] measured was the numerical value of the reflectance of the copy paper sample at 457nm, blue light reflectance.
In this work the Kubelka-Munk theory was used for predicting the optical properties for the A4 copy paper sample. As known the Kubelka-Munk theory is based on the assumption that the interaction between the diffuse light and the paper material can be described in terms of two fundamental optical constants. The specific scattering coefficient (S) and the specific absorption coefficient (K). The Kubelka-Munk theory holds strictly for homogeneous materials only, and it works well here for the copy paper sample containing chemical pulp. The equation of Kubelka-Munk used above is K/S=(1-R∞)2/2R∞ (3) where K is the absorption or coefficient of reflectivity and S is the coefficient of light scattering; R∞ is the observed reflectivity for monochromatic light.
Estimation of the band gap energy Eg from the DRS studies of the A4 copy paper sample
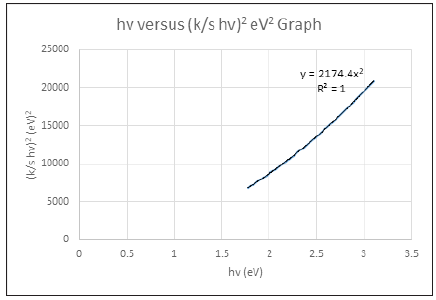
A graph was plotted of (k/s hv)2 versus hv. The extrapolation of straight line to (k/s hv)2=0 (4) axis (Tauc Plot) gave the value of the band gap energy (Eg). The estimation of the band gap energy was performed from the DRS (Diffuse reflectance spectra) study. The band gap energy (Eg) of the chromophores, i.e., colored compounds, present in the cellulose matrix was estimated as 1.16984469010026eV for permitted indirect transitions [17], or 1.874091193540630E-19 Joules, for the A4 copy paper sample. The band gap energy was calculated from the function trend in the excel spreadsheet with the data calculated for the whole range of wavelengths 400-700nm (Figure 4).
Figure 4: (k/s hv )2 versus hv graph of the cellulosic chromophores i.e., C=O group and double bonds, in the copy paper sample consisting of 100% cellulose, for the calculation of band gap energy for permitted indirect transitions n=2.
Application in the mechanics of the system of a linear second order ordinary differential equation, for finding the removal x and the energy loss of a body bound in the dry strip of the A4 copy paper sample. Suppose we have accepted that the body of mass=100gr was attached to the spring constrained to oscillate along the x-axis i.e. horizontally, here the copy paper sample strip of dimensions 210x15mm, and with constant k=4.9KN/m lengthwise, which was the tensile strength of the dry copy paper sample, then this body may have felt the damping force F=-0.4v (5) at the moment t=0 starting from position x (starting with position equilibrium)=20cm=0.2m where v its velocity.
The differential equation of the motion of the body (Newton’s second law) was:
mx’’(t)=-kx(t)-bx’(t) (6)
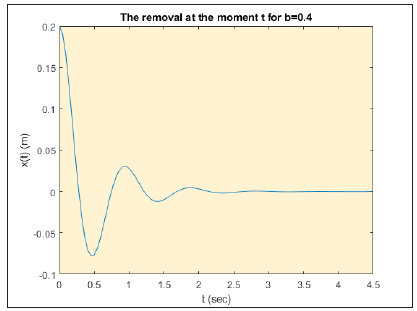
We solved the differential equation (6) for b=0.4 and x0=0.2m and we had the removal of the body at the moment t, as in Figure 5 as:
0.01333*exp(-2.0*t)*(15.0*cos(6.708*t) + 4.472*sin(6.708*t)) for b=-0.4. (7)
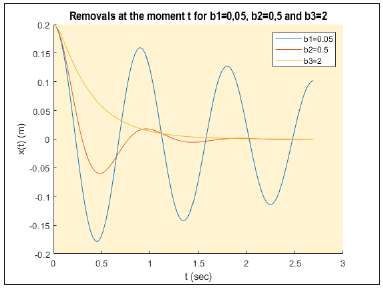
We also calculated the energy loss in the period of the first period: ‘The energy loss in the first period was 0.0957 J’. The energy loss is the work done by the damping force. And we calculated the energy loss in the period of the second period: The energy loss in the second period was 0.0023 J’. We then graphically calculated the removals x(t) of the body at the moment t when the damping force F=-bv and for b1=0.05, b2=0.5 and b3=2.
Also, we solved the differential equation (7) for b1=0.05 and x0=0.2m and we calculated the removal of the body at the moment t, as in Figure 6 to be also:
Figure 5:The graphical representation of the removal of the body at the moment t, and when the damping force is F=-0.4v
0.01333*exp(-2.0*t)*(15.0*cos(6.708*t) + 4.472*sin(6.708*t)) (7)
Then we solved the differential equation (6) for b2=0.5 and x0=0.2m i.e.
>> de=m*diff(x,2)==-k*x-b*Dx;
>> x2(t)=dsolve(de,x(0)==x0,Dx(0)==0);
And we calculated the removal of the body at the moment t, as in Figure 6, to be also:
Figure 6:The graphical representation of the removal of the body at the moment t, and when the damping force is F=-0.05v and also F=-0.5v and finally F=-2v.
0.01333*exp(-2.0*t)*(15.0*cos(6.708*t) + 4.472*sin(6.708*t)) (7)
Similarly, for b3=2 we calculated the removal of the body at the moment t, as in Figure 6 to be:
0.01333*exp(-2.0*t)*(15.0*cos(6.708*t) + 4.472*sin(6.708*t)) (7)
Figure 7:The code in MATLAB for the solving of the system for the copy sample with the method of a linear second order ordinary differential equation, for finding the removal x and the energy loss of a body bound in the dry strip of the copy paper sample is presented above.

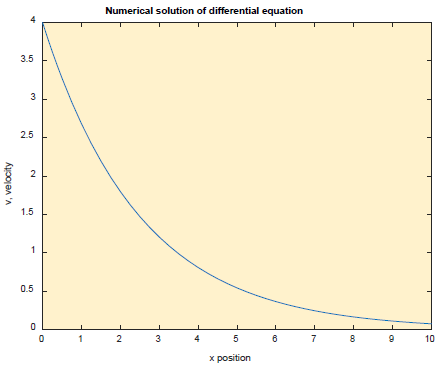
The yellow curve in Figure 6 approaches the equilibrium position at a rate that is higher than the under-damped oscillators with the blue and red curves. We plotted a phase diagram (velocity versus position) (Figure 7-9) i.e., v(t) was plotted as a function of the displacement x(t) with the changing variable being time. The phase-space diagram for the damped oscillator shows that the oscillator was losing energy [18]. Position and velocity are related; we know that the total energy of the system is conserved. The area enclosed by a phase trajectory is a conserved quantity for conservative systems, an oxymoron if ever there was one [19].
Figure 8: The code in MATLAB for the solving of the system for a copy paper sample with the method of a linear second order ordinary differential equation, for finding the velocity v versus the position x of a body bound in the dry strip of the copy paper sample is presented above.
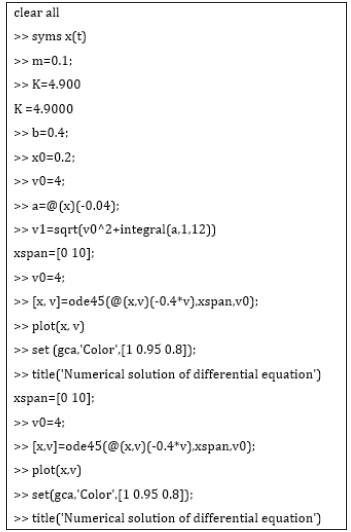
Figure 9:Phase diagram of the body on the A4 copy paper sample strip under damped motion.
Conclusion
In this work we used the optical microscope to examine the cellulose content of an A4 copy paper sample which was identified as chemical pulp using the Herzberg staining test. The role of cellulose was to impart the mechanical property of the paper which was tested with a tensile-strength machine of 2.5KN. The tensile strength of the paper was found 4.9KN/m in the machine direction (MD) and 1.6KN/m in the cross direction (CD). The UV-visible technique was employed to identify the presence of chromophores of the copy paper sample through its absorption spectra, and to confirm the data on its band gap energy. The band gap was calculated as 1.874091193540630E-19 Joules. The cellulosic chromophores are the C=O group with its n-π* transition, and the phenolic hydroxyl group, the phenyl group (C6H5-) and aromatic groups. Chromophores are the functional groups of the molecule responsible for the absorption of light.
Then we calculated above the solution of the system of a dry copy paper sample strip with a body attached to it, an oscillating horizontally problem, involving a linear second order ordinary differential equation. We solved the differential equation and we calculated the removal of the body at the moment t. We also calculated the energy loss of the system in the first period as 0.0957J and the energy loss in the second period as 0.0023J. The phase diagram was also plotted and showed the loss of energy of the oscillating body attached to the paper strip. In this work we employed a solver recommended for non-stiff problems-MATLAB ode45.
References
- Duchemin BJC, Roger HN, Mark PS (2009) Structure-property relationship of all-cellulose composites. Composites Science and Technology 69(7-8): 1225-1230.
- Stefano L, Giuseppe R, Laura R (2013) The dynamical integrity concept for interpreting/predicting experimental behavior: From macro-to nano-mechanics. Philos Trans A Math Phys Eng Sci 371(1993): 20120423.
- Elisabet B, Mikael EL (2006) A study on the difference in tensile strength between industrially and Laboratory cooked pulp. Nordic Pulp and Paper Research Journal 21(2): 222-226.
- Khalfallah A, Bel Hadj Salah H, Dogui A (2002) Anisotropic parameter identification using inhomogeneous tensile test. European Journal of Mechanics A/Solids, 21(6): 927-942.
- Higinio R, Shubham M, Vigo-Aguiar J (2016) A unified approach for the development of k-step block Falkner-type methods for solving general second-order initial-value problems in ODEs. Journal of Computational and Applied Mathematics 318: 550-564.
- Spyridon D, Konstantinos M, Evangelos P (2017) A comparison of ordinary differential equation solvers for dynamical systems with impacts. Journal of Computational and Nonlinear Dynamics 12(6): 1-9.
- Katsikadelis JT (2018) Derivation of Newton’s law of motion from Kepler’s laws of planetary motion. Arch Appl Mech 88: 27-38.
- Schaeffer DG, Iverson RM (2008) Steady and Intermittent slipping in a model of landslide motion regulated by pore-pressure feedback. SIAM J Appl Math 69(3): 769-786.
- ISO 9184-1:1990, Paper, board and pulps-Fibre furnish analysis Part 1: General Method, pp. 1-7.
- ISO 9184-2:1990, Paper, board and pulps-Fibre furnish analysis Part 2: Staining Guide, pp. 1-2.
- ISO 9184-2:1990, Paper, board and pulps-Fibre furnish analysis Part 3: Herzberg staining test, pp. 1-3.
- ISO 186:2002, Paper and board-Sampling to determine average quality, pp. 1-9.
- ISO 1924-2:2008 Paper and board-Determination of tensile properties-Part 2: Constant rate of elongation method (20mm/min), pp. 1-12.
- ISO/DIS 2470-1:2008 Paper, board and pulps-Measurement of diffuse blue reflectance factor Part 1: Indoor daylight conditions (ISO brightness), pp. 1-10.
- ISO 187:1990 Paper, board and pulps-Standard atmosphere for conditioning and testing and procedure for monitoring the atmosphere and conditioning of samples, pp. 1-8.
- ISO 536:1995 Paper and board-Determination of grammage, pp. 1-4.
- Ahmad I, Serbaya SH, Ali Rizwan, Sajjad Mehmood M (2021) Spectroscopic analysis for harnessing the quality and potential of gemstones for small and medium-sized enterprises (SMEs). Journal of Spectroscopy, pp. 1-12.
- Coimbra CFM (2003) Mechanics with variable–order differential operators. Ann Phys (Leipzig) 12(11-12): 692-703.
- DeVries PL (1994) A first course in computational physics by John Wiley & Sons, Inc, pp. 1-424.
© 2021 Katerina Chryssou. This is an open access article distributed under the terms of the Creative Commons Attribution License , which permits unrestricted use, distribution, and build upon your work non-commercially.
 a Creative Commons Attribution 4.0 International License. Based on a work at www.crimsonpublishers.com.
Best viewed in


.jpg)


 Editorial Board Registrations
 Submit your Article
 Refer a Friend
 Advertise With Us
.jpg)


.jpg)


.bmp)
.jpg)
.png)
.jpg)


.jpg)


.png)

.png)


.png)


