- Submissions

Full Text
Annals of Chemical Science Research
Analysis of Paper Surface Profile of Two Matte Paper Samples
Chryssou Κ*, Stassinopoulou M and Lampi E
General chemical state laboratory, Greece
*Corresponding author:Chryssou Κ, General Chemical State Laboratory, Greece
Submission: August 09, 2019;Published: August 13, 2019

ISSN : 2688-8394 Volume1 Issue4
Abstract
The conversion equation G3=(18,65/TB1/3) (1), where G3 is the PPS roughness, and TB is the Bekk smoothness, is used in this work to calculate the Bekk type smoothness for a Sappi Galerie brite bulk paper, from its PPS roughness values already measured. Also, some values of PPS roughness larger than the inverse of a cube root of Bekk type smoothness were measured for an MWC UPM matte paper using the same instruments. More physical, optical and chemical substrate data of the two papers are also measured and presented. Finally, it is shown a regression analysis between the two papers PPS roughness and gloss.
Introduction
In this work, two kinds of matte or dull paper, Sappi Galerie brite bulk and MWC UPM paper [1] are selected to represent the low and high levels of paper roughness. Generally, the air-leak smoothness testing generates a value in a short period of time and this accounts to a great extent for the popularity of this method. In practice, paper roughness is commonly determined by measuring the air flow between the paper surface and a reference plane under specified conditions. The Bekk, Bendtsen, and Parker-Print-Surf (PPS) are the best-known instruments in this category. Certainly, the first two are used to express the roughness of paper in air resistance (min/ml) or air flow (ml/min) units, but the Parker-Print-Surf instrument provides a value for the roughness R in μm of the surface from the reference plane. It is found that rough sheets of paper due to replication of the sandpaper surfaces differ to a great deal in Bekk type smoothness, but do not show as much difference as it from sample to sample in PPS roughness.
Consequently, the measurement of the thickness [2], and the density (or the specific volume) of paper is complicated by the fact that the surface of the paper is not smooth, therefore, some corrections need to be made for the roughness of the paper samples. The measurement of roughness itself on the other hand is complicated by the fact that the surface of the paper sample is compressible. The roughness decreases under the pressure which is applied when a reference plane is brought into contact with the surface of the paper, so that some attention need to be given to the magnitude of the compressibility of the paper if the structure of paper samples and their properties are to be better understood. The functional relationship between the surface properties of paper and its print quality has not yet been well defined. Primary paper surface variables affect print density and print gloss. It is known that there is a linear relationship between print density and paper surface variables as well as print gloss.
Experimental
Sample preparation
Sappi Galerie brite bulk paper: Sheets of paper A4 size SAPPI Galerie Brite bulk were cut at paper specimens of 100cm x 100cm dimensions and conditioned at 23 °C and 50%r.h. Their grammage was measured 80.4g/sqm, and a specific volume of 1.19cm3/g was calculated.
Medium weight coated (MWC) UPM paper: Sheets of paper dimensions 188,5cmx86,1cm were cut at paper specimens of 100cmx100cm dimensions and conditioned at 23 °C and 50%rh. Their grammage was measured 79.2g/sqm, and a specific volume of 1.17cm3/g was calculated.
Smoothness and roughness measurements Bekk type (Oken) smoothness and PPS roughness were measured. The measurements are made mainly in the center of the different paper specimens prepared. For PPS roughness, Parker print surf tester Messmer-Büchel Model M590 Version 2,62, serial no 0302062, was used; Bekk smoothness tester Frank Prüfgerate GmbH Model no 33512/serial no 41454, power connection 230V/50-60Hz, was used. For Gloss Glossmeter Model T-480A Technidyne, serial no 481313 was used. The experimental procedure for measuring specular gloss of paper is based on the Tappi T480om-85 official test method. The angle of incidence of this method for measuring paper is 75.0o.
Results and Discussion
Experimental relation between Bekk type and PPS type smoothness and roughness measurements
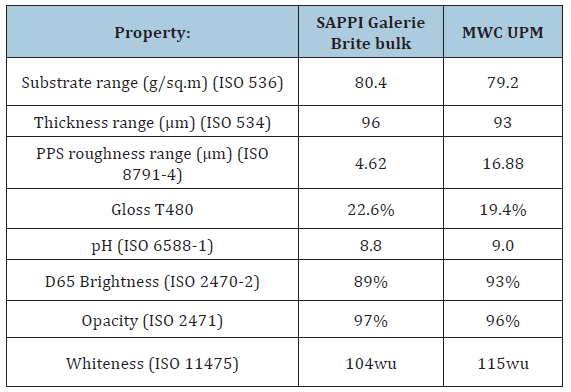
PPS roughness was measured with a hard backing at a pressure of CP2000 (1,96MPa). This PPS pressure was 100 times that of Bekk type (selectable measuring range 50,7-48,0kPa, selectable volume 380ml 1:1). The roughness PPS was found 4.33μm for side A with an S.D. 0.16μm and 4.91μm for side B with an S.D. 0.20μm for the Galerie Brite bulk paper. Accordingly, the air permeance Bendtsen was found 0.11(μm/ (Pa s)) for the Galerie Brite bulk paper. Unexpectedly, there were some values of PPS roughness larger than the inverse of a cube root of Bekk type smoothness for the MWC UPM paper. The PPS roughness was found 16.70μm for side A with an S.D. 1.14μm and 17.06μm for side B with an S.D. 1.63μm for the medium weight coated UPM paper. The Bekk smoothness was found 71.3s for side A and 97.5s for side B of the MWC UPM paper which correspond to 4.49μm and 4.07μm of PPS roughness respectively. If the conversion equation G3= (18.65/TB 1/3) (1), where G3 is the PPS roughness, and TB is the Bekk smoothness, is correct it is strange that the values of PPS roughness are larger for the MWC paper. One possible reason for it is the hardness of the backing material and maybe a pressure of CP1000 (0.98MPa) used. This PPS pressure was 10 times that of Bekk type. Also, the air-permeance Bendtsen was found 0.07(μm/(Pa s)) for the MWC UPM paper, which may correspond to an approximately 3.1μm PPS roughness for the same paper (Table 1).
Table 1: Substrate details.

The Galerie brite bulk paper consisted of 38%w/w Softwood pulp and 62%w/w Hardwood pulp, while the MWC UPM consisted of 35%w/w Softwood pulp and 65%w/w/ Hardwood pulp.
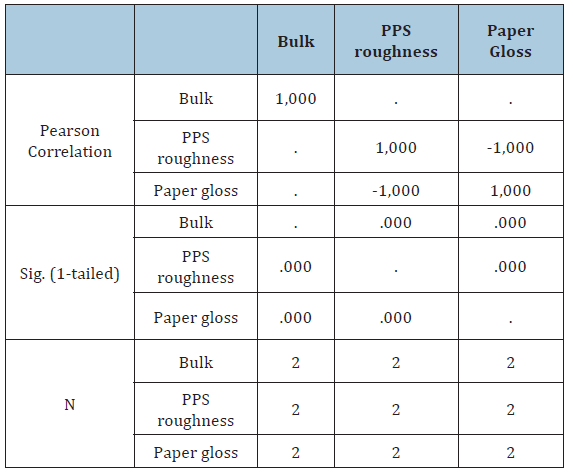
SPSS linear regression analysis for the MWC UPM paper with independent variable the roughness and gloss and dependent variable the bulk of the paper sample.
Table 2: Descriptive statistics.

Table 3: Correlations.

Table 2 and 3 provide the average of each property for the paper sample MWC UPM for the correlation analysis of PPS roughness and paper gloss by using different approaches. Generally, the value of the Pearson correlation coefficient r, lies between +1 and -1. For the r value of -1 the response of paper gloss measured increases as the response of the other variable PPS roughness decreases. We know that if the r value is zero this is an indication of no relationship between the two variables that are being studied.
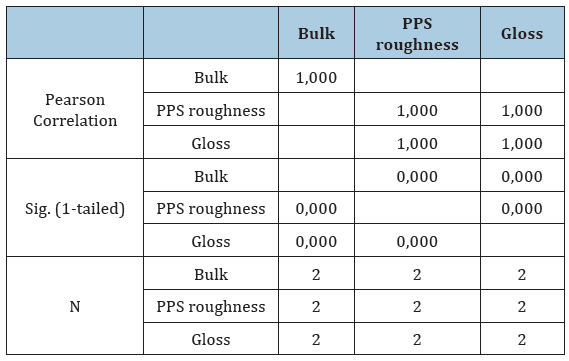
SPSS linear regression analysis for the Sappi Galerie brite bulk paper with independent variable the roughness and gloss and dependent variable the bulk of the paper sample
Table 4: Descriptive Statistics.

Table 5: Correlations.

Table 4 and 5 provide the average of each property for the paper sample Sappi Galerie brite bulk for the correlation analysis of PPS roughness and paper gloss by using different approaches. Generally, the value of the Pearson correlation coefficient r, lies between +1 and -1. For the r value of +1 the response of paper gloss measured increases as the response of the other variable PPS roughness also increases. When the r value is zero this is an indication of no relationship between the two variables that are being studied.
Discussion and Conclusion
As a model of channels for air flow between the paper surface and the metal measuring head of a smoothness tester based on the air leak method, the parker print surf model is more comprehensible than the Bekk model. It is because the PPS model has a single variable, the mean gap, to define the channel shape, although the Bekk model has two variables, the pore length and the pore diameter. One of the two needs to be evaluated to determine the other. In this work the Bekk type smoothness for the Galerie Brite bulk paper, is calculated 79.9s for side A and 54.8s for side B respectively, using equation (1) and PPS roughness measurements. Parker print surf is sensitive to surface compressibility because the clamping pressure is nearly 10 times that of Bekk type. The PPS sensitivity is important in printings, and this may be the reason why PPS is called the printing roughness. Previous data exhibited that the conversion equation applies to many papers except those with different compressibility as the above MWC UPM paper measured.
We conclude here that, commercial coated papers as the Sappi Galerie Brite bulk paper, follow equation (1) well; machine-made base paper for coating do not, mainly because of the compressibility which act differently in the tester at the different clamping pressure and contact area. Paper roughness and paper gloss are also measured in this work since they have a significant effect on the final print gloss of papers. It is found by using linear regression analysis for the paper sample MWC UPM that, there is a pronounced negative correlation between paper gloss and PPS roughness. It is found by using linear regression analysis for the paper sample Sappi Galerie Brite bulk that, there is a pronounced positive correlation between paper gloss and PPS roughness. The r2 (+/-1) is 1 for both papers studied, which implies that the association between paper gloss and PPS roughness accounts for the 100 percent of the total variability, leaving 0 percent for error and for other source of variation.
In the above experiments, where all the calculated values r is close to +/- l, we may be certain that there is a real relationship between PPS roughness, and the paper gloss measured. From the above Table 3 and Table 5 they also indicate that most of the correlation coefficients are high (significance level of correlation coefficient is 0.05), and that it has a great meaning to show a relationship or regression analysis between input variables and output responses. Because most of the correlation coefficients are large, the functional relationship between input variables and output responses greatly exists. In other words, we can draw a regression line to predict gloss by using paper roughness, for gloss coated papers in terms of variance or correlation analysis. This is important to conclude since it is known from the literature that the single paper gloss has also a partially significant effect on the final print gloss of papers.
References
- Bhattacharya A, Bandhyopadhyay S, Green Ph (2016) Characterising coated paper surface for modeling apparent dot area of halftone prints. Opt Express 24(2): 1708-1722.
- Enomae T, Sasaki K, Kim BY, Onabe F (1999) Anisotropy of internal stress related to paper surface roughnening. Proceedings of Tappi advanced coating fundamentals symposium, Tappi press, Atlanta, USA, pp. 133-145.
© 2019 Chryssou Κ. This is an open access article distributed under the terms of the Creative Commons Attribution License , which permits unrestricted use, distribution, and build upon your work non-commercially.
 a Creative Commons Attribution 4.0 International License. Based on a work at www.crimsonpublishers.com.
Best viewed in


.jpg)


 Editorial Board Registrations
 Submit your Article
 Refer a Friend
 Advertise With Us
.jpg)


.jpg)


.bmp)
.jpg)
.png)
.jpg)


.jpg)


.png)

.png)


.png)


