
- About Us
- Information
-

The Author ensures that the research has been conducted responsibly and ethically with adherence to all relevant regulations. read more..
- For Authors
- For Reviewer
- Manuscript Guidelines
- Membership
- Publication Ethics
-
- Journals
- Reprints
- e-Books
- Videos
- Policies
- Contact Us
 COVID-19
- Submissions


Full Text
Advancements in Civil Engineering & Technology
Correlation of Apparent Electrical Resistivity with Elastic Moduli and Soil Shear Strength Parameters in Yenagoa, Southern Nigeria
Akinshipe RB1, Okiongbo KS1* and Akpofure E2
1Geophysics Unit, Department of Physics, Niger Delta Universitty, Wilberforce Island, Bayelsa State, Nigeria
2Department of Geology, Niger Delta University, Wilberforce Island, Bayelsa State, Nigeria
*Corresponding author: Okiongbo KS, Geophysics Unit, Department of Physics, Nigeria
Submission: September 03, 2020;Published: September 30, 2020

ISSN: 2639-0574 Volume4 Issue3
Abstract
Many published correlations between soil electrical resistivity with soil strength parameters are limited to site-specific qualitative correlations between geoelectrical and geotechnical data. The absence of site-specific quantitative transforms for resistivity and various geotechnical test results such as CPTu do not allow the prediction of geotechnical parameters via geoelectric data. Thus, establishing a correlation between soil electrical resistivity and soil strength parameters, which can be applied in shallow soil strength prediction, would be a significant advance for engineering practice. In this study, field tests consisting of vertical electrical sounding (VES) and CPTu data acquired at the same location were analyzed and correlated to develop empirical models. At selected depths, we collected the apparent resistivity variation with depth and correlated with the soil strength parameters such as shear modulus, Young’s modulus, bulk modulus, undrained shear strength and friction angle derived from the CPTu data at the same location. Least square regression method was used to evaluate the relation between apparent resistivity and the different soil strength parameters. Linear curve fitting approximations were applied. The results show that apparent electrical resistivity has a good correlation with soil strength parameters with coefficient of correlation ranging between 0.4-0.7. The empirical models were validated by predicting the soil strength parameters. The measured and predicted values show a good correlation and thus affirm the applicability of the proposed empirical models.
Keywords: Apparent resistivity; Elastic moduli; Soil strength parameters; CPTu; Correlation; Yenagoa
Introduction
Within shallow depths of engineering significance (0-40m), the Niger Delta is characterized by saturated loose cohesive soils such as clay, silt and silty-clayey sands. These soil types are inherently weak and compressible in their foundation characteristics. These soils are prone to differential settlement and exhibit engineering properties that dependent on season [1]. These soils are thus generally considered to be incompetent and inadequate to bear foundation for sensitive structures. Thus, designing suitable and safe foundations for sensitive structures in the Niger Delta requires a proper understanding of the soil strength indices. Soil strength indices are important in determining the competence and stability of the earth geomaterials. Knowledge of soil strength indices gives information on the ability of the soil to withstand stress and strain emanating from overburden, swelling, cracking and other anthropogenic activities [2]. Inadequate information about the soil and the subsurface geomaterials, poor and inadequate foundation design, and poor building materials are key factors responsible for foundation failures [3]. These factors coupled with the nonlinear behavior of soils under load, and the difficulty in determining soil properties in in-situ condition, can lead to structural damages that are often accompanied by dare consequences. Thus, there is need to determine these proprieties for proper engineering foundation planning and management. Determination of soil competence for foundation studies normally assists civil engineers in the design of appropriate foundation of civil engineering structures [4-6].
Soil competence information is usually obtained from geotechnical data derived either from drilling, Standard Penetration test (SPT) or Cone Penetration Test (CPT). This often involves in-situ field tests, drilling, sample collection and analysis in the laboratory. Parameters often determined include liquid limit, plastic limit, plasticity index, shear strength and particle size analysis etc [7]. Using the cone penetration test (CPT) sounding, commonly measured parameters include cone tip resistance (MPa), sleeve friction (MPa), friction ratio (%) etc. These parameters are subsequently converted to soil engineering parameters useful in foundation design such as undrained shear strength, shear wave velocity, soil behavior index, shear modulus, bulk modulus etc. However, these tests are point measurements, time consuming, expensive and done at widely spaced intervals. Thus, sometimes critical points in terms of thickness and strength of the foundation bed are sometimes by passed.
Recently, geophysical method especially the geoelectrical resistivity technique is frequently been used as an advanced soil testing and characterization tool with proven spatial resolutions at different scales [8-10] and hence being often used to answer many unresolved geological, geotechnical and structural problems [11-13]. Electrical resistivity is an important parameter as it can be used as a proxy for the spatial variability of other soil physical properties pertinent in geo-engineering such as soil particle structures [14], water contents, or fluid compositions and thus being considered as a popular alternative method in geotechnical soil investigation [15]. The geoelectrical resistivity method is non-invasive, non-destructive, relatively rapid and cost-effective. In spite of the utility of the geoelectrical method, it’s results cannot be directly translated to geotechnical knowledge due to the absence of site-specific suitable transforms. Thus, it is imperative that suitable transforms be developed to predict geotechnical parameters via geoelectrical data. Most recent studies e.g [16-19] show qualitative correlations between geo-electrical and results of geotechnical data that are intended for a particular site. Endres [20] initiated a preliminary attempt to correlate between soil resistivity and dielectric permittivity with mechanical properties obtained from cone penetration test (CPT) data. Gautam [21] attempted to predict SPT profile using correlation of geoelectric and point geotechnical data (SPT). Braga [22] determined the relationship between blow counts N derived from standard penetration test (SPT), chargeability and resistivity and reported no relationship between blow counts and Chargeability. Braga [22] however reported a poor correlation between resistivity and blow count. Deniel and Gemail [23,24] attempted to determine soil engineering properties from electrical resistivity. Cosenza [19] have carried out correlation of geotechnical parameters derived from dynamic cone penetration and in situ vane test and electrical data. This study did not report any clear correlation between cone resistance and resistivity.
The Cone Penetrometer Test (CPT) sounding is an in-situ testing method used to determine the geotechnical soil engineering parameters and in the delineation of soil geo-stratigraphy. In this the method, the Penetrometer cone is gently pushed into the ground while the resistance of the soil to penetration of the cone is continuously recorded with respect to depth. Parameters measured while sounding include the tip resistance (qc), sleeve friction (fs), and pore water pressure (u). Using appropriate formulae, these measurements can be converted to engineering parameters. Presently, no worthwhile efforts to predict geotechnical parameters via geoelectric data has been reported. This study investigates empirically the relationship between apparent electrical resistivity estimated from the vertical electrical sounding data and soil strength parameters estimated from cone penetration test sounding measured at the same point in an attempt to develop site specific transform to predict soil strength parameters using geoelectric data. This prediction method is based on site specific validated regression equations describing actual correlations of geoelectrical and geotechnical data.
Location and Geological Setting of the Study Area
Yenagoa is the capital city of Bayelsa State. It is located within the Niger Delta Basin in the Southern part of Nigeria. The study area is within Yenagoa and environs, an area of about 50km2. The co-ordinates of Yenagoa are longitudes 006° 10´ 3.07ʹʹ and 00 6° 25´ 10.53ʹʹ East of the prime meridian and latitudes 04° 51´ 39.73ʹʹ and 05° .2´ 25.53ʹʹ North of the equator. Yenagoa is situated within the coastal area of the Niger Delta sedimentary basin (Figure 1). There are no pronounced undulations on the surface and but gently slopes is towards the sea [25]. Its mean elevation is about 8m above mean sea level [26]. The area has a tropical rain forest climate characterized by rainy season and dry season. April to October constitute the rainy season with a very brief dry period in August, while November to March is the period for the dry season. The average annual rainfall is about 4,500mm [27] and much of the rain falls during the rainy season. Temperature variation is between 25 and 32 °C. The people are mainly into subsistence fishing and farming.
Figure 1: Map of the Niger Delta showing the study area.

Akpokodje [27] reported that Yenagoa is within the freshwater and meander belt geomorphic unit of the Niger Delta basin. The Niger Delta basin is basically an alluvial plain consisting of different types of Quaternary deposits lying on top thick Tertiary sandy and clayey deltaic deposits. The Quaternary deposits of the near surface are made up of floodplain deposits such as clay, silt, slity-clayey sand. The stratigraphy of the shallow sediments shows a fining up sequence of sand overlain by either silt or clay which indicate a fluvial environment of deposition [28]. Most small and medium civil engineering structures are constructed on the Quaternary deposits which vary greatly both in type and depth. The nature and properties of the sediments are dependent on the types of depositional environment under which they were formed. For instance, large sand to silt deposits are concentrated within point bar depositional environments, while swamp deposits typically consist of widespread sequences of clay to silt overbank sediments [29].
The Benin, Agbada and Akata Formations are the key subsurface Formations reported in the Niger Delta Basin. The Benin Formation is fluvial in origin and is overlain by Quaternary sediments. The Benin Formation is the regional aquifer and is reported to be very porous and highly permeable. The sediments of the Benin Formation are lenticular in places and unconsolidated and is composed of coarse-medium-fine grained sands with localized intercalations of clay/shale. The sediments are poorly cemented and moderately sorted [30].
Materials and Method
Vertical electrical sounding (VES)
The equipment used in this study was a commercially available DC Terra meter SAS 1000 (Abem, Sweden). This equipment is a signal averaging system (SAS) resistivity measuring instrument, with reasonably high sensitivity. The equipment is rugged, portable and user friendly, it has been proven to be very efficient in many site investigations in Nigeria. The power source to the Abem Terra meter was a 12V battery and four stainless steel metal stakes were used as the electrodes. The VES-IP locations and surface elevations were recorded with a handheld Garmin GPS receiver (Figure 2).
Figure 2: Map of study area showing CPT and VES profile locations.

Geoelectrical sounding data were acquired in nine clearly marked out points in Opolo and as well as the Tombia sites (Figure 2). The Schlumberger array was used in acquiring electrical resistivity soundings data. The current electrode spacing AB/2 ranged between 60-80m. The Schlumberger configuration or array is made up of four electrodes often placed in a straight line. Two current electrodes are placed outside while two potential electrodes are placed inside and current was passed into the ground through the two outer electrodes A and B and the voltage difference generated at two inner potential electrodes (C and D) was measured.
If the electrode separation is increased, the depth of probe increases. In this study, the separation (AB/2) of the current electrodes was taken as follows: 1.0. 1.5, 2.0, 2.5, 3.2, 4.0, 5.0, 6.0, 7.0, 8.0, 10.0, 12.0, 15.0, 20.0, 25.0, 30.0, 40.0, 50.0, 60.0, 70.0 and 80.0 m while (MN/2) of the potential electrode is as follows: 0.3, 0.5, 1.0, 1.5, 2.5, 5.0, 7.5, 10.0m. The Schlumberger array are mostly taken in overlapping segments because at each increasing level of the AB spacing, the signal output from the resistivity meter becomes weaker. Therefore, the MN spacing was consequently increased too and two values for the same AB/2 were measured, one for the short MN spacing and the other for the long MN spacing.
The Schlumberger array method was chosen for the data acquisition because of the following advantages (i) This method is faster in acquiring VES sounding data and the data is not influenced by lateral variations (ii) fewer number of operators are required. The positions VES points were also recorded during the survey with a handheld portable GPS receive (Figure 2) receiver. Field precautions taken to obtain good Vertical Electrical Sounding (VES) data quality are (i) the electrodes are pinned to ground firmly (ii) checking for current leakage in the wires and creeps to avoid poor quality measurements.
In the data analysis, the resistivity data was first converted to apparent resistivity (ρa) values and plotted against half-current spacing (AB/2) on log-log scale using the interpex software. Because the data was scattered, the general trend of the graph was used as a guide to carry out filtering in order to smoothen the field curves to reduce the root mean square error. The 1D inversion software used in the data analysis is based on least-squares optimization technique. The program compares the field data to a theoretical model curve. The software would require a starting model, which is usually adjusted until the difference between the field data and the theoretical model curve is reduced to the lowest RMS error. In the data interpretation, maxima and minima points are point of inflexion in the geoelectrical sounding curve and indicates the existence of rock or soil boundaries. The program iteratively changes the resistivities to obtain a best fit with the field data for the layer thicknesses chosen for the model. In the interpretation of geo sounding data, problem of equivalence is highly pronounced [31], information from litholog was used to enhance the quality of interpretation [32]. The obtained layer resistivities represent the average resistivity for the given layer.
Cone penetration test (CPT) sounding
In order to determine in situ elastic moduli of the sub-soil at study sites (Opolo and Tombia), cone penetration tests were also carried out using a Dutch cone penetrometer with a capacity of 10tons. CPTu is a repeatable soil investigation in situ technique that produces a continuous vertical profile of soil and can be used in soft to medium deposits. The procedure followed for the cone penetration tests are in agreement with ASTM D3441 (2016). A total of nine CPT test were carried out at each site. The locations were CPTU soundings were carried out are shown in Figure 3.
Figure 3: Example of CPTu based soil profile at Opolo showing (a) corrected cone tip resistance (b) Sleeve friction (c) Friction ratio (d) pore pressure (e) Soil behavior Index (Ic) to illustrate the soil type description.

The equipment has a cylindrical probe with an area of about 10cm2 and a tip apex angle of 60° and a side friction sleeve with a surface area of 150 cm2. The test involved advancing the 60° steel cone into the ground so as to obtain the degree of compaction or stiffness of the soil. The field operation consisted of balancing the winch frame on the ground by means of two anchors. With these anchors, the CPT system has sufficient power to push the cone into the ground at the rate of 2cm/sec by exerting pressure on the outer sounding tube. As this goes on, parameters such as resistance to penetration, sleeve friction etc. are recorded. Pore pressure was measured through a filter element placed between cone tip and sleeve. The sounding depths range between 4-10m. The tests were terminated at depths where the machine anchors began to pull out of the ground. Parameters recorded by the CPT sounding test include cone resistance, sleeve friction and pore pressure readings. These parameters are usually plotted against depth and displayed (Figure 4). Emplacing the CPT data into empirical equations, the seismic velocities, dynamic elastic moduli including the bearing capacity of the geomaterials in the study sites were determined. Determination of Seismic velocities, and Dynamic Elastic moduli and soil strength parameters from Cone Penetration.
Test (CPTu) sounding
The dynamic elastic moduli and bearing capacity can also be determined using data from conventional geotechnical methods such as Cone Penetration Test (CPT) sounding. Using this method, the dynamic elastic moduli and bearing capacity including the compressional (P) wave velocity and Shear (S) wave velocity can be evaluated using the following established empirical equations.
Shear wave velocity
Using CPT data, the shear wave velocity can be determined using the equation of McGann et al. (2014)
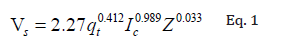
Where qt = corrected cone tip resistance in kPa
Ic= Soil behavior index
Z= depth (m)
The soil behavior index is determined using the equation of [33]
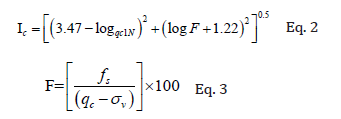
Where
qc1N = normalized cone penetration resistance corrected for overburden stress
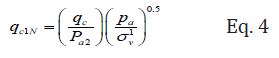
F= normalized friction ratio in percent
qc= cone penetration resistance in MPa
fs= CPT sleeve friction
σv= total overburden stress in MPa
Pa = is a reference pressure in the same units as (i.e Pa = 100kPa if is in kPa)
Pa2 = is a reference pressure in the same units as qc i.e. Pa2 = 0.1 MPa if qc is in MPa
Using the values of the Shear wave velocity, the P-wave velocity can be determined using equation 1.
The relationship between shear wave velocity (Vs) and primary wave velocity (Vp) is expressed as
Vp = 1.7 Vs Eq. 5
Poisson’s ratio
This ratio represents the lateral extension to longitudinal contraction, in other words a measure of the geometrical change in the shape of an elastic body [34]. In fluids, the Poisson’s ratio is 0.5 but for very hard rocks, the Poisson’s ratio is 0. In very hard indurated rocks with anisotropy, negative Poisson’s ratio values can be obtained. The poison’s ratio is expressed by Telford [35].
Poisson’s Ratio
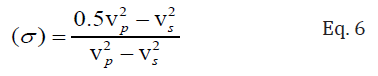
It has the value of 0.5 for fluids and 0.25 for solids, while weak materials have values higher than 0.45. In other words, weak materials possess higher Poisson ratios and vice versa.
Shear modulus
It is represented by μ, which is the ratio between shear stress and shear strain. Shear stress cannot be applied to ideal liquids and gases. For these substances μ=0. Only solids possess the physical properties described by the shear modulus. Using the corrected cone tip resistance (qt) and effective stress values obtained from the CPT sounding, the small-strain shear modulus is calculated using the equation of [36].
Shear modulus
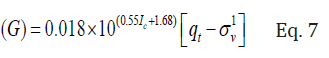
Where qt is the corrected cone tip resistance (MPa) and σ_v^1is the effective stress (MPa)
Young’s modulus
Young’s modulus (E) describes elastic stiffness of soils and rocks and thus is considered as a key parameter in foundation design. Young’s modulus (E) is the ratio of stress to strain. It is a measure of the resistance to elastic distortion. The stiffness which is expressed in terms of Young’s modulus through elastic theory can be estimated using the equation:
E = 2 G(1+σ) Eq. 8
Where σ1 is the poisson’s ratio equal to 0.2. This is used when the conditions are drained i.e. sandy soil. σu is the poisson’s ratio equal to 0.5. This is used when the conditions are undrained i.e. clayey soil, and G is the shear modulus.
Bulk modulus (K)
When a compressive or tensile stress is uniformly applied on a body, the relative change observed in the volume of the body is called bulk modulus. It is giving an idea of the resistance of the substance to compression when load is applied to the substance.
Bulk Modulus,
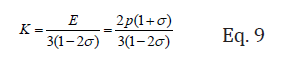
Where E is the Young’s modulus and σ is the Poisson’s ratio.
Determination of soil shear strength parameters from Cone Penetration Test (CPTu) Sounding
Undrained shear strength (Su)
The undrained shear strength is an important parameter and usually determined to estimate deformation and strength of clays [37,38]. On the basis of bearing capacity theory, undrained shear strength can be estimated from CPTu using cone resistance using the following equation for fine grained soils:
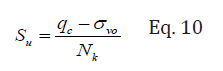
Where
Su = Undrained shear strength
qc = Cone tip resistance (MPa)
σvo= Total in situ vertical stress (MPa)
Nk = is an empirical cone bearing capacity factor given as 10 < Nk < 15
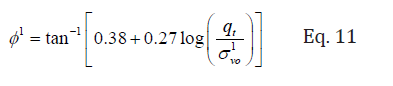
Effective friction Angle (ɸ1)
In this study, the equation of [39] was used to determine the effective friction angle (ɸ1) for non-cohesive soils (silty sand and sand).
Results and Discussion
Figure 3 and 5 show CPTu based soil profiles obtained at the Opolo and Tombia sites respectively, while Table 1 and 2 show values of apparent resistivity, elastic moduli, and shear strength parameters. The apparent resistivity values were derived from VES data and is continuous to a depth of 8.0m, while elastic moduli and the shear strength parameters were derived from CPTu data. The apparent resistivity values show a decrease from 108Ωm at 0.4m to 23Ωm at 2.8m, and then increased to 46Ωm at 8.0m (Figure 3). In the Tombia site, the apparent resistivity values increased from 207Ωm at 0.4m to 1827Ωm at 8.0m (Figure 5). The stratigraphy of the Opolo site between the depth interval of 0-8m consists of clay [40-41]. In the Tombia site, these authors reported that the stratigraphy consists of silty sand between the depth interval of 0-6m but is mainly sand between the depth interval of 6-8m. They concluded that the stratigraphic sequence of Opolo is prevalent in the study area and covers over 80% of the subsurface stratigraphy. The seismic velocities i.e. P- and S-wave velocities vary between 117-301m/s and 69-126m/s respectively in the Opolo site (Table 1) and increase with depth (Figure 3). In the Tombia site, the P and S-wave velocities range between 127-329m/s and 75-160m/s respectively. The seismic velocities in the Tombia site also increased with depth (Figure 4).
Figure 4: Example of CPTu based soil profile at Tombia showing (a) corrected cone tip resistance (b) Sleeve friction (c) Friction ratio (d) pore pressure (e) Soil behavior Index (Ic) to illustrate the soil type description.

Figure 5: Variation of apparent resistivity, seismic velocities and soil strength parameters with Depth at the Opolo site.

Table 1: Summary of Apparent electrical resistivity, seismic velocities, elastic moduli and shear strength parameters at Opolo site.

Table 2: Summary of Apparent electrical resistivity, seismic velocities, elastic moduli and shear strength parameters at Tombia site.

Figure 3 and 4 show the trend of elastic moduli parameters of the subsurface alluvial soil within the depth range of 0-8.0m in the study sites. In the Opolo site, the values shear, young’s and bulk modulus at a depth of 0.4m are 7.9, 32.7 and 14.8MPa respectively. These values gradually increased to 71.4, 214 and 135MPa respectively at a depth of 8.0m. In the Tombia site, the values shear, young’s and bulk modulus at a depth of 0.4m are 9.3, 27.9 and 17.5MPa respectively.
These values gradually increased to 51.2, 153.6 and 96.6 MPa respectively at a depth of 8.0m. The elastic moduli values obtained in this study are consistent with results of elastic moduli carried out in alluvial soil in India reported by Sarkar [42]. The variation of undrained shear strength with depth in the Opolo site is shown in Figure 3. Values of the undrained shear strength deceased from 0.406 MPa at 0.4m to 0.045 MPa at 1.28m, and then increased to 1.262 MPa at 8.0m (Table 1). The profile of the undrained shear strength with depth is slightly similar to that of the apparent resistivity. The decrease in apparent resistivity below 1.0m is due to a resistive dry top soil (dry alluvium) underlain by a conductive material which is wet clay [43]. Between 1.0-3.0m depth corresponding to the zone of wet clay, the undrained shear strength which is a basic parameter for determining engineering suitability of soils also show a decrease, implying a weak zone for foundation. Hosseinpour [44] reported undrained shear strength of <0.02-0.04 MPa for clay I and II from Brazilian Coastal lowlands and described them as soft and less soft clays. Values of undrained shear strength determined in this study in the Opolo site range between 0.045-1.262 MPa. The friction angle in the Opolo site (Figure 3) shows a slight decrease from 49.7 MPa at 0.6m to 36.8 MPa at 2.8m, and then increased to 38.2 MPa at 8.0m. In the Tombia site, the friction angle decreased from 46.5 MPa at 0.4m to 42.7 MPa at 8.0m (Figure 4). The results of similar study by Sultan [45] in the Niger Delta reported values of friction angle to be around 36°.
The main objective of this study is to look into the possibility of determining soil strength parameters such as elastic moduli (e.g shear modulus, young’s modulus, bulk moduli), undrained shear strength and friction angle using apparent resistivity. Apparent resistivity data is used because continuous data within the depth of interest (0-8.0m) exists alongside CPTu at the same location. True resistivity obtained from inversion of apparent resistivity data could not be used for correlation because true resistivity values are average values and thus not continuous. Least squares regression method was used to evaluate the relation between the different soil strength parameters and apparent resistivity.
The results show a linear relationship between apparent electrical resistivity and soil strength parameters (e.g) Shear wave velocity, Shear modulus, Young’s modulus, bulk modulus, undrained shear strength and friction angle (Figure 5 and 6). Also shown in Figure 5 and 6 are the regression equation and the correlation coefficient (R2) determined for each regression. The best fit lines were straight lines for all cases. It is interesting to note that the trend of the curves show that the values of soil strength parameters increase with increase in the apparent electrical resistivity. It is also interesting to discover that the correlation between apparent resistivity and elastic moduli for silty sand shown in Figure 6 gives the strongest correlation with correlation coefficient (R2) ranging between 0.90-0.96. Correlation of apparent resistivity with soil strength parameters for clay soil (Opolo site) show weak correlation with correlation (R2) around 0.48. Generally, the good correlation indicates linear relationship exists between the elastic moduli and apparent resistivity of the alluvial sediments.
The correlation of apparent resistivity against undrained shear strength and friction angle in clay soil (Opolo site) shown in Figure 5 and f indicate moderate correlation with correlation coefficients of 0.76 and 0.63 respectively. However, the correlation of apparent resistivity against friction angle in the silty sand soil show weak correlation with correlation coefficient (R2) of about 0.21.
The empirical models generated in this study between apparent electrical resistivity and soil strength parameters were used to generate synthetic data for shear modulus, Young’s modulus, bulk modulus, undrained shear strength and friction angle. These pseudo results obtained from the linear regression equation for each soil strength parameter was superimposed on plot of the measured data (Figure 6 and 7). Figure 6 and 7 show good correlation between modelled values and measured data, implying that our preliminary results with linear models reported in this study are promising, and thus verify the applicability of the proposed empirical models in predicting soil strength parameters Figure 8-10.
It is pertinent to note that the correlations developed in a given geological context are not universally applicable and therefore should be used with caution, as well as be calibrated locally [46,47]. The empirical correlations between the apparent resistivity with elastic moduli and shear strength parameters such as undrained shear strength (Su) and friction angle can be used to support and complement strength determinations in alluvial sediments [48].
Figure 6: Variation of apparent resistivity, seismic velocities and soil strength parameters with depth at the Tombia site.

The correlation of apparent resistivity against undrained shear strength and friction angle in clay soil (Opolo site) shown in Figure 7e and f indicate moderate correlation with correlation coefficients of 0.76 and 0.63 respectively. However, the correlation of apparent resistivity against friction angle in the silty sand soil show weak correlation with correlation coefficient (R2) of about 0.21.
Figure 7: Correlation of apparent resistivity with soil strength parameters and seismic velocity at Opolo (a) Shear wave velocity (b) Shear modulus (c) Young’s modulus (d) Bulk modulus (e) Undrained shear strength (f) Friction angle.

The empirical models generated in this study between apparent electrical resistivity and soil strength parameters were used to generate synthetic data for shear modulus, Young’s modulus, bulk modulus, undrained shear strength and friction angle. These pseudo results obtained from the linear regression equation for each soil strength parameter was superimposed on plot of the measured data (Figure 9 and 10). Figure 9 and 10 show good correlation between modelled values and measured data, implying that our preliminary results with linear models reported in this study are promising, and thus verify the applicability of the proposed empirical models in predicting soil strength parameters.
Figure 8: Correlation of apparent resistivity with soil strength parameters and seismic velocity at Tombia (a) Shear wave velocity (b) Shear modulus (c) Young’s modulus (d) Bulk modulus (e) Friction angle.

Figure 9: Crossplots of measured and modelled parameters at the Opolo site (a) Shear modulus (b) Young’s modulus (c) Undrained shear strength (d) Friction angle.

Figure 10: Crossplots of measured and modelled parameters at the Tombia site (a) Shear modulus (b) Young’s modulus (c) Bulk modulus (d) Friction angle.

It is pertinent to note that the correlations developed in a given geological context are not universally applicable and therefore should be used with caution, as well as be calibrated locally [46,47]. The empirical correlations between the apparent resistivity with elastic moduli and shear strength parameters such as undrained shear strength (Su) and friction angle can be used to support and complement strength determinations in alluvial sediments [48].
Conclusion
In this study, field tests consisting of vertical electrical sounding (VES) and CPTu data acquired at the same location were analyzed and correlated to develop empirical models. Apparent electrical resistivity was derived from the VES data while soil strength parameters such as shear modulus, Young’s modulus, bulk modulus, undrained shear strength and friction angle were derived from the CPTu data. At selected depths, we collected the apparent resistivity variation with depth and correlated with the soil strength parameters. Least square regression method was used to evaluate the relation between apparent resistivity and the different soil strength parameters. Linear curve fitting approximations were applied. The results show that apparent electrical resistivity has a good correlation with soil strength parameters with coefficient of correlation ranging between 0.4-0.7. Only the correlation between apparent electrical resistivity and friction angle at the Tombia site indicate a correlation coefficient of <0.3. The empirical models were validated by predicting the soil strength parameters. The predicted values were plotted against measured values. The results show a good correlation and thus affirm the applicability of the proposed empirical models. The determination of soil strength using apparent electrical resistivity is economic, fast and efficient when compared to direct in situ methods used to determine the soil strength for civil engineering purposes, and thus is extremely useful in geotechnical studies.
Acknowledgement
The authors thank the Management of Geoville Consulting, Port Harcourt, Rivers State, Nigeria for the use of the CPTu equipment. We are also grateful to the Head of Department of Physics, Niger Delta University for the use of the Abem Terrameter SAS 1000.
References
- Abam TKS (2016) Tank pad foundation construction in the Niger Delta, Nigeria. Journal of Earth Sciences and Geotechnical Engineering 6(2): 89-100.
- Duncan JM, Wright SG (2005) Soil strength and slope stability. John Wiley, Hoboken, New Jersey, USA.
- Fatoba JO, Alo JO, Fakeye AA (2010) Geoelectric imaging for foundation failure investigation at Olabisi Onabanjo university mini campus, Ago-Iwoye, Southwestern Nigeria. Journal of Applied Sciences Research 6(12): 2192-2198.
- Akintorinwa OJ, Adeusi FA (2009) Integration of geophysical and geotechnical investigations for a proposed lecture room complex at the Federal University of Technology, Akure, SW, Nigeria. Ozean Journal of Applied Sciences 2: 241-254.
- Akintorinwa OJ, Ojo JS, Olorunfemi MO (2010) Geophysical investigation of pavement failure in a basement complex terrain of southwestern Nigeria. The Pacific Journal of Science and Technology 11(2): 649-663.
- Akintorinwa OJ, Abiola O (2011) Subsoil evaluation for pre-foundation study using geophysical and geotechnical approach. Journal of Emerging Trends in Engineering and Applied Sciences 2(5): 858-863.
- Mlynarek Z, Stefnniak K, Wierzbicki J (2012) Geotechnical parameters of alluvial soils from in-situ Archives of Hydro-Engineering and Environmental Mechanics 59(1-2): 63-81.
- Sastry RG, Gautam P (2013) Geotechnical site characterization through geo-electrics. 10th Biennial International Conference & Exposition, Kochi, India.
- Revil A, Murugesu M, Prasad M, Le Breton M (2017) Alteration of volcanic rocks: A new non-intrusive indicator based on induced polarization measurements. J Volcanol Geoth Res 341:351-362.
- Mesbah HS, Ismail A, Taha AI, Massoud U, Soilman MM (2017) Electrical and electromagnetic surveys to locate possible causes of water seepage to ground surface at a quarry open pit near Helwan city, Egypt. Arab J Geosci 10: 230.
- Attwa M, Basokur A, Akca I (2014a) Hydraulic conductivity estimation using direct current (DC) sounding data: a case study in East Nile Delta, Egypt. Hydrogeology J 22: 1163-1178.
- Khaled MA, Al Tammamy AM, Barseem MS, El Sayed AN, El Abed EA (2016) Geoelectrical and hydrogeological study to delineate the geological structures affecting the groundwater occurrence in Wadi El Khariq Basin, Northwest El Maghara, North Sinai, Egypt. Arab J Geosci 9: 271-289.
- Maurya PK, Rønde VK, Fiandaca G, Balbarini N, Auken E, et al. (2017) Detailed landfill leachate plume mapping using 2D and 3D electrical resistivity tomography-with correlation to ionic strength measured in screens. J Appl Geophys 138: 1-8.
- MacGregor L, Sinha M, Constable S (2001) Electrical resistivity structure of the Valu Fa Ridge, Lau Basin, from marine controlled-source electromagnetic sounding. Geophys J Int 146(1): 217-236.
- Abidin MHZ, Saad R, Ahmad RF, Wijeyesekera DCW, Baharuddin MFT (2014) General relationship between field electrical resistivity value (ERV) and basic geotechnical properties (BGP). International Journal of Integrated Engineering 6(1): 23-29.
- Roth MJS, Mackey JR, Mackey C, Nyquist JE (2002) A case study of the reliability of multielectrode earth resistivity testing for geotechnical investigations in karst Terrains. Eng Geol 65(2-3): 225-232.
- Roth MJS, Nyquist JE (2003) Evaluation of multielectrode earth resistivity testing in Karst. Geotech Test J 26(2): 167-178.
- Sudha K, Israil M, Mittal S, Rai J (2008) Soil characterization using electrical resistivity tomography and geotechnical investigations. Journal of Applied Geophysics 67(1): 74-79.
- Cosenza P, Marmet E, Rejiba F, Cui YJ, Tabbagh A, et al. (2005) Correlations between geotechnical and electrical data: a case study at Garchy in France. Journal of Applied Geophysics 60(3-4): 165-178.
- Endres AL, Clement WP (1998) Relating cone penetrometer test information to geophysical data- a case study. Symposium on the Application of Geophysics to the Engineering and Environmental Problem (SAGEEP), Chicago, USA.
- Gautam PK, Sastry RG, Mondal SK (2007) The utility of multi-electrode resistivity data in geotechnical investigations-a case study. In: 20th Symposium on the Application of Geophysics to Engineering and Environmental Problems (SAGEEP), pp. 731-737.
- Braga ACO, Malagutti FW, Dourado JC, Chang HK (1999) Correlation of electrical resistivity and induced polarization data with geotechnical survey standard penetration test measurements. Journal of European and Engineering Geophysics 4(2): 123-130.
- Deniel CR, Campanella RG, Howie JA, Giacheti HL (2003) Specific depth cone resistivity measurements to determine soil engineering properties. Journal of Environmental and Engineering Geophysics 8(1): 15-22.
- Gemail KS, Shebla S, Attwa M, Soliman SA, Azab A, et al. (2020) Geotechnical assessment of fractured limestone bedrock using DC resistivity method: a case study at New Minia City, Egypt. NRIAG Journal of Astronomy and Geophysics 9: 272-279.
- Okiongbo KS, Mebine P (2015) Estimation of aquifer hydraulic parameters from geoelectrical method-a case study of Yenagoa and environs, Southern Nigeria. Arabian Journal of Geosciences 8: 6085-6093.
- Akpokodje EU, Etu-Efeotor JO (1987) The occurrence and Economic potential of clean sand deposits of the Niger Delta. Journal of African Earth Science 6(1): 61-65.
- Akpokodje EG (1986) A method of reducing the cement content of two stabilized Niger delta soils. Quarterly Journal of Engineering Geology and Hydrogeology 19: 359-363.
- Amajor LC (1991) Aquifers in the Benin Formation (Miocene-Recent), Eastern Niger Delta, Nigeria. lithostratigraphy, hydraulics and water quality. Environ Geol Water Sci 17: 85-101.
- Saucier RT (1994b) Geomorphology and quaternary geologic history of the Lower Mississippi valley. 2: US Army Corps of Engineers, Waterways Experiment Station.
- Mbonu, PDC, Ebeniro JO, Ofoegbu CO, Ekine AS (1991) Geoelectric sounding for the determination of aquifer characteristics in parts of Umuahia area of Nigeria. Geophysics 56(2): 284-291.
- Lesmes D, Frye KM (2001) Influence of pore fluid chemistry on the complex conductivity and induced polarization responses of Berea sandstone. Journal of Geophysical Research 160(B3): 4097-4090.
- Loke MH, Barker RD (1996) Rapid least‐squares inversion of apparent resistivity pseudo-sections by a quasi‐Newton method. Geophysical Prospecting 44(1): 131-152.
- Robertson PK, Wride CE (1998) Evaluating cyclic liquefaction potential using the cone penetration test. Can Geotech Journal 35(3): 442-459.
- Othman AAA (2005) Construed geotechnical characteristics of foundation beds by seismic measurements. Journal of Geophysics and Engineering 2: 126-138.
- Telford WM, Geldart LP, Sherriff RE, Keys DA (1990) Applied Geophysics. Cambridge University press, UK.
- Robertson P (2009) Interpretation of cone penetration tests-a unified approach. Can Geotech J 46(11): 1337-1355.
- Lunne TPK, Robertson P, Powell JJM (1997) Cone penetration testing in geotechnical practice: Routledge.
- Konrad JM, Law KT (1987b) Pre-consolidation pressure from piezocone tests in marine clays. Geotechnique 37(2): 177-190.
- Riccei G, Simonini P, Cola S (2002) Applicability of piezocone and dilatometer to characterize the soils of the Venice lagoon. Geotechnical and Geological Engineering 20: 89-121.
- Okiongbo KS, Gede AP (2017) Aquifer sediment colour-a viable geological solution for iron mitigation in Yenagoa and environs in the Niger Delta, Southern Nigeria. Canadian Journal of Pure and Applied Sciences 11(2): 4277-4290.
- Okiongbo KS, Soronnadi-Ononiwu GC (2018) Characterizing aggregate deposits using electrical resistivity method: case history of sand search in the Niger Delta, Nigeria. J Earth Sci Geotech Eng 8: 1-16.
- Sarkar P, Singh KH, Shabi A, Maurya SP (2015) Estimation of elastic moduli of alluvium sediments. 11th Biennial International Conference & Exposition.
- Okiongbo KS, Ogobiri G (2011) Geoelectric investigation of groundwater resources in parts of Bayelsa State, Nigeria. Research Journal of Environmental and Earth Sciences 3(6): 620-624.
- Hosseinpour H, Almeida MSS, Riccio M, Baroni, M (2017) Strength and compressibility characteristics of a soft clay subjected to ground treatment. Geotech Geol Eng 35: 1051-1066.
- Sultan N, Voisset M, Marsset B, Marsset T, Cauquil E, et al. (2007) Potential role of compressional structures in generating submarine slope failures in the Niger Delta. Marine Geology 237(3-4): 169-190.
- Larsson R, Ahnberg H (2005) On the evaluation of undrained shear strength and pre-consolidation pressure from common field tests in clay. Canadian Geotechnical Journal 42(4): 1221-1231.
- Leroueil S, Demers D, Saihi F (2001) Considerations on stability of embankments on clay. Soils and Foundations 41(5): 117-127.
- Larsson R, Bergdahl U, Eriksson L (1987) Evaluation of shear strength in cohesive soils with special reference. Soils and Rocks, São Paulo, Brazil 40: 291-301.
© 2020 Okiongbo KS. This is an open access article distributed under the terms of the Creative Commons Attribution License , which permits unrestricted use, distribution, and build upon your work non-commercially.
Editor In Chief


.jpg)


Signup for Newsletter

Quick Links
 Editorial Board Registrations
 Submit your Article
 Refer a Friend
 Advertise With Us
Our Recent Edition

.jpg)


Top Editors


.jpg)


.bmp)
.jpg)
.png)
.jpg)


.jpg)


.png)

.png)


.png)


Financial Support

Sponsors

Latest e-Books

Latest Video

 a Creative Commons Attribution 4.0 International License. Based on a work at www.crimsonpublishers.com.
Best viewed in
a Creative Commons Attribution 4.0 International License. Based on a work at www.crimsonpublishers.com.
Best viewed in