
- About Us
- Information
-

The Author ensures that the research has been conducted responsibly and ethically with adherence to all relevant regulations. read more..
- For Authors
- For Reviewer
- Manuscript Guidelines
- Membership
- Publication Ethics
-
- Journals
- Reprints
- e-Books
- Videos
- Policies
- Contact Us
 COVID-19
- Submissions


Full Text
Advancements in Civil Engineering & Technology
3D FEM and DEM Analyses of Underground Openings in Competent Rock Masses
Pierotti A1, Leoni M2 and Lo Presti D1*
1Department of Civil and Industrial Engineering, Italy
2WeSI Geotecnica, Genoa, Italy
*Corresponding author: Lo Presti D, Department of Civil and Industrial Engineering, Italy
Submission: September 04, 2020;Published: September 17, 2020s

ISSN: 2639-0574 Volume4 Issue3
Abstract
The paper is aimed at comparing the results of numerical analyses of underground openings in competent rock masses like the Carrara Marble (Italy) by considering a real and well documented case study. More specifically, 3D FEM and DEM analyses were carried out on a rock-mass model interested by two faults and three sets of discontinuities. The geometrical model is representative of deep underground openings where spalling-cracks and rock bursts can occur. PLAXIS 3D and 3DEC were used for the analyses. Intact rock and rock mass characterization of Carrara Marble was inferred from available technical literature. The analysis results were compared in terms of principal stresses and displacements in a number of monitoring points around the opening. The main practical interest is to find out a reliable approach for evaluating the stability of very large openings in a competent rock mass like Carrara marble. For such a purpose, a number of available in-situ stress measurements were used.
Keywords: FEM analysis; DEM analysis; Numerical model; Quarry; Rock mass strength
Introduction
Underground openings excavated in jointed rock masses at shallow depths may cause structurally controlled instabilities. These instabilities are mainly controlled by the number and orientation of discontinuity - sets or single joints (faults) and by the available strength along these weakness surfaces. On the other hand, deep underground openings modify the geostatic stress-field causing stress-redistribution and potentially stress-controlled instabilities.
The simplest approach for evaluating the stress field that may be induced by an underground opening is the elastic one [1]. Elastic solutions [2] have the great advantage of simplicity but also several limitations (i.e. oversimplifications concerning the boundary stresses away from the opening, elastic constitutive model and the geometry of the opening(s) among the most relevant). In recent years different types of numerical methods became available. As far as the modeling of the rock mass is concerned, the following approaches are available: a) to consider the rock mass as a continuous medium with reduced strength and stiffness characteristics with respect to the intact rock (i.e. a sort of homogenization process depending on the number and types of discontinuities, namely equivalent continuum), b) to consider the rock mass as a dis-continuum consisting of intact rock and very few discontinuities or c) to use hybrid continuum/dis-continuum approaches. The continuum methods include Finite Difference Method (FDM), Finite Volume Method (FVM), Finite Element Method (FEM) [3,4], Meshless Method, Boundary Element Method (BEM). Dis-continuum methods include Discrete Element Method (DEM) [5,6], Discrete Fracture Network Method (DFN). Various researchers [7,8] provided an overview of such methods also considering the hybrid ones.
Usually the choice of analysis approach depends on the scale of the problem. According to Barton [9], in case of tunnelling, dis-continuum model is considered appropriate for a range of Q ≈ 0.1-100 (Figure 1). As far as the continuum approach is concerned, the Finite Element Method (FEM) enables one to deal with heterogeneous rock masses. Moreover, constitutive models, incorporating elasto-plasticity and viscosity, can be adopted in FEM analyses. Failure analysis, cracking as well as finite displacement along dis-continuities or rotations cannot be treated by conventional FEM approach because of the continuum assumption. Continuous re-meshing or hybrid approach can overcome such a limitation. On the other hand, the effectiveness of dis-continuum approach mainly depends on the availability of sufficient geological and geo-mechanical data.
Figure 1: Schematic diagram suggesting the range of application of dis-continuum modeling in relation to Q value ([9] modified by [10]). (for the study case Q is about 7; RMR = 9*LNQ+44)

Nowadays the continuum approach is still the most popular and few Authors have tried to compare the results of these two types of analyses in real cases [8-11]. On the other hand, in the case of layered structures (i.e. shale formations), where the rock-mass behaviour is mainly controlled by the set of discontinuities, it could be convenient to use the continuum approach. Therefore, parametric studies have shown in which way the anisotropic behaviour of these types of rock – masses can be well simulated by using the continuum approach [12,13]. The case study does not belong to this category because it concerns a competent rock mass with few discontinuity sets. This paper deals with a real and well documented case study. According to Scavia [14] we believe that equivalent continuum and dis-continuum approaches may lead to very different results. Therefore, these approaches should be used for different purposes and objectives. Our aim is to compare, in terms of principal stresses and displacement vectors, the results of 3D continuous and discontinuous analyses that were carried out by using PLAXIS 3D [15]) and 3DEC [16]. The study model consisted of an “idealized” rock mass block (700x400x595m) interested by two faults and three sets of discontinuities. These structural features correspond to those observed around an existing deep quarry, as better explained later. The opening is 49x50x30m and the floor is 95m above the block-bottom (Figure 2). The geo-mechanical characterization of the rock mass, intact rock and discontinuities was inferred from the technical literature.
Figure 2: Absolute coordinates (x, y, z) of the block (on the left) and of the internal cavity (on the right).

Carrara marble is extracted from the mining district of Carrara in the North-West Tuscany (Italy). It is a generic term indicating different commercial products of a carbonate metamorphic rock. More specifically the so-called “Bianco di Carrara” is considered in the present study. The mining district is actually very wide and the mine exploitation is carried out in different ways. The paper firstly summarizes the mechanical characterization and classification indexes of Carrara marble from the available technical literature. This was done for exploring the variability of the interest parameters (strength and stiffness of both intact rock, rock mass and discontinuities) within the whole mining district. In a second step, specific model parameters for FEM and DEM analyses were selected from the published data. In other words, the Authors intend to perform independent FEM and DEM analyses by using the specific available parameters.
Materials and Methods
Geo-mechanical characterization of the Carrara marble
The geo-mechanical characterization of Bianco di Carrara is based on a number of research papers [17-20]. Table 1 & 2 summarize the geo-mechanical characterization and the classification indexes of “Bianco di Carrara” as inferred from literature [17-20]. The strength and stiffness parameters specifically used for the numerical analyses are summarized later on. In these tables, values referred to x, y, z directions were obtained from laboratory testing on groups of specimens drawn from three perpendicular directions, of which z is directed orthogonal to the apparent marble layering [20]. Shear strength of intact rock (τ) was evaluated by means of direct shear tests on intact specimens that were subjected to a normal stress σa=3.5 MPa.
Table 1: Mechanical characterization of Carrara marble from literature.

Table 2: Classification indexes of Carrara marble from literature./p>

Tables 3-5 show the geo-mechanical characterizations of discontinuities as inferred from existing technical literature. Table 3 shows the characteristics of discontinuities surveyed in the Ravaccione & Fantiscritti pit [18]. The mechanical characterization of these discontinuities was obtained by laboratory tests, carried out according to ISRM suggested methods [18]. Table 4 concerns discontinuities surveyed in another quarry [19]. Table 5 refers to artificial discontinuities that have been prepared and tested in the lab [20]. It is worth mentioning that in Table 3 the reported value of cohesion was inferred from a specific analysis trying to account for the existence of rock bridges. The cohesion value of Table 5 was instead experimentally determined in the lab on artificial discontinuities.
Table 3: Geometrical and mechanical characteristics of major discontinuities in Ravaccione and Fantiscritti open pit (Carrara).

Table 4: Mechanical characteristics of discontinuity (open pit near Pianza anticlinal - Carrara).

Table 5: Characterization of artificial discontinuities of Carrara marble samples.

Numerical methods
This paper aims to compare FEM and DEM methods in order to outline limitations and capabilities of these different approaches, in the specific field of underground excavations. The comparison concerns a 3D model of a blocky rock mass containing a cavity. The case study represents an idealization/simplification of the Ravaccione Fantiscritti Quarry. Indeed, the sets of discontinuities correspond to those effectively observed [18], while the geo-mechanical characterization was inferred from those reported in Table 1-5.
As for the numerical analyses the adopted geo-mechanical characteristics are reported in Table 6-9. The geometry and geo-mechanical characterization of the two joints were arbitrarily established. FEM and DEM analyses were carried out using respectively Plaxis 3D [15] and 3DEC [16]. 3DEC is a specific tool, based on the distinct element method. This program allows one to model a jointed rock mass as a series of discrete and deformable blocks. Dimensions and geometry of the blocks depend on fracturing characteristics of rock: orientation and spacing of natural discontinuity contained in the rock mass are fundamental. Discontinuities between blocks are considered as boundary conditions for each block. These conditions are determined by the characterization of the discontinuities that are considered as zones of interaction between blocks. For each discontinuity an appropriate behavior model must be assumed. This type of modeling allows large displacements along the discontinuities as well as the rotation of the blocks, by means of an explicit algorithm. As for the constitutive model, it is possible to consider time-dependent and both linear and non-linear constitutive relations for the rock matrix and for the discontinuities. The DEM code also allows assimilating the behavior of each block to that of a rigid body or a deformable body. For some applications the deformation of the individual blocks can be ignored while, if not, it can be accounted by the discretization of each block to the finite differences. In the latter case, each block is further subdivided with a finite difference meshing. The Mohr-Coulomb (MC) criterion was adopted both for the rock mass and for the discontinuities.
Table 6: Stiffness and strength parameters for DEM model

(K=bulk modulus, G=shear modulus).
Table 7: Stiffness and strength parameters for FEM model.

Table 8: Geometrical and mechanical characteristics of the two faults.

Table 9: Geometrical and mechanical characteristics of discontinuity sets.

1 Systems (spacing); 2 No of discontinuities, 3 dip [°], 4 dd [°], 5 JRC, 6 JCS, 7 JKN [MPa/m], 8 JKS [Mpa/m], Φ [°], 10 c [MPa].
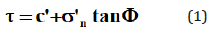
where τ and σ’n are the tangential and normal stresses on the failure plane at failure, respectively, c is the cohesion of the intact rock and Φ is the angle of shear resistance.
Mechanical parameters (Table 6) adopted for the rock matrix were inferred from those reported on Table 1. Plaxis 3D is a finite element program used in geotechnical field. An equivalent continuous model was defined in order to use such a numerical analysis. Indeed, in the case of continuous equivalent models we renounce to the thorough modeling of all the discontinuities whilst the parameters of the intact rock are appropriately reduced to take into account the rock-mass weakening because of the existence of various set of discontinuities. The Hoek-Brown (HB) criterion [21,22] was adopted for the rock-mass. The Hoek-Brown failure criterion expresses the resistance of the rock through a non-linear relationship between the principal stresses:
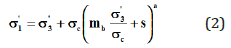
where σ’1 and σ’3 are the major and minor principal stresses, mb and s are dimensionless empirical constants of the rock mass and σc is the uniaxial compressive strength of the intact rock. This criterion assumes that the failure behavior of a rock mass can be assimilated to that of an equivalent continuous medium. The constants mb and s can be properly scaled according to the type of rock under examination and to the geological-structural arrangement of the rock mass. According to the Bienawski rating system [23], the rock mass is characterized by a geological strength index GSI=66 [18].
It is worth mentioning that, the set of parameters for DEM and FEM analyses were indepentely inferred fron available literature data. Consequently a different σc was considered. In particular the uniaxial compression strength was considered equal to 80MPa for the DEM analyses while was equal to 99MPa in FEM analyses. In other words we would approach the analyses such as a practizing engineer using different computational tools that require different sets of input parameters. Anyway, the adopted MC (intact rock) and HB (GSI=100) criteria can be considered equivalent as better shown later on.
Model geometry and monitoring points
The model used for numerical analysis represents a rock mass block (700x400x595m) containing an opening/cavity (49x50x30m). The opening’s sides are parallel to the block’s one. Figure 2 shows coordinates (x, y, z) respectively of the whole block (at the left) and of the opening (at the right). The block is crossed by two faults and by three sets of discontinuities (K1, K2, K3). Table 8 shows orientation and mechanical characteristics of the faults. The orientation is defined by two angles: the dip-direction angle (dd), measured in the global xy-plane, clockwise from the positive y-axis and the dip angle (dip) measured in the negative z-direction from the global xy-plane.
JKN and JKS are the joint normal stiffness and joint shear stiffness. The same table shows Mohr-Coulomb parameters, cohesion and friction angle, adopted for the characterization of discontinuities. Table 9 shows orientation and mechanical characteristics of the three sets of discontinuities. JRC and JCS are respectively the joint roughness coefficient and the joint wall compressive strength. In order to compare the results of the analysis, an array of 40 monitoring points has been chosen. Points are located around the openings or directly on their sides, along three vertical sections parallel to the xz plane, ie the vertical plane (y=36, y=59, y=82) (Figure 3).
Figure 3: Location of the monitoring points around the cavity.

In order to perform finite element calculation, the mesh was established after a convergence study. Plaxis uses an automatic mesh generation process which considers all model’s singularities. Moreover, local refinement has been performed close to the cavity. A similar approach was used for DEM analyses, with the discretization of each block to the finite differences.
Results
The outputs of the numerical analyses were compared in terms of principal stresses and displacements. Figure 4 shows the major and minor principal stresses as obtained from FEM and DEM analyses for 20 monitoring points. The figure also shows the considered strength envelopes (Mohr Coulomb and Hoek & Brown). The linear Mohr-Coulomb envelope was cut at σ3 = -8MPa, that is the tensile strength of Carrara marble (Table 1). As for the HB criterion, both the case for GSI = 100 (intact rock) and that for GSI = 66 are shown in Figure 4. The MC criterion (intact rock) and that by HB (GSI=100) mainly coincide for the relevant stress interval. In the following, stresses and cohesion are in MPa even if not explicitly indicated.
Figure 4: Failure envelopes (MC & HB) in the principal stresses plane and stresses values inferred from PLAXIS & 3DEC analyses.

PLAXIS provides values of σ1 and σ3 mostly lower than those obtained from 3DEC analyses (Figure 4). In particular the principal stresses, as inferred from PLAXIS analyses, are very close to the adopted curvilinear failure envelope or lay on it. On the other hand, in the discontinuous model, the induced stresses are always well below the linear failure envelope i.e MC (intact rock) (Figure 4). Figure 5-7 directly compare similar stress components (σ1, σ3, τmax) as obtained from PLAXIS and 3DEC analyses at the various monitoring points. These Figures confirm what observed in Figure 4.
Figure 5: Major principal stresses at the monitoring points.

Figure 6: Minor principal stresses at the monitoring points.

Figure 7: Maximum shear stresses at the monitoring points.

Table 10 shows the maximum displacements obtained by PLAXIS in the three directions x, y, z. Table 11 shows the values of the maximum principal stresses obtained by the two programs on the whole model with the relative point’s coordinates. Graphic outputs of 3DEC show a max displacement of about 40cm, in the section parallel to the xz plane and passing through the center of the chamber, at the intersection between the chamber itself and the K3 discontinuity set. Still in the vicinity of the room, but outside the intersection with the K3 set, displacements vary between 1 and 2cm and are therefore comparable with those obtained from PLAXIS.
Table 10: Maximum displacements obtained from PLAXIS for the three directions x, y, z.

Table 11: Maximum and minimum principal stresses from PLAXIS and 3DEC.

Figure 4 clearly shows that the adopted strength envelopes for FEM and DEM analyses cannot lead to comparable results. Therefore, a new set of Mohr-Coulomb parameters (c’ and ϕ') was evaluated by best fitting the Hoek-Brown envelope (for the given σc, GSI, mi and D). Interpolation was carried out within a specific interval of the minor principal stress (σ3) by using RocLab [24]. On the other hand, considering the first set of Mohr Coulomb parameters (c=20 MPa and Φ=37°) that have been used for the DEM analyses, a new set of HB parameters was estimated in order to have a Hoek-Brown criterion equivalent to the MC (intact rock) one.
Figure 8: Equivalent failure envelopes (MC & HB) in the principal stress plane and stress values from PLAXIS & 3DEC at the monitoring points.

Table 12: Hoek-Brown and Mohr-Coulomb criterion, equivalent parameters for σ3max = 24.75MPa.

In this case the value of σc was kept equal to 99MPa. The old and the new set of parameters are shown in Table 12. Numerical analyses were repeated by considering the new sets of parameters and the results are shown in Figure 8 that also shows the four strength envelopes. It is possible to see that DEM, in any case, gives higher stresses than that predicted by FEM analyses. Anyway, the differences appear less dramatic especially when comparing the FEM results with GSI=66 to those from DEM analyses with c=6.3MPa and Φ= 34.2°.
The UOIM of the USL1 of Massa Carrara (i.e. the public body responsible for the safety during mining activities in the Carrara District) [18] performed a number of in situ stress measurements. Measurements mainly concerned the Ravaccione and Fantiscritti quarries. More specifically the in-situ stresses were estimated by different techniques, namely: Hydraulic Fracturing, Doorstopper and Triaxial Thin Hollow Inclusion (CSIRO type cell). This last technique provided most reliable data. According to [18], the obtained results demonstrated that the stress state originated in the study area differs from the lithostatic one.
Moreover, they found that both FEM and DEM back - analyses gave a consistent estimate of in situ stresses.
The UOIM also endorsed an experimental approach for the safety evaluation of the quarries within the Carrara Mining District [25]. The approach consists of an accurate assessment of geometry & morphology, geo-structural characteristics, in situ stress measurements, geo-mechanical characterization in the lab, monitoring of stress and displacements, calibration of numerical models (continuous and discontinuous).
Their conclusions agree with [18]. Moreover, they pointed out the following facts:
- needs for continuous monitoring of stress-strain during excavation by the use of appropriate stress meters
- needs for using DEM models
More importantly they provided an empirical conservative, specific strength criterion. In particular, they enveloped the stress conditions of those locations where crack initiation had been observed. The envelope was established according to a Tresca-type criterion (σ1-σ3 =20MPa ≈ 0.2σc) [25] which is equivalent to an undrained Mohr Coulomb criterion (Cu=10 MPa, Φ’=0). Eventually, we performed an analysis by considering the above strength criterion. The results are summarized in Figure 9. The same figure also shows the stress state measurements (safe condition) carried out by Gulli [25].
Figure 9: Failure envelopes (Tresca type, MC and HB), in situ principal stress measurements and those inferred from 3DEC and PLAXIS analyses.

Conclusion
In conclusion the paper confirms the ability of DEM-based analyses to predict large displacements, in any case much larger than those obtained by using FEM analyses, even though explicit FEM analyses are currently used for predicting large displacements and deformations. Therefore, the above-mentioned results could be more a consequence of the constitutive model rather than of the numerical analyses. In any case, this result should be considered as preliminary and confirmed through additional comparisons by increasing the number of monitoring points and adopting the same constitutive model for both types of analyses. More importantly, it is worthwhile to point out that the results of FEM analysis, in terms of stresses, appear much more realistic if compared with the stress-field monitoring. With this respect, the use of FEM analysis appears more appropriate even in the case of a very competent rock-mass, which is really a surprising result. For the considered case, the differences between DEM and FEM analysis could be explained by considering the adopted failure criterion and strength parameters.
Indeed, the obtained results suggest that the MC strength parameters of intact rock and discontinuities and the HB strength parameters of rock mass (as inferred from literature data) lead to a completely different pattern of stress distribution around the opening. In particular, when the MC strength parameters are re-calibrated in order to fit the HB strength criterion, the differences in terms of stresses become less dramatic (in any case, the MC and HB criteria are not comparable as for the tensile stress field because of their intrinsic nature). As a final comment of practical interest, the nature of the Carrara marble (few sets of discontinuities, low persistence of discontinuities and existence of strong rock-bridges) suggests the possibility of excavating very large cavities. In practice, this could be not safe and the adoption of a conservative strength criterion, specific geo-mechanical characterization, as well as of continuous monitoring are strongly recommended.
Acknowledgement
The doctoral studies of dr. Alessia Pierotti were supported by UOIM of Massa Carrara
References
- Kirsch G (1898) The theory of elasticity and the requirements of strength theory. Veit Deut Ing 42(28): 797-807.
- Hoek E, Brown ET (1982) Underground excavations in Rock. E & FN SPON, p. 527.
- Clough RW (1960) The finite element method in plane stress analysis. Proceedings of Second ASCE Conference Electronic Computations. Pittsburg.
- Zienkiewicz OC (1977) The finite element method in engineering sciences. In: (3rd edn), McGraw-Hill: New York, USA.
- Cundall PA (1971) A computer model for simulating progressive, large scale movements in blocky rock systems. Proceedings of the International symposium Rock Fracture, ISRM, Nancy, Paper No. II-8, Volume 2.
- Cundall PA (1974) Rational design of tunnel supports: a computer model for rock mass behavior using interactive graphic for the input and output of geomaterial data. Technical report MRD-2-74, Missouri River Division, US Army Corps of Engineers, NTIS Report No. AD/A-001 602.
- Nikolić M, Roje-Bonacci T, Ibrahimbegović A (2016) Overview of the numerical methods for the modelling of rock mechanics problems.
- Scheldt T (2002) Comparison of continuous and discontinuous modelling for computational rock mechanics. Ph. D. Thesis, Department of Geology and Mineral Resources Engineering Norwegian University of Science and Technology.
- Barton N (1998) Quantitative description of rock masses for design of NMT reinforcement (Special Lecture 1). Int Conf on Hydro Power Development in Himalayas. Shimla, India.
- Barla G, Barla M (2000) Continuum and dis-continuum modelling in tunnel engineering. Galleries and Great Underground Works 61: 15-35.
- Barla G, Barla M, Repetto L (1999) Continuum and dis-continuum modelling for design analysis of tunnels. 9th Int Congr On Rock Mech, Paris, France.
- Sainsbury BL, Sainsbury DP (2017) Practical Use of the ubiquitous-joint constitutive model for the simulation of anisotropic rock masses. Rock Mech Rock Eng 50: 1507-1528.
- Riahi A, Curran JH (2009) Full 3D finite element Cosserat formulation with application in layered structures. Appl Math Model 33(8): 3450-3454
- Scavia C (2019) Continuous and discontinuous approaches in rock mechanics and rock engineering. Italian Geotechnical Magazine. XV Croce Lecture 2-19: 8-36.
- Brinkgreve RBJ, Kumarswamy S, Swolfs WM (2017) Plaxis 3D Manuals. Plaxis, Delft, The Netherlands.
- http://www.itascacg.com/software/udec
- Ferrero A, Migliazza M, Segalini A (2009) In situ fracturing mechanics stress measurements to improve underground quarry stability analyses. Proceedings of the 3rd CANUS Rock Mechanics Symposiu. Toronto, Canada.
- Ferrero AM, Migliazza M, Segalini A, Gullì D (2013) In situ stress measurements interpretations in large underground marble quarry by 3D modeling. International Journal of Rock Mechanics & Mining Sciences 60: 103-113.
- Cravero M, Gullì D, Iabichino G, Nacci F, Valentino D (2002) Geo-mechanical characterization and numerical modelling of an open pit and underground marble quarry. ISRM Int Symp on Rock Engineering for Mountainous Regions & Worksh. on Volcanic Rocks, Portugal, pp. 571-578.
- Cravero M, Gullì D, Iabichino G (2003) Comparative mechanical characterization of marble by means of laboratory testing. 39th US Rock Mech. Symp. Cambridge, USA.
- Hoek E, Brown E (1997) Practical estimates of rock mass strength. Int J Rock Mech Min Sci 34(8): 1165-1186.
- Hoek E, Carranza-Torres C, Corkum B (2002) Hoek-Brown failure criterion.
- Bieniawski Z (1989) Engineering rock mass classification. Wiley, New York, USA.
- Roclab, Rocscience (2007) Rock mass strength analysis, software freeware, Toronto, Canada.
- Gullì D, Pellegri M (2013) Stress analysis on Carrara marble quarries. 6th Int Symp on in-situ Rock Stress, Sendai, Japan.
© 2020 Jafar Razmi. This is an open access article distributed under the terms of the Creative Commons Attribution License , which permits unrestricted use, distribution, and build upon your work non-commercially.
Editor In Chief


.jpg)


Signup for Newsletter

Quick Links
 Editorial Board Registrations
 Submit your Article
 Refer a Friend
 Advertise With Us
Our Recent Edition

.jpg)


Top Editors


.jpg)


.bmp)
.jpg)
.png)
.jpg)


.jpg)


.png)

.png)


.png)


Financial Support

Sponsors

Latest e-Books

Latest Video

 a Creative Commons Attribution 4.0 International License. Based on a work at www.crimsonpublishers.com.
Best viewed in
a Creative Commons Attribution 4.0 International License. Based on a work at www.crimsonpublishers.com.
Best viewed in