- Submissions

Full Text
Advancements in Civil Engineering & Technology
Source Characterization of Disinfectants in Municipal Wastewaters
Hamid Salsali1, Edward A McBean2,3, Munir Bhatti3* and Huang J2
1Env Power, Guelph, Canada
2College of Environmental Science and Engineering, Nankai University, China
3School of Engineering, University of Guelph, Canada
*Corresponding author:Munir Bhatti, School of Engineering, University of Guelph , Canada
Submission: July 24, 2019;Published: August 09, 2019

ISSN: 2639-0574 Volume3 Issue4
Abstract
Disinfectants, most notably Triclosan (TCS) and Triclocarban (TCC), are of increasing concern in wastewaters as a result of the realization of their potential threats to humans and aquatic ecology, in combination with their frequent detections in wastewater treatment plant (WWTP) effluents. These concerns are driven by the known limited removal capabilities of both TCS and TCC in conventional water and wastewater treatment processes, as well as their potential to form toxic intermediates. Given these concerns, results from a monitoring program are described associated with hospitals, funeral homes, slaughterhouses and residential neighborhoods. Specifically, when the contributions due to hospitals, funeral homes and slaughterhouses are compared to the total at the wastewater treatment influent, results show that hospitals account for <8.2% of the mass loading, indicating that health care centers are substantial point sources for TCS and TCC in wastewater treatment systems. but slaughterhouses and funeral homes contributed less than 0.1% and 0.6 % of the overall loading of disinfectants, indicating that household and other industrial uses are responsible for larger mass loadings.
Combining the monitoring results with reported technical literature values show substantial variabilities from one source and location to another, indicating that no simple procedure will predict typical disinfectant levels in hospital wastewaters. However, by aggregating available technical data in combination the findings from this study, 95% UCL for average concentrations of 70,800ng/L for TCS and 197ng/L for TCC are demonstrated, providing insights as to magnitudes of the individual disinfectants.
Keywords: Triclosan; Triclocarban; Emerging contaminants; Municipal wastewater; Hospitals; Funeral homes; Slaughterhouse
Introduction
Emerging contaminants such as disinfectants are being seriously evaluated, as researchers study their occurrence in the environment and their effects on living organisms. In a search to find priority points-of-entry for disinfectants into the natural environment, researchers are being routinely led to municipal wastewater treatment plant outfalls. In particular, the two disinfectants assessed in this study, namely triclosan (TCS) and triclocarban (TCC), are widely used in consumer products. These two disinfectants feature very similar chemistry (i.e., two benzene rings carrying multiple chlorines), and continue to be utilized at high volumes [1]. TCS and TCC have both been used since the 1970’s and have been widely detected in wastewater treatment plant effluents and surface waters [2,3]. TCS is a broad-spectrum antimicrobial agent contained in personal hygiene products, as well as in kitchen utensils, toys, textiles, socks and trash bags [4-6]. TCS has been used in hospitals and medical products to control bacteria and the spread of disease [7].
Because of the widespread use of TCS, the chemical has been found in nearly every compartment of the environment including surface water, wastewater, sediment, sludge, human plasma and milk, urine, and fish [8]. TCS has also been detected in human body fluids. In a recent study, Han et al. [9] reported there was a 72% detection frequency of TCS in urine samples of U.S. residents for the period 2003–2012. TCS and TCC have been found in wastewater treatment influents around the world [10-21] although there have been few attempts to classify their sources. Once in the natural environment, these compounds interact with aquatic organisms and TCS and TCC have been observed to disrupt the natural hormone levels in bullfrogs and rats [22-24].
U.S. EPA has regulated TCS as a registered pesticide under the Federal Insecticide, Fungicide and Rodenticide Act (FIFRA) while recently TCS was also banned by the Food and Drug Administration [1] which indicates that there are potential concerns. In September 2016, the USFDA issued in 2017, a rule indicating that overthe- counter consumer antiseptic wash products containing the antibacterial active ingredients TCS and TCC can no longer be marketed because they “are not generally recognized as safe and effective” [25]. TCS has also been banned from use in consumer sanitizing and cleansing products in Minnesota, effective January 2017 [26]. Following an evaluation of TCS by the Biocidal Products Committee of the European Chemicals Agency (ECHA), the European Commission (EC) decided in 2016 that TCS is not approved for use in human hygiene biocidal products [27,28].
In Canada, TCS is listed as a restricted ingredient on Health Canada’s List of Prohibited and Restricted Ingredients in cosmetics (more commonly referred to as the Cosmetic Ingredient Hotlist). The restriction sets a maximum concentration of 0.03% of TCS in cosmetic mouthwashes and 0.3% in other cosmetic products [29,30]. The Canadian registrants voluntarily discontinued the sale of pest control products containing triclosan for use as a material preservative in textiles, leather, paper, plastic, and rubber materials. Consequently, as of December 31st, 2014, TCS is no longer registered in Canada as a pest control product.
TCS has been placed on the list of the 10 most frequently detected organic micropollutants in the aquatic environment [31,32]. The above, in concert with the inability for substantial removal of TCS and TCC in conventional water and wastewater treatment processes, and given that they may form toxic intermediates [33], there is strong need to identify the magnitudes of different sources through monitoring programs to combat the rather extensive identification of presence of these disinfectants. These products are, for the most part, lost down-the-drain, discharged into sewers and carried to wastewater treatment plants (WWTPs) [34].
Hospital wastewaters
Scientific Committee on Consumer Safety [35] reports that TCS has been effectively used clinically to eradicate micro-organisms such as methicillin-resistant Staphylococcus aureus (MRSA), notably with the recommendation to use 2% TCS bath. TCS is employed as surgical scrubs, and widely used in hand and body washing to eradicate MRSA prior to surgery. TCS is used in many medical devices, including ureteral stents, surgical sutures and might be considered to prevent graft infection. Occupational sources represent a potentially important exposure scenario because some, albeit not all, healthcare institutions commonly use TCScontaining antibacterial soaps and because frequent handwashing among healthcare workers in such environments (range 0.7-30 times per hour) is likely to facilitate TCS exposure [36]. Reported concentrations of TCS and TCC in hospital wastewater are presented in Table 1.
Table 1:Reported concentrations of TCS and TCC in hospital wastewaters.
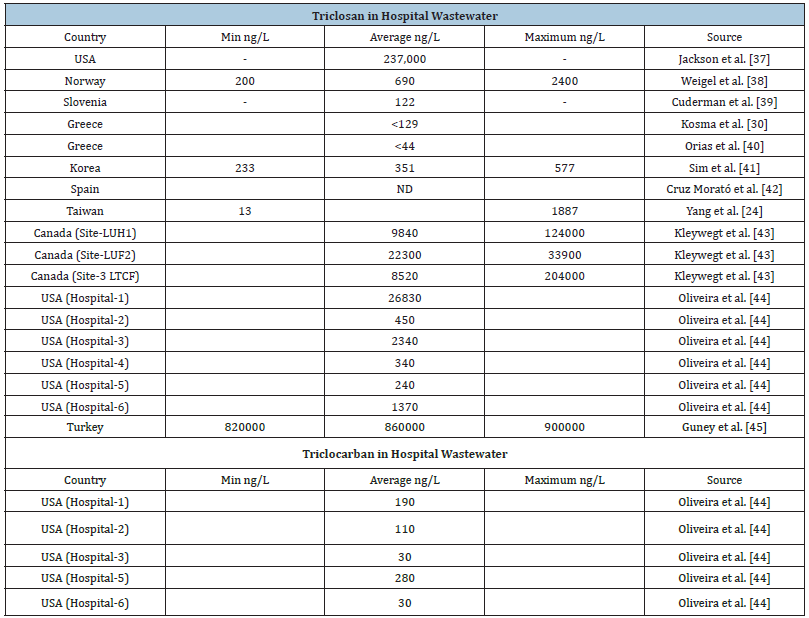
Kleywegt et al. [43] estimated the percent contribution of TCS from hospitals to total loading of grams/day to the receiving WWTP as 5.9%. Ort et al. [38] estimated the percentages of TCS from hospitals to the WWTP as 6%.
Wastewater from funeral Homes
In funeral homes, TCS is used as a skin cleaner, preservative of the skin of dead bodies [46] and as an embalming fluid [47,48]. No sources of information for these statements have been identified by the authors, related to funeral homes.
Slaughterhouse wastewater
No direct information has been found in the literature on slaughterhouses; however, as reported in EU Biocide Directive 1998/8/EC, TCS is used in veterinary hygiene and food preservation. Antibiotics, including TCS, are routinely added to animal feed to accelerate growth and to combat diseases in overcrowded factory farm conditions. TCS has been used as preservative in feed for animals. TCS is noted in the framework of the European regulations on biocides for use in veterinary hygiene biocidal products. According to Regulation (EC) 1831/2003 on additives for use in animal nutrition, the use of TCS as preservative in feed is not authorised. The substance is not listed in the corresponding Community Register of Feed Additives [49]; passing of this regulation by the EC confirms that TCS was used in some European countries. Therefore, TCS is likely present in animal bodies i.e. flesh and liquid (blood and urine) which are brought to slaughterhouses.
Point-source monitoring program
This research investigated sources of TCS and TCC into the sewer system, to provide insights into the magnitudes of these emerging contaminants. Three different municipalities were involved in the monitoring efforts and will be referred to as cities A, B, and C. Table 2 presents TCS and TCC physical and chemical properties
Table 2:Physical and Chemical Properties of TCS and TCC.

Methods
Sampling
Sampling locations were selected to best characterize the sources as follows: sites for monitoring hospitals and residential neighborhoods were chosen as locations with high disinfectant and consumer product use and therefore potential sources of TCS and TCC into the wastewater network. Funeral homes and slaughterhouses were chosen as possible entry points due to the use of TCS and TCC and sterilization solutions in the embalming and meat processing methods. Most of the samples were 24-hour composites obtained using an auto-sampler; where this was not possible, such as for the funeral homes, grab samples were used. Samples were taken every two months for four sampling events per location.
Sample locations
Samples were taken from manholes directly downstream of hospitals, funeral homes, residential neighborhoods and a slaughterhouse by municipal staff for the three cities. Due to the batch process of embalming a body, grab samples were used for both funeral homes and coordinated with the funeral home staff to ensure that the sample was taken during a time when there was an embalming occurring. At each location, three liters of sample was collected and split into two amber glass bottles and one HDPE bottle before they were stored at 4 °C until analysis. Analytical work was completed at the Worsfold Water Quality Centre at Trent University. The following table outlines the sampling locations within each city.
Analysis
The samples were filtered, acidified, and then extracted using Waters Oasis MCX solid phase extraction cartridges. The extracts were subsequently preconditioned with acetone, methanol, and dilute sulphuric acid before being eluted from the cartridge with ammonium hydroxide in methanol. They were then evaporated to almost dryness and reconstituted in methanol. The target compounds were analyzed by Micromass Quattro LC triplequadrupole mass spectrometer. The target compounds were analyzed in positive ion mode. Multiple reaction monitoring (MRM) was employed for analyte quantisation. Chromatographic separation was conducted on a Waters model 2695 HPLC system with a Genesis C18 column (150×2.1mm i.d., 4μm). The mobile phase A and B consisted of acetonitrile and aqueous ammonium acetate. Prior to extraction, samples were spiked with stable isotope labeled standards. Concentrations of the analytes in the sample were determined by comparing the relative ratio of the response of the target analyte to the response of the labeled standard with external standards. The methodology for TCS and TCC is an adaptation of a procedure from Sabourin et al. [50] and can be found in more detail therein. For Quality Analysis and Quality Control, a laboratory blank for each sample batch and at least one real sample duplicate from each sample set from the same sampling location was conducted. Also, surrogate standards were added into each sample to monitor and correct for any potential loss during the sample analysis.
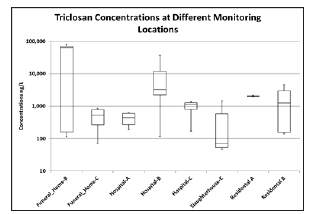
Figure 1:Triclosan Concentration at Different Sample Locations.
Results
At each sampling location, the concentrations of TCS and TCC were quantified. TCS was detected in all the samples from funeral homes B and C, hospitals A and C, residential areas A and B and slaughterhouse-C. In Hospital-B TCS was found 80% of the time. In all the samples of influent-A, Influent-B, influent-C (i.e. to WWTPs), TCS was detected in all the samples. TCC was detected in 60% and 70% of samples from funeral homes B and C. In hospitals A, B and C, TCC was detected in 80%, 60% and 40% of the samples, respectively. In both the residential areas, TCC was detected in all the samples. In slaughterhouse C, TCC was detected in 40% of samples. Figure 1 and 2 show the concentrations of each compound at the various source locations.
Discussion
Source concentrations
The source sampling of TCS as seen in Figure 1 shows high concentrations in the wastewater streams of hospital B and funeral home B. Since a composite sample of funeral home B was not feasible and a grab sample was used, the concentration of 77,500ng/L may not be indicative of an average funeral home concentration. This large spike is likely due to the embalming and disinfecting batch processes used when preparing a body for burial rather than a baseline effluent concentration for the funeral home itself. The mean concentrations of TCS in funeral homes B and C were 42,055 and 497ng/L respectively while in hospitals A, B and C were 615, 36600 and 1410ng/L respectively. In residential areas A and B the mean concentrations of TCS were 2170 and 4580ng/L respectively while in slaughterhouse-C the mean concentration was 1450ng/L. Hospital B also exhibits a high TCS effluent concentration although the large error bars highlight the variability of the data. Since hospital B was sampled with a 24h auto-sampler over many months, the results are unlikely due to a small number of events but rather the continual, but inconsistent use of TCS for tasks such as hand washing and equipment disinfecting.
Figure 2:Triclocarban Concentration at Different Sample Locations.
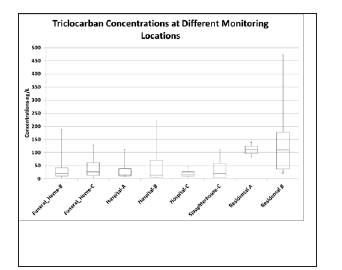
Figure 2 outlines the source concentrations of TCC at various locations. Residential areas A and B had higher levels of TCC than all other sources while hospital A had the lowest levels. Hospital B had the highest levels of the three hospitals sampled and had the greatest variability. The source sampling of TCC show high concentrations in the wastewater streams of residential area-B and hospital-B being 475ng/L and 223ng/L respectively. The mean concentrations of TCC in funeral homes B and C were 53 and 47ng/L respectively while in hospitals A, B and C were 30, 54 and 21ng/L respectively. In the residential areas A and B, the mean concentrations of TCC were 111 and 137ng/L respectively while in slaughterhouse-C the average concentrations were 40ng/L. The variability of the data suggests that each class of potential source, for all the identified source types (residential, funeral homes, residential and hospital), all are notable contributors to the overall loading of TCS and TCC in municipal wastewaters. Overall, there were no obvious identified point source characteristics for any of the source types; the results show no one sample location type contributes more contaminant per litre than the others.
Figure 3:Comparison of Average Triclosan Concentrations in wastewater from different sources.
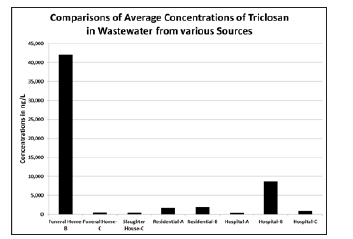
Figure 4:Comparison of Average Triclocarban Concentrations in wastewater from different sources
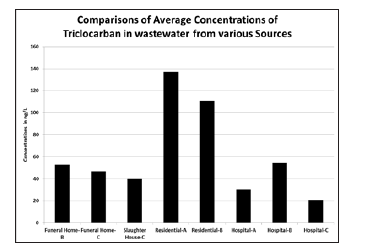
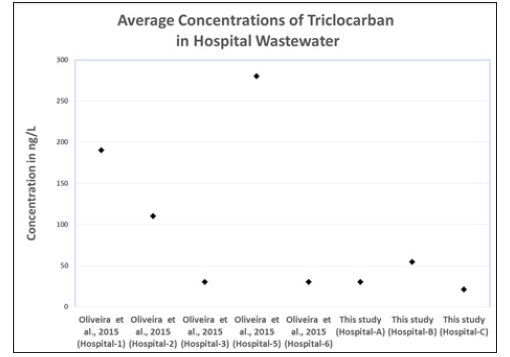
Figure 3 and 4 show the average concentrations of TCS and TCC from the different sources. Average TCS concentrations are higher in funeral home-B and hospital-B while the average TCC concentrations are higher in the residential areas. Funeral homes and a slaughterhouse were included in this study to investigate their potential as a source of emerging contaminants into the wastewater treatment system but when not in the process of embalming a body, funeral home wastewaters resemble a residential dwelling; due to this, the results obtained from the funeral homes are not considered indicative of average effluent concentrations over long periods of time but rather ‘snapshots’ of the loadings when funeral homes are operational. TCS was the only compound found at a funeral home in greater concentrations than the rest of the sample locations though this was expected as TCS is a component of many disinfectant and antibacterial washes which are likely used in the embalming process. To allow statistical characterization of magnitudes of TCS and TCC, the monitoring results of this study in relation to hospital wastewater from various authors for the both disinfectants are plotted as shown in Figure 5 and 6 for TCS and for TCC. Given the above, the results indicate that hospitals, funeral homes and slaughterhouses are not individually, significant sources of disinfectants to the wastewater system. The current trend involving considerable use of disinfectants at residential places is contributing more to the wastewater system.
Figure 5:Comparison of Average Triclosan Concentrations in Hospital Wastewaters.
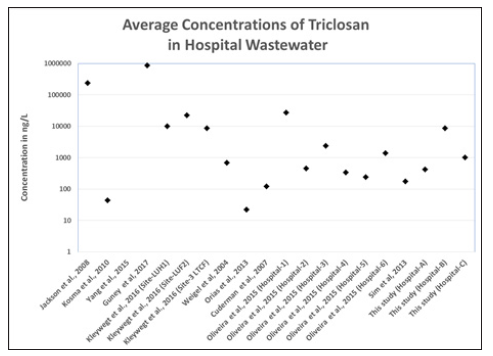
Figure 6:Comparison of Average Triclocarban Concentrations in Hospital Wastewaters.
Analysis of contaminant loading percentages of triclosan and triclocarban from hospitals, funeral homes, and slaughterhouse to wastewater treatment plants
By estimating the total loading of each compound within hospital effluents, it is possible to assess the percentage that originates from the hospitals in this study. Using an average wastewater per hospital bed value of 1350L/bed/day [51], the hospital loadings were calculated and compared to loading levels at the WWTP influents. City-B treats an average of 293ML of wastewater daily while city-C treats an average of 49.4 million liters of wastewater daily. The population of city-B is 712,575 and city-C is 140,410 and deaths were 5.2 people per 1000 people in 2009 as per StatsCan (2017). Table 3 from NFDA, 1995 study provides an average flow rate of 2400 liter for one death so for the funeral home-B, 25000 liters of daily outflow was assumed while for funeral home-C an amount of 5000 liter of daily outflow was assumed based on the populations of these cities. The slaughterhouse has reported that the outflow is ~52,250 liters per day [52].
Table 3:Summary of Sampling Locations.

Table 4:Various Source Loadings and Percentages.
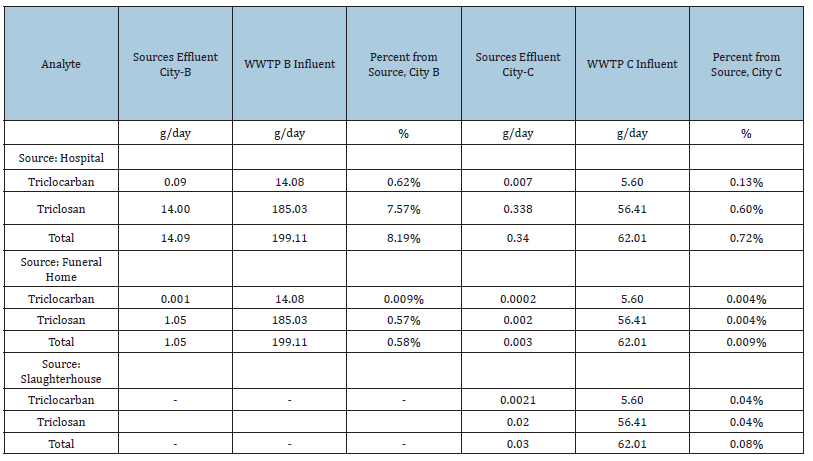
As seen in Table 4, contaminant loadings from hospitals are responsible for only small percentages of the overall loading at the wastewater treatment plant influent. Hospital -B contributed less than 8.2% of the overall loading of selected disinfectants and hospital-C contributed less than 0.72% of the overall loading of selected disinfectants. Slaughterhouse-C, funeral home-B and funeral home-C contributed less than 0.1%, 0.6% and 0.01 % of the overall loading of the selected disinfectants. To allow a characterization of reasonable maximum average concentrations for hospitals, as derived from combined information from technical literature and this study, the concentration data assembled from the literature review plus the average concentrations from this study were combined to estimate the 95% upper confidence interval concentrations of the means for the various disinfectants. The statistical software developed by USEPA for environmental applications for data sets with, and without, non-detect called ProUCL was utilized. The ProUCL software is based upon the philosophy that rigorous statistical methods can be used to compute accurate estimates of population parameters and decision-making statistics including: the upper confidence limit (UCL) of the mean, the upper tolerance limit (UTL), and the upper prediction limit (UPL) to help decision-makers and project teams in making correct decisions. Version 5.0.00 of this software was used.
It was hypothesized that some of the concentrations of TCS percentages of loads for some of the chemical compounds are very high because of the outliers in the data. USEPA ProUCL Ver 4.1 was used where the Dixon test was used to test for a single outlier in a univariate data set since the number of samples were around 5 [53]. This test is primarily used for small data sets (Data plot limits the sample to be between 3 and 30). It can be used to test whether the minimum value is an outlier, the maximum value is an outlier, or either the minimum or maximum value is an outlier. The following outliers were identified: concentration of 860,000ng/L of TCS was identified as an outlier, and hence removed from the data. The upper confidence limits (UCL) for the means were completed by using the appropriate distributions are listed in Table 5.
Table 5:95% UCL for Each of TCC and TCS for Hospitals.

Conclusion
Through monitoring the wastewater effluents of hospitals, funeral homes, residential neighborhoods and a slaughterhouse for disinfectants, the sources of emerging contaminants into the wastewater system were characterized [54-65]. It was found that all location types within this study contributed to the overall loading of disinfectants in wastewater. The mean concentrations of TCS in funeral homes B and C were 42055 and 497ng/L respectively, while in hospitals-A, -B and -C were 615, 36600 and 1410ng/L respectively. The mean concentrations of TCC in funeral homes B and C were 53 and 47ng/L respectively while in hospitals-A, -B and -C were 30, 54 and 21ng/L respectively. In the residential areas-A and -B, the mean concentrations of TCC were 111 and 137ng/L respectively while in slaughterhouse-C, the average concentrations were 40ng/L.
When the contribution due to hospitals was compared to the total at the wastewater treatment influent, it was calculated that hospitals account for <8.2% of the mass loading, indicating that health care centers are significant point sources for disinfectants into the wastewater treatment system, while slaughterhouses and funeral homes contributed less than 0.1% and 0.6 % of the overall loading of TCC and TCS. Comparisons of the monitoring results from the technical literature and this study demonstrate substantial variability, indicating that no simple procedure will predict typical disinfectant levels in hospital wastewaters. By aggregating available technical literature, and in combination with the findings from this study, 95% UCL for average concentration of 197ng/L for TCC and 70800ng/L for TCS were determined for providing insights as to magnitudes of the individual disinfectant.
Acknowledgment
We thank the three municipalities for their funding and cooperation in the completion of this study. We thank Dan Shaver for his participation in the early stages of this research. The authors also express their appreciation to Natural Sciences and Engineering Research Council funding.
References
- Halden RU (2014) On the need and speed of regulating triclosan and triclocarban in the United States. Environ Sci Technol 48(7): 3603-3611.
- Singer H, Muller S, Tixier C, Pillonel L (2002) Triclosan: occurrence and fate of a widely used biocide in the aquatic environment: field measurements in wastewater treatment plants, surface waters, and lake sediments. Environ Sci Technol 36(23): 4998-5004.
- Heidler J, Sapkota A, Halden R (2006) Partitioning, persistence, and accumulation in digested sludge of the topical antiseptic tricloscarban during wastewater treatment. Environ Sci Technol 40(11): 3634-3639.
- Bester K (2003) Triclosan in a sewage treatment process-balances and monitoring data. Water Res 37(16): 3891-3896.
- Roberts J, Price OR, Bettles N, Rendal C, Egmond R (2014) Accounting for dissociation and photolysis: a review of the algal toxicity of triclosan. Environ Toxicol Chem 33(11): 2551-2559.
- Gao L, Yuan T, Cheng P, Bai Q, Zhou C, et al. (2015) Effects of triclosan and triclocarban on the growth inhibition, cell viability, genotoxicity and multi-xenobiotic resistance responses of Tetrahymena thermophila. Chemosphere 139: 434-440.
- Xijuan C (2012) Triclosan removal in wastewater treatment processes, Aalborg Universitet, Denmark.
- Tohidi F, Cai Z (2017) Fate and mass balance of triclosan and its degradation products: Comparison of three different types of wastewater treatments and aerobic/anaerobic Journal of Hazardous Materials 323: 329-340.
- Han C, Lim YH, Hong YC (2016) Ten-year trends in urinary concentrations of triclosan and benzophenone-3 in the general U.S. population from 2003 to 2012. Environ Pollut 208: 803-810.
- Miege C, Choubert JM, Ribeiro L, Eusebe M, Coquery M (2009) Fate of pharmaceuticals and personal care products in wastewater treatment plants-conception of a database and first results. Environ Pollut 157(5): 1721-1726.
- EU (2012) EU wide monitoring survey on wastewater treatment plant effluents, 2012, European commission, joint research centre, institute for environment and sustainability, Luxembourg. Publications Office of the European Union, Europe.
- Lee HB, Kohli J, Peart TE, Nguyen N (2014) Selected chloro and bromo derivatives of triclosan-syntheses and their occurrence in Canadian sewage and biosolid samples, Environ Sci Pollut Res 21(1): 314-324.
- Yang Y, Ok Y, Kim KH, Kwon EE, Tsang YF (2017) Occurrences and removal of pharmaceuticals and personal care products (PPCPs) in drinking water and water/sewage treatment plants: A review. Science of the Total Environment 596-597: 303-320.
- Subedi B, Balakrishnac K, Sinhad RK, Yamashitae N, Balasubramanianf VG (2015) Mass loading and removal of pharmaceuticals and personal care products, including psychoactive and illicit drugs and artificial sweeteners, in five sewage treatment plants in India. Journal of Environmental Chemical Engineering 3: 2882-2891.
- Blair B, Nikolaus A, Hedman C, Klaper R, Grundl T (2015) Evaluating the degradation, sorption, and negative mass balances of pharmaceuticals and personal care products during wastewater treatment. Chemosphere 134: 395-401.
- Balakrishna K, Ratha A, Praveen Kumar Reddy Y, Guruge KS, Subedi B (2017) A review of the occurrence of pharmaceuticals and personal care products in Indian water bodies. Ecotoxicol Environ Saf 137: 113-120.
- Montes D, Fennix M, Miranda W (2017) Occurrence of personal care products as emerging chemicals of concern in water resources: A review. Sci Total Environ 595: 601-614.
- Luo Y, Gu W, Ngo HH, Nghiem LD, Ibney F, et al. (2014) Review, a review on the occurrence of micropollutants in the aquatic environment and their fate and removal during wastewater treatment. Science of the Total Environment 1(473-474): 619-641.
- Tran NH, Chen H, Reinhard M, Mao F, Gin K (2016) Occurrence and removal of multiple classes of antibiotics and antimicrobial agents in biological wastewater treatment processes, water research 104: 461-472.
- SPG (2010) Triclocarban [CASRN 101-20-2], (3,4,4'-Trichlorocarbanilide), Potential Designated Chemical, Meeting of Scientific Guidance Panel (SGP), Biomonitoring California, USA.
- Kosma CI, Lambropouloub DA, Albanis TA (2010) Occurrence and removal of PPCPs in municipal and hospital wastewaters in Greece. J Hazard Mater 179(1-3): 804-817.
- Veldhoen V, Skirrow R, Osachoff H, Wigmore H, Clapson D (2006) The bactericidal agent triclosan modulates thyroid hormone-associated gene expression and disrupts postembryonic anuran development. Aquatic Toxicology 80(3): 217-227.
- Zorrilla L, Gibson E, Jeffay S, Crofton K, Setzer W (2009) The effects of triclosan on puberty and thyroid hormones in male wistar rates. Toxicol Sci 107(1): 56-64.
- Yang CC, Tsai HJ, Chang FK (2015) Occurrence of triclosan in the tropical rivers receiving the effluents from the hospital wastewater treatment plant. Environ Monit Assess 187(3): 151.
- USFDA (2016) Federal Register from the federal register online via the government publishing office, USA 81(172).
- State of Minnesota (2016) Minnesota statute certain sales of cleaning products prohibited, US.
- ECHA (2015) Biocidal Products Committee (BPC): Opinion on the application for approval of the active substance: triclosan product-type: 1. ECHA/BPC/066/2015. Helsinki, Finland.
- EC (2016) Commission implementing decision (Eu)2016/110 of 27 January 2016 not approving triclosan as an existing active substance for using biocidal products for product-type1.Official Journal of the European Union. L21/87.
- Government of Canada (2007) Cosmetic Regulations. C.R.C., p. 869.
- Health Canada (2014) List of Prohibited and Restricted Cosmetic Ingredients (“Hotlist”) – June 2010. Ottawa (ON): Health Canada, Consumer Product Safety Directorate.
- Huang X, Tu Y, Song C, Li T, Lin J, et al. (2016) Interactions between the antimicrobial agent triclosan and the bloom-forming cyanobacteria Microcystis aeruginosa. Aquat Toxicol 172: 103-110.
- Zhang L, Niu J, Wang Y (2016) Full life-cycle toxicity assessment on triclosan using rotifer Brachionus calyciflorus. Ecotoxicol Environ Saf 127: 30-35.
- Dhillon GS, Kaur S, Pulicharla R, Brar SK, Cledón M, et al. (2015) Triclosan: Current Status, Occurrence, Environmental Risks and Bioaccumulation Potential. Int J Environ Res Public Health 12: 5657-5684.
- Reiss R, Mackay N, Habig C, Griffin J (2002) Ecological risk assessment for triclosan in lotic systems following discharge from wastewater treatment plants in the United States. Environ Toxicol Chem 21(11): 2483-2492.
- SCCS (2010) Opinion on triclosan antimicrobial resistance, antimicrobial resistance, scientific committee on consumer safety, European Union.
- MacIsaac JK., Gerona R, Blanc PD, Apatira L, Friesen M, et al. (2014) Healthcare worker exposures to the antibacterial agent triclosan. J Occup Environ Med 56(8): 834-839.
- Jackson J, Sutton R (2008) Sources of endocrine-disrupting chemicals in urban wastewater, Oakland, CA. Sci Total Environ 405(1-3): 153-160.
- Weigel S, Berger U, Jensen E, Kallenborn R, Thoresen H, et al. (2004) Determination of selected pharmaceuticals and caffeine in sewage and seawater from Tromsø/Norway with emphasis on ibuprofen and its metabolites, Chemosphere 56(6): 583-592.
- Cuderman P, Heath E (2007) Determination of UV filters and antimicrobial agents in environmental water samples. Anal Bioanal Chem 387: 1343-1350.
- Orias F, Perrodin Y (2013) Characterisation of the ecotoxicity of hospital effluents: A review. Sci Total Environ 454-455: 250-276.
- Sim WJ, Kim HY, Choi SD, Kwon JH, Oh JE (2013) Evaluation of pharmaceuticals and personal care products with emphasis on anthelmintic in human sanitary waste, sewage, hospital wastewater, livestock wastewater and receiving water. Journal of Hazardous Materials 248- 249: 219- 227.
- Cruz Morató C, Lucas D, Llorca M, Rodriguez Mozaz S, Gorga M, et al. (2014) Hospital wastewater treatment by fungal bioreactor: Removal efficiency for pharmaceuticals and endocrine disruptor compounds. Sci Total Environ 493: 365-376.
- Kleywegt S, Pileggi V, Lam YM, Elises A, Puddicomb A, et al. (2016) The contribution of pharmaceutically active compounds from healthcare facilities to a receiving sewage treatment plant in Canada. Environ Toxicol Chem 35(4): 850-862.
- Oliveira TS, Murphy M, Mendola N, Wong V, Carlson D, et al. (2015) Characterization of pharmaceuticals and personal care products in hospital effluent and wastewater influent/effluent by direct-injection LC-MS-MS. Sci Total Environ 518-519: 459-478.
- Guney G, Sponza DT (2017) Determination of the biological and adsorption removals of two phenolic emerging micropollutants in a raw hospital wastewater under different sludge retention times. 15th International Conference on Environmental Science and Technology, Rhodes, Greece.
- Ort C, Lawrence MG, Reungoat J, Eaglesham G, Carter S, et al. (2010) Determining the fraction of pharmaceutical residues in wastewater originating from a hospital. Water Res 44(2): 605-615.
- RHM (2017) RH minter PTY. limited, 2016, funeral directors’ suppliers. Micro-shield T-Triclosan Skin Cleanser.
- Bedino JH (2017) Embalming at the speed of enlightenment, iodine sanitizing water wash: a failed strategy for formaldehyde replacement in traditional embalming. Chemist/Director of Research, The Champion Company.
- http://www.google.com.gi/patents/US8015677
- Sabourin L, Beck A, Duenk P, Kleywegt S, Lapen D (2009) Science of the Total Environment 407(16): 4596-4604.
- City of Guelph (2017) Case Study, Cargill Meat Solutions, City of Guelph Industrial, Commercial & Institutional Water Capacity Buyback Program.
- Bean EA, Rovers FA (1998) Statistical procedures for analysis of environmental monitoring data and risk assessment, Prentice‑Hall Publishing Co Inc, Englewood Cliffs, New Jersey, USA.
- Chalew TE, Halden RU (2009) Environmental Exposure of Aquatic and Terrestrial Biota to Triclosan and Triclocarban. J Am Water Works Assoc 45(1): 4-13.
- ECCC (2016) Assessment report, triclosan, chemical abstracts service registry number 3380-34-5. Environment and Climate Change Canada, Health Canada.
- Environment Canada (2009) Final assessment, triclosan, environment and climate change Canada. Government of Canada.
- EU (2016) Commission implementing decision (EU) 2016/110 of 27 January 2016 not approving triclosan as an existing active substance for use in biocidal products for product- type 1. Official Journal of the European Union.
- Government of Canada (2016) Risk Management Approach for Phenol, 5-chloro-2-(2,4-dichlorophenoxy) (Triclosan), Chemical Abstracts Service Registry Number:3380-34-5, Environment and Climate Change Canada, Health Canada, Canada.
- Halden R, Paull D (2005) Co-occurrence of triclocarban and triclosan in U.S. water resources. Environ Sci Technol 39(6): 1420-1426.
- Health Canada (2015) [LNHPD] Health Canada Licensed. Natural Health Products Database.
- Heath RJ, Rubin JR, Holland DR, Zhang E, Snow ME (1999) Mechanism of triclosan inhibition of bacterial fatty acid synthesis. J Biol Chem 274(16): 11110–11114.
- NFDA (1995) National funeral directors associated, funeral home waste stream audit report, Killam associates and national funeral director’s association, New Jersey State Funeral Directors Association, USA.
- Stat Can (2017) Crude and standardized mortality rates by sex. Provinces and Territories, Canada.
- The Danish Environmental Protection Agency (2016) Survey of triclosan in cosmetic products, Survey of chemical substances in consumer, products No. 152.
- Thomaidi VS, Matsoukas C, Stasinakis AS (2017) Risk assessment of triclosan released from sewage treatment plants in European rivers using a combination of risk quotient methodology and monte carlo simulation. Science of the Total Environment 603-604: 487-494.
- Zhao JL, Ying GG, Liu YS, Chen F, Yang JF, et al. (2010) Occurrence and risks of triclosan and triclocarban in the Pear River system, South China: From source to the receiving environment. Journal of Hazardous Materials 179(1-3): 215-222.
© 2019 Munir Bhatti. This is an open access article distributed under the terms of the Creative Commons Attribution License , which permits unrestricted use, distribution, and build upon your work non-commercially.
 a Creative Commons Attribution 4.0 International License. Based on a work at www.crimsonpublishers.com.
Best viewed in


.jpg)


 Editorial Board Registrations
 Submit your Article
 Refer a Friend
 Advertise With Us
.jpg)


.jpg)


.bmp)
.jpg)
.png)
.jpg)


.jpg)


.png)

.png)


.png)


