
- About Us
- Information
-

The Author ensures that the research has been conducted responsibly and ethically with adherence to all relevant regulations. read more..
- For Authors
- For Reviewer
- Manuscript Guidelines
- Membership
- Publication Ethics
-
- Journals
- Reprints
- e-Books
- Videos
- Policies
- Contact Us
 COVID-19
- Submissions


Full Text
Advancements in Civil Engineering & Technology
Tipping Bucket Rain Gauge Performance Analysis under Heavy Rainfall
Liu KF1*, Jhou JM2, Wei SC1 and Chien CH3
1Department of Civil Engineering, National Taiwan University, Taiwan
2Department of Harbor Engineering, CECI Engineering Consultants, Inc, Taiwan
3Hydrotech Research Institute, National Taiwan University, Taiwan
*Corresponding author:Liu KF, Department of Civil Engineering, National Taiwan University, Taiwan
Submission: June 03, 2019;Published: June 18, 2019

ISSN: 2639-0574 Volume3 Issue3
Abstract
Rainfall index has become the most important index in all rainfall-induced natural disaster. Rainfall intensity in 5 or 10 minutes, accumulated rainfall amount in 1 hour to 24 hours are most used index. The dominate rainfall data comes from wide distributed traditional rainfall gauge. Although rainfall radars are used and considered to be better than traditional rainfall gauge, but Radar data still needs rain gauge data for calibration and justification. The dominant type of rain gauge is the ticking bucket rain gauge (TBR). This research derived the error and accuracy of TBR. The equations of motion were derived through the conservation of linear momentum and angular momentum. An initial value problem was obtained, and the input rainfall was calculated using the 4th order Runge-Kutta method. The result of the theory was compared with ISO certified indoor experiments with an error less than 1%. Then the result is compared with field measurement. It is found that high-intensity rainfall is usually underestimated from readings of tipping bucket rain gauge. The actual rainfall is greater than the reading with a surprising 40% error when rainfall intensity reaches 600mm/hr. But the error is not linear and is greater for high-intensity rainfall.
Keywords: Tipping bucket rain gauge; High rainfall intensity
Introduction
Rainfall data is one of the most important data in meteorology, hydrology, water resource, and natural hazards. The observed rainfall data describes weather characteristic and uses for meteorological models’ calibration from short-term rainfall forecast (1-7 days) to long-term projected climate (10-100 years). The rainfall data is also a critical input for simulations of hydrological processes and rainfall-triggered natural hazards in watersheds. For hydrological modelling such as runoff, flow discharge, and groundwater, they can further affect the water resource operation for reservoirs and water usage policies for agriculture, industry, and local people. For natural hazards simulations such as landslides, debris flows, and flooding, they can strongly influence the countermeasures, evacuation routes, and other disaster prevention policies. Besides, the rainfall amount in 1 hr. or 24 hrs. (intensity, accumulated rainfall) and duration are frequently used index for warning of landslides or debris flows [1-3] all over the world. The rain gauge data is considered to be crucial for a wide variety of usages as well as influenced the interpretation of research results.
There are several types of rain gauge in practice, traditional or radar. Doppler rainfall radar systems are considered to be better than traditional mechanical rainfall gauge because it can obtain rainfall data in a large area. But Radar data needs ground mechanical rain gauge data for calibration and justification. The most used mechanical rain gage is tipping bucket rain gauge (TBR) [4]. The resolution of the TBR is decided by the maximum water capacity (nominal volume) of one bucket. When the inflow rainwater is greater than the nominal volume in one side, the buckets will tip from one side to the other and record one nominal column at the same time. In this design, the loss of rain volume usually appears during the finite time of the tipping movement of buckets (disregard the environmental factors). This loss usually increases in a non-linear increment of rainfall intensity and always results in the under catch of the actual amount of rain [5-7], especially in high rainfall intensity. For example, in indoor experiments, the underestimated rainfall measured by 0.1, 0.2, 0.5, 1mm resolution TBR can reach 37%, 30%, 15%, 8% respectively when rainfall intensity reaches 600mm/hr. [8]. Therefore, the observed records of the TBR should be corrected for actual amount of rain. Furthermore, the maxima detectable rainfall intensity for the TBR in different resolution should be defined as well.
To modify the TBR records, the experiments calibration was usually applied in past studies. There is no theory has been developed to predict rainfall by simulating the dynamic movement of tipping buckets. This research provided a theory to describe the dynamic tipping movement of the buckets. The theory was derived through the conservation of linear momentum and angular momentum step by step in section 2. With the proposed theory, the transient tipping process was simulated and validated with indoor experiments. The performance of the TBR and its application range of rainfall intensity was discussed as well.
Fundamental Theory
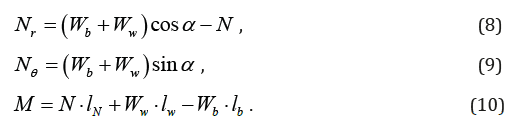
In TBR design, the mechanical process can separate into two stages: 1) stationary stage and 2) buckets rotation stage. In first stage, the buckets are stationary until the filled rainwater greater than the nominal volume in one side of the buckets. As the increased water level, the center of water mass gradually moves away from the pivot. The free body diagram for single bucket is shown in Figure 1. Because the system of the buckets still at rest, the static equilibrium in each time steps can be solved through the simple force balance and moment balance (Table 1). The static equilibrium in 2D are
Figure 1:Free body diagram of a single bucket.

Table 1:Lists of Symbols.

Force balance
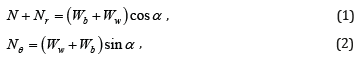
Moment balance

The conservative of mass
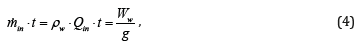
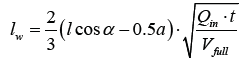
and the geometric relationship gives the distance lw in
By applying virtual work,
we can solve all the unknowns as
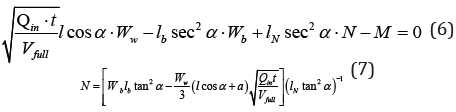
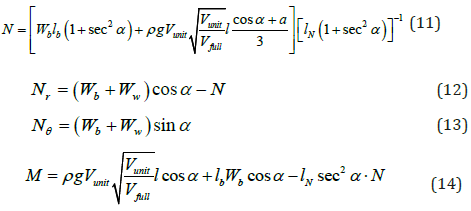
This provides the equilibrium condition when the bucket is stationary. When there is just enough rainfall to initialize the bucket motion, it is when Qin ⋅t = Vunit . So, all forces at the initial of motion are
After this condition is satisfied, we should move from static equilibrium to dynamic equilibrium. The buckets start to revolve around the pivot and the filled water start to flow out. The new force balance is depicted in Figure 2.
Figure 2:A sketch of dynamic motion.

Since the water is flowing out, the whole system can be regards as variable mass system. The mass conservation is
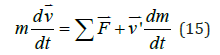
Linear momentum conservation equations are
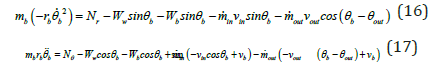
and angular momentum conservation is
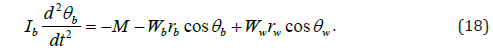
During rotating movement, it can be proved that the free surface remains horizontal. After summarizing all equations (16)~(18) and let most of variables substitute for known parameter. We could have these three equations.
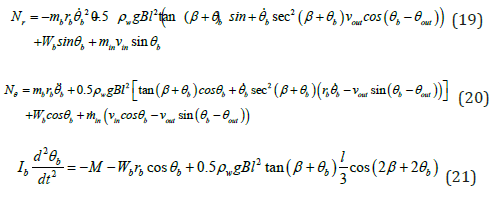
lb is the location of the center of mass of bucket and is solved from (21) as a function of time? (19), (20) and (21) are solved with 4th order Runge-Kutta method. The initial conditions are Eq. (12) to (14). The variation of lb indicates the movement of the bucket and can be compared with experiments.
Simulation and Validation
To validate the proposed theory, the widely used Takeda 1mm TBR was selected for test. In this experiment, the outer shell, rainfall collector, was removed for clear observation. A steady rainfall intensity was supplied using a fixed head inflow device, as shown in Figure 2. The TBR rain gauge was put in a tank and weighed by an electronic scale. With this design, the weight of inflow water can be recorded with time. The recordings of weight in buckets were calculated for validation of reaction forces. Besides, a video camera (~30 fps) was used to record the motion of bucket and the actual rotating angle of buckets was measured through video snapshots, as listed in Table 2. All these experiment setups are certified by ISO standard. Under rainfall intensity of 100mm/hr., the variation of rotation angle was simulated using Eq. (19)~(21) with initial condition of Eq. (12)~(14), as depicted in Figure 3. Compared to the experiment result, the maximum error of simulated rotation angle is less than 1%. The simulated result is in a good agreement with the measured one.
Table 2:Rotating angle of buckets caught by video camera.

Figure 3:Experimental setup of tipping bucket and fixed head inflow device.

Conclusion
This research used fluid mechanics and dynamics to solve the TBR motion The governing equations divide by two parts: static part and dynamic part. Static part governs by equations of equilibrium and virtual work method. Dynamic part governs by Navier-Stokes equations, conservative of angular momentum and continuity equation. The 4th order Runge-Kutta method was used to solve the system equations. Indoor experiments were used for validation. The theoretical value is very close to indoor experiments with error less than 1%. The simulation result shows that tipping time of Takeda 1mm TBR takes about 0.6 second. In this 0.6 second, tipping side is still catching water about 0.4 second. It means when the bucket tips, it’ll lost about 0.4 seconds rainfall data. This error will increase with increasing rainfall intensity. When rainfall intensity reaches 100mm/hr., the lost water amount during the lost 0.4s is 20%. Considering rainfall rarely distributed uniformly in time, a 100mm/hr. intensity usually means intensity is much larger in a shorter duration within that hour. Therefore, the actual error should be larger.
Acknowledgement
This research was supported by Soil and Water Conservation Bureau (SWCB) in Taiwan through Grant No.108AS-10.10.1-SB-S3, and partial support by Ministry of Science and Technology (MOST) in Taiwan through Grant No. 107-2625-M-002-015.
References
- Caine N (1980) The rainfall intensity-duration control of shallow landslides and debris flows: Geografiska annaler. Series A. Physical Geography 62(1-2): 23-27.
- Guzzetti F, Peruccacci S, Rossi M, Stark CP (2007) Rainfall thresholds for the initiation of landslides in central and southern Europe. Meteorology and Atmospheric Physics 98(3-4): 239-267.
- Guzzetti F, Peruccacci S, Rossi M, Stark CP (2008) The rainfall intensity- duration control of shallow landslides and debris flows: an update. Landslides 5(1): 3-17.
- Sevruk B (2002) WMO questionnaire on recording precipitation gauges: state-of-the-art. Water Sci Technol 45(2): 139-145.
- La BP, Lanza LG, Stagi L (2002) Tipping bucket mechanical errors and their influence on rainfall statistics and extremes. Water Sci Technol 45(2): 1-10.
- Sevruk B (1996) Adjustment of tipping-bucket precipitation gauge measurements. Atmos Research 42(1-4): 237-246.
- Duchon CE, Essenberg GR (2001) Comparative rainfall observations from pit and aboveground gauges with and without wind shields. Water Resour Res 37(12): 3253-3263.
- Hsieh LH, Chien CH, Chen MJ (2016) Calibration of tipping bucket rain gauge-case study in Taiwan: 2016 Conference on Weather Analysis and Forecasting, Taipei, Taiwan.
© 2019 Liu KF. This is an open access article distributed under the terms of the Creative Commons Attribution License , which permits unrestricted use, distribution, and build upon your work non-commercially.
Editor In Chief


.jpg)


Signup for Newsletter

Quick Links
 Editorial Board Registrations
 Submit your Article
 Refer a Friend
 Advertise With Us
Our Recent Edition

.jpg)


Top Editors


.jpg)


.bmp)
.jpg)
.png)
.jpg)


.jpg)


.png)

.png)


.png)


Financial Support

Sponsors

Latest e-Books

Latest Video

 a Creative Commons Attribution 4.0 International License. Based on a work at www.crimsonpublishers.com.
Best viewed in
a Creative Commons Attribution 4.0 International License. Based on a work at www.crimsonpublishers.com.
Best viewed in