- Submissions

Full Text
Archaeology & Anthropology:Open Access
Macroeconomic Factors and Business Cycles in Some Selected Open Economies
Oluremi Ogun*
Department of Economics, Nigeria
*Corresponding author: Oluremi Ogun, Department of Economics, Ibadan, Nigeria
Submission: January 10, 2023Published: June 22, 2023

ISSN: 2577-1949 Volume4 Issue5
Abstract
Five market economies were investigated in a panel analysis for the proximate determinants of business cycles from 1960 to 2013. The propositions tested cut across most of the relevant schools of thought on the subject. Policy contexts such as monetary, fiscal, trade, technology, and strictly exogenous factors were covered in the analysis. Cycles of policies/factors were generated via two filters and subsequently subjected to causality analysis. Exogenous variables of different varieties were indicated as the drivers of business cycles in the sample. Appropriate resource management should constitute a key aspect of the policy design.
Keywords:Monetary policy, Fiscal policy, Open economy macroeconomy, International business cycles, Technological change
Abbreviations:BP = Baxter-King’s band-pass filter; HP=Business cycle corresponding to Hodrick-Prescott Filter; CPI: Consumer Price Index (2005=100); DY=Domestic Output (GDP); EXDT=External Debt; FIMP=Fiscal Impulse Measured as the ratio of government expenditure to government revenue; FTTDY1=Fitted income series at lag 1; FTTDY4=Fitted Income Series at lag 4; FRIR=Foreign Real Interest Rate computed as the average 6 months deposit rate for USA, UK, Germany, Italy, Netherlands, France, Japan, and Switzerland; FYCUT= Industrial or foreign countries’ output at current prices; GCS=Government Consumption Spending; GEX= Government Expenditure; GIE=Government Investment Expenditure; GREV=Government Revenue; IIO= Index Of Domestic Industrial Output (2005=100); INDT=Internal Debt; INF=Domestic Inflation computed as the logarithmic change in CPI; RIR=Domestic Real Interest Rate; M1=Narrow Money Supply; M2=Broad Money Supply; MB1=Narrow Monetary Base; NFA=Net Foreign Assets; OP = Crude Oil Price; OPS= Openness; PCS=Private Consumption Spending; PIE=Private Investment Expenditure; PSC=Private Sector Credit; RER =Unweighted Multilateral Real Exchange Rate (average of five countries’ RER); TDBC=Trade Balance; and, TOT=Terms of Trade.
Introduction
The influence of macroeconomic factors on business cycles could emerge from two sources: errant domestic or endogenous policies and external sector-linked exogenous developments. In either case, critical growth variables experienced significant adverse movements with industrial production and domestic output as the ultimate casualties. Thus, a scientific inquiry into the culpable macroeconomic factors and transmission mechanisms could help greatly our understanding of the growth dynamics of countries and the likely ‘hedging’ strategies to reduce impact and possibly minimize the frequency of occurrence. This paper is devoted to the analysis of the role of macroeconomic factors in the business cycles of five differentiated developing market economies: Nigeria, South Africa, Mexico, Singapore, and India. To avoid traversing familiar grounds, the study adopted the key highlights of earlier literature [1] as they related to the Classical theory (encapsulating the Real Business Cycle theory), the Monetarist theory, the New Classical Macroeconomic School, the Keynesian School, and its variants notably, the New Keynesian School. The rest of the paper is organized as follows. In section 2, stylized economic facts on the case studies are presented. This is followed by a discussion of the analytical framework, methodology, and preliminary operations. The empirical analysis comes next while some concluding observations constitute the final discourse.
Synopsis of Growth Episodes
Nigeria
The Nigerian economy appeared to have recorded significant growth performance in the period between 1961 and 2014. As measured by the growth rate of GDP, there appeared to have been about three episodes of growth: 1961-’73 with a peak of about 8%, 1981-’84 with a peak of about 11%, and 2001-2004 with the highest rate of about 12% in 2004. The main drivers of growth in output during the period appeared to have been agriculture, oil and mining, general commerce, and services. Developments in some key macroeconomic variables revealed that, at its peak, agriculture contributed about 64% of GDP in 1960. This proportion declined to about 31.5% and 20.86% in 1990 and 2015 respectively. The recorded decline was not due to an increase in the industrial sector’s share rather it was occasioned by the neglect of the agricultural sector with oil and mining gaining ascendency to the foremost sector in revenue and foreign exchange generation. However, a major fallout of the policy lapse was that the economy had by 1982 become a net importer of basic food items. The apparent increase in industry and manufacturing GDP proportions over the period could be attributed to the industrialization pace activated by oil exports’ revenues. Inflation episodes over the period were volatile, rising from a single digit in the 1960s to an all-time high of 72.74% in 1995 but by 1998, the inflation rate had fallen to 10%. Since around 2005, the country had been carrying an ambitious reform agenda, the most far-reaching element of which was basing the federal budget on a conservative reference price for oil, with any excess saved in a special Excess Crude Account (ECA). The challenging process of implementing reforms was revitalized in August 2010 through the 2010 Roadmap that outlined the government’s strategies and actions to undertake comprehensive power sector reform to expand supply, open the door to private investment and address some of the chronic issues hampering the improvement of service delivery in the sector [2].
South Africa
The growth experience of South Africa over the past few decades provided a good example of the link between growth and investment. The country had abundant human, financial and natural resources. It also had very good infrastructure compared to other countries on the African continent. In the 1980s and 1990s, the country experienced average growth rates of 1.4% and 1% respectively. And, over the past decade, there had been a significant improvement in economic growth performance with an average growth rate of 3.9% for the period 2000-2010. The country could therefore be described as recording only one major growth episode that appeared to have peaked in 2005. Nevertheless, the growth rate of the 2000-2010 era was below those of fast-growing developing countries and, also well below the 5.3% average growth rate on the continent. Investment ratios in the country remained relatively unchanged over the past few decades. Over the period 1990–1999, the average investment to GDP ratio was 17.80 percent and for the period 2000-2011, it was about 18.85 percent, compared to the continental average of 18.91 and 19.45 percent and the world average of 19.45 and 22.15 percent for the same respective periods. The average investment ratio was about 16.3% in the period 1990- 1999 and about 17.9% from 2000-2011. Eyraud [3] presented evidence indicating that South Africa’s investment rate was indeed low when compared with fast-growing developing countries and that sluggish investment undermined growth in the country. Furthermore, he argued that investment in South Africa had been constrained largely by low private savings due to structural factors such as the high dependency ratio and increased urbanization. High real interest rates had also been found to hurt investment in South Africa. Generally, agriculture, industry, and price level changes appeared to have been the crucial growth-defining factors over the period, from 1960 to 2010.
Singapore
Singapore’s economic strategy produced real growth averaging 8.0% from 1960 to 1999. The economy picked up in 1999 after the regional financial crisis, with a growth rate of 5.4%, followed by 9.9% in 2000. However, in 2008-2009, the average growth rate again declined sharply due to the global financial crisis and uncertainty in export demands. The country appeared to have recorded three major episodes of the growth cycle with successive peaks of about 13% (1967), 8.5% (1988, through to 1993), and about 6% (2010). There had been low levels of inflation of around 3% annually for several decades, except in the period 1971-1975 when it rose to an average of 9.7% due mainly to the oil crisis and inflationary trends in Western economies. A stable macroeconomic environment with low inflation had positively encouraged long-term business perspective in the planning of investment decisions and provided good returns on investments. Singapore’s saving rates were among the highest in the world. The mobilization of domestic resources appeared to have played a very important role alongside foreign capital in the economic development of the country. High savings and investment marked the development policy of Singapore state. According to [4], the gross national savings had steadily increased from minus 3% in the 1960s to an average of 28% in the 1970 and, 41% in the 1980s and reached nearly 45% by 2001. However, the deficits between savings and investment during the period, 1965- 85, were due to a rise in investment rather than a decline in savings, which coincided with rapid industrialization and expanding industries. Despite many obstacles, Singapore managed to attain prosperity within a short period. Retrospectively, in the mid-1960s, Singapore had a large pool of less-educated workforce, high levels of unemployment and poverty, and along with the availability of poor natural resources, it had limited development options [5]. The structural transformation that took place caused a shift toward manufacturing activity as its share of GDP grew from 16.6% in 1965 to 36% in 1980 and in 1993, it contributed about 34% of the total GDP and accounted for nearly 28% of employment. The economy also witnessed the growing importance of the services sector with prominent activities such as transport, communications, business, and financial services. Since the early 1980s, the country had moved towards becoming an international financial center and this became increasingly vital for the economy’s overall growth. And in 1993, services provided about 27% of the GDP and 11% of the total employment [6].
India
India is developing into an open-market economy yet, traces of its past autarkic policies remained. The country recorded an impressive average growth performance of about 7% per year from 1997 to 2008. However, it appeared to have experienced three major episodes of growth cycles: 1963-’67, 1975-’87, and 1993-2007 with successive peaks of about 5%, 6% and 8%. Economic liberalization measures, including industrial deregulation, privatization of stateowned enterprises, and reduced controls on foreign trade and investment, began in the early 1990s and served to accelerate the country’s growth. India’s diverse economy encompasses traditional village farming, modern agriculture, handicrafts, a wide range of modern industries, and a multitude of services. Slightly less than half of the workforce was in agriculture, but services were the major sources of economic growth, accounting for nearly twothirds of India’s output with less than one-third of its labor force. India’s long-term growth outlook was moderately positive due to a young population and corresponding low dependency ratio, healthy savings and investment rates, and increasing integration into the global economy. However, [7] indicated that the volatility statistics of key macroeconomic variables in India presented a mixed picture. For example, the volatility of aggregate GDP declined from 2.13 in the pre-reform period to 1.78 in the post-reform period. This was attributed to a decline in the volatility of the agricultural GDP from 4.26 in the pre-reform period to 2.56 in the post-reform. Similarly, the volatility of investment declined from 5.26 in the pre-reform period to 5.10 in the post-reform period. Consumer prices, imports, government expenditure, and nominal exchange rate also became less volatile in the post-reform period. However, the fall in volatility was not common to all the macroeconomic variables that were considered in their study. Private consumption and exports experienced marginal increases in volatility from 1.82 to 1.87 and 7.14 to 7.71 respectively in the post-reform period. Further, available statistics from World Development Indicator (WDI) suggested that growth in 2012 fell to a decade low of 5.6% as economic leaders struggled to improve the country’s wide fiscal and current account deficits. Rising macroeconomic imbalances in the country and improved economic conditions in the West led investors to shift capital away from India, prompting a sharp depreciation of the rupee.
Mexico
In Mexico, agriculture as a percentage of total GDP had been steadily declining, and gradually resembled that of developed economies in that it played a smaller role in the economy. In 2006, agriculture accounted for 3.2% of GDP, down from 7.9% in 1990, and 12.73% in 1970. However, it employed a considerably high percentage of the workforce: 18% in 2003, most of whom grew basic crops for subsistence, compared to 2-5% in developed countries where production was highly mechanized. The macroeconomic policies of the 1970s left the Mexican economy highly vulnerable to external conditions. These conditions turned sharply against Mexico in the early 1980s causing the worst recession since the 1930s with GDP growth falling to a negative of 4.2% and 3.8% in 1983 and 1986 respectively. From around mid-1981, Mexico was beset by falling oil prices, higher world interest rates, and rising inflation that reached an all-time high of about 75.8% in 1986. By 1988, inflation had been brought under control, fiscal and monetary discipline was attained, relative price adjustment was achieved, structural reforms in trade and public-sector management were underway, and the economy was bound for recovery. However, these positive developments were inadequate to attract foreign investment and return capital in sufficient quantities for sustained recovery. A shift in development strategy became necessary, predicated on the need to generate a net capital inflow. In April 1989, the government announced a national development plan for 1989-94, which called for annual GDP growth of 6 percent and an inflation rate similar to those of Mexico’s main trading partners. The policy measures put in place appeared to have yielded positive results as the inflation rate came down to about 3.61% in 14 and the economy started showing signs of recovery.
Analytical Framework, Methodology, and Preliminary Analysis
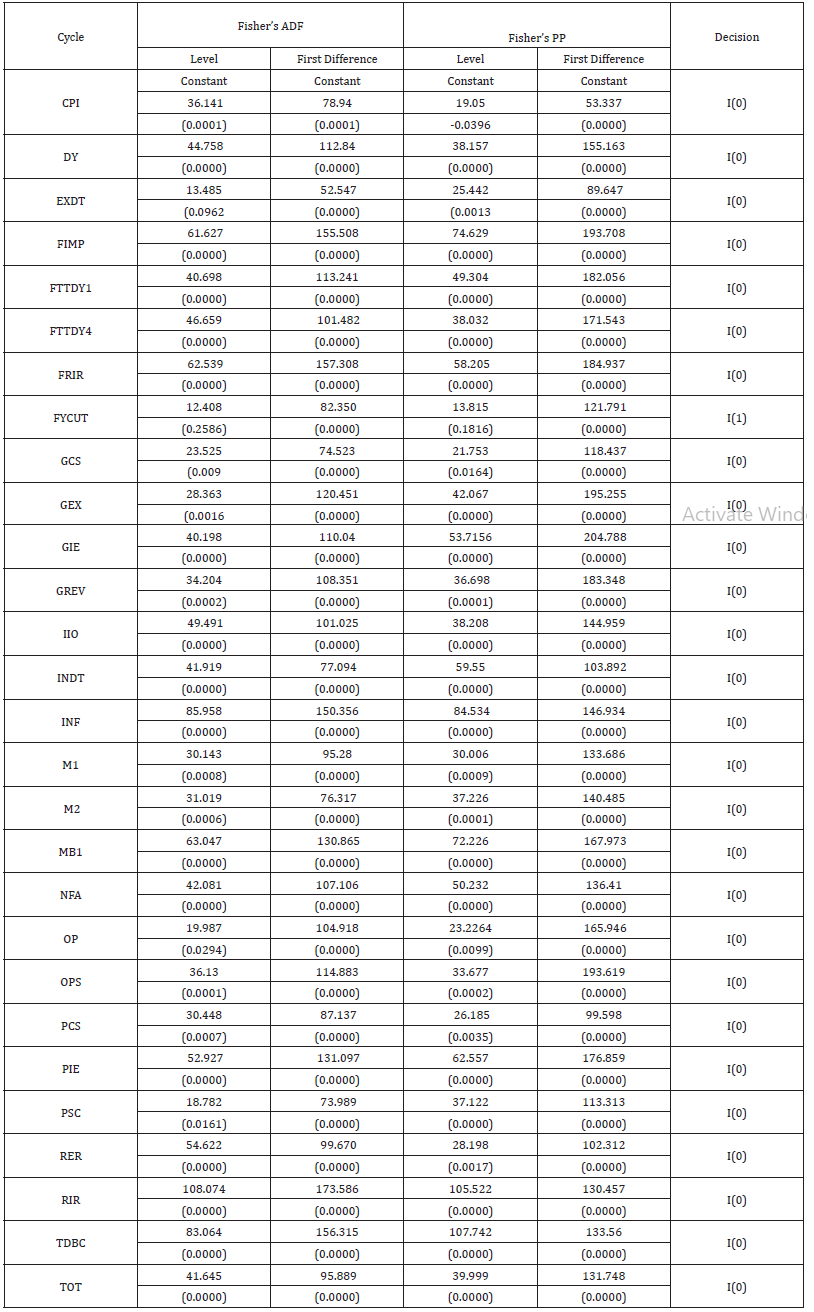
This study had to do with business cycle drivers in the open economy context. Essentially, it was a macro study of economic fluctuations cutting across monetary, fiscal, trade, and external sector-related issues, and technological changes as well as strictly exogenous (or world economic) factors. Thus, the propositions tested in the study covered the potency of monetary factors [8- 15], fiscal factors [16-18], trade/external sector linked factors [19-21], technology shocks [22-24], and exogeneity [8,25,26]. Also, to properly anchor the analysis within this framework, the prime question posed in the study was, could cycles in particular types of policies or exogenous occurrences explain cycles in domestic output? A bivariate panel causality analysis (of the Granger type) was deployed to handle this question. It was an atheoretical method in which the expectation of the result was reflected in the alternative hypothesis. The data employed in the analysis were obtained from [27]. Apart from being a panel study of five countries, this study also differed from [1] in one important respect. A fallout of [1] was the abysmal performance of fiscal factors; to explore all possible angles through which they could affect aggregate demand and/or industrial productions, government expenditure was decomposed into its consumption and investment constituents. Also, in line with the suggestion of the Monetarists to adopt a broad perspective on expenditure, private expenditure was introduced in the form of consumption and investment components. Further, following the suggestion in [1] on the proxy for technological changes, two types of trend GDP (at one and four lags) were used. Detrending of the various series was undertaken using Baxter-King’s Band-Pass (BP) and Hodrick-Prescott (HP) filters. The idea was to generate the cyclical components of the series which were expected to be stationary. However, to assure the expected outcome, checks on the unit root status of the series were conducted using the procedures of Fisher’s Augmented Dickey-Fuller (Fisher’s ADF) and Fisher’s Phillips Perron (Fisher’s PP) tests. The results were as presented in Table 1 & 2. As could be seen, in both BP and HP filters, all series except foreign income under the HP filter were integrated at level. The exception was integrated at first difference.
Table 1:Unit Root Tests - BP Filter.
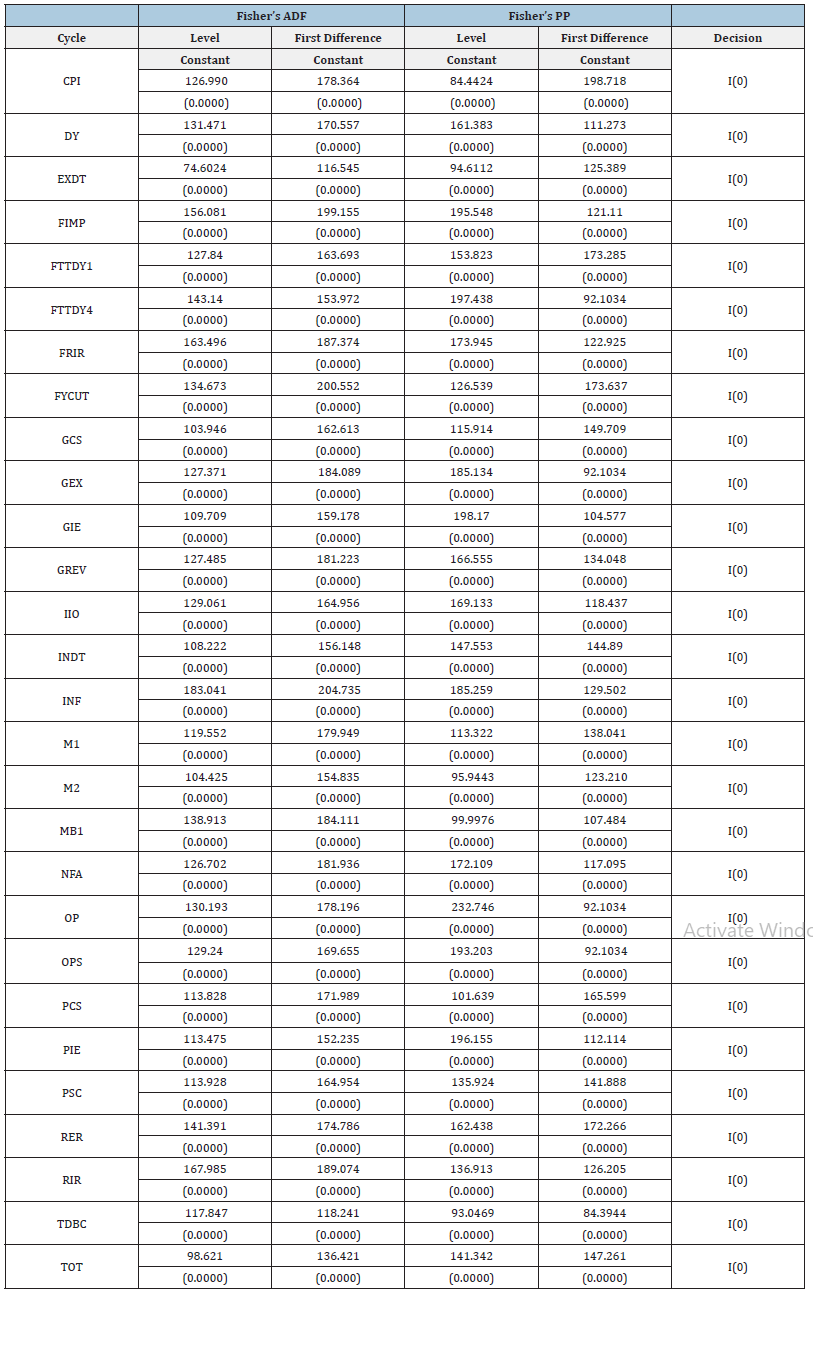
Table 2:Unit Root Tests - HP Filter.
The Result and Discussion
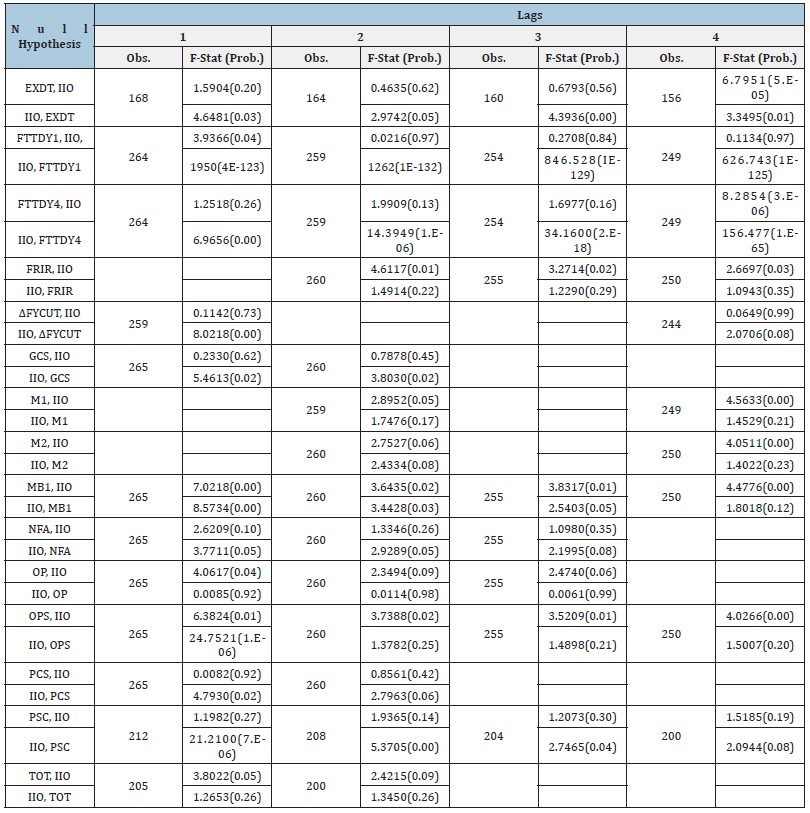
The results of the causality tests were presented in Table 3-6 and discussed under the different filters and common occurrences.
Table 3:Domestic Output (DY)-BP Filters.
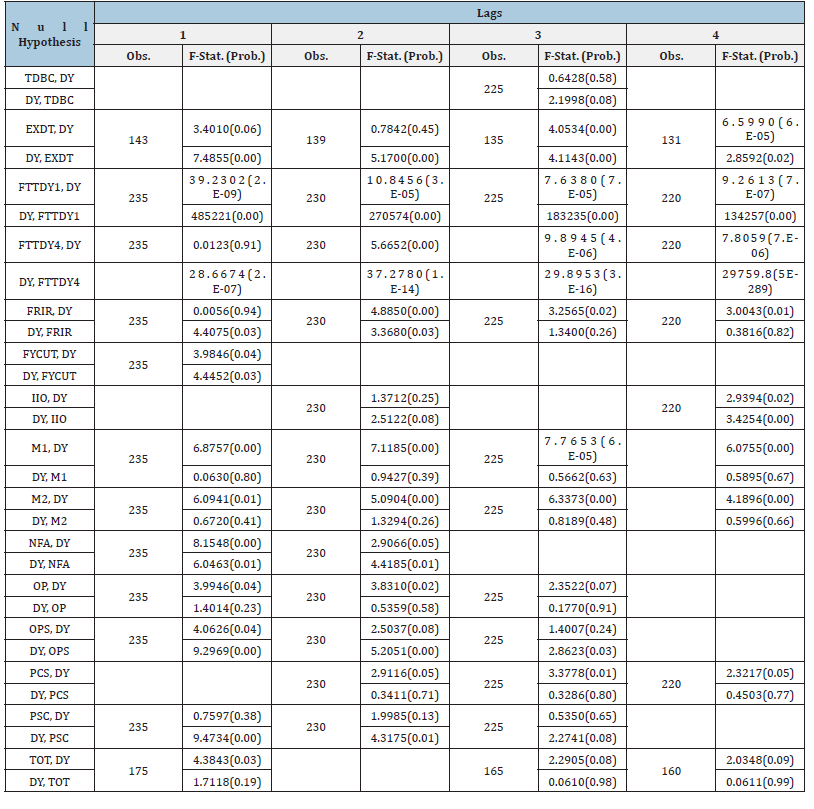
Table 4:Industrial Output (IIO)-BP Filters.
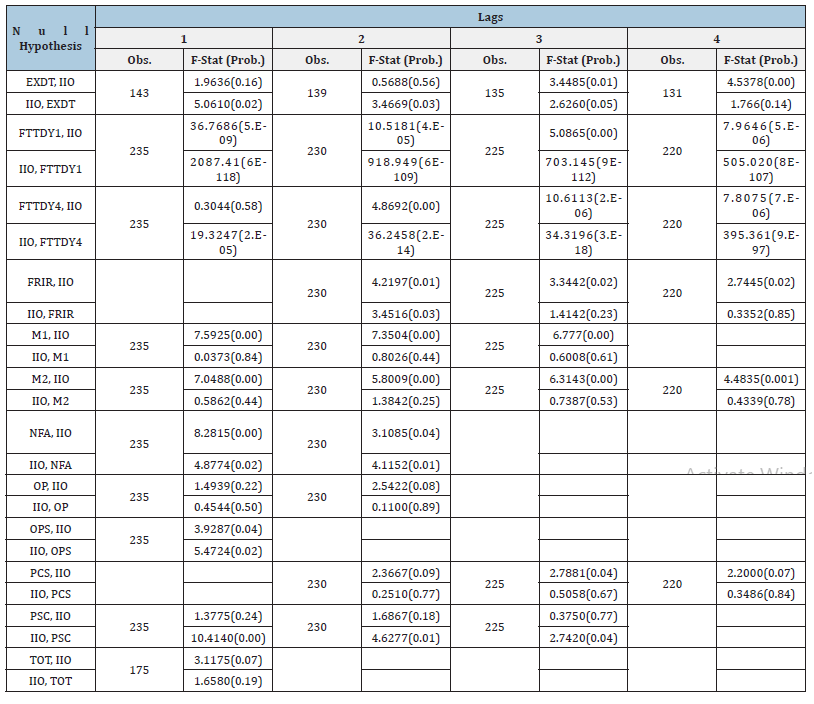
Table 5:Domestic Output (DY)-HP Filters.
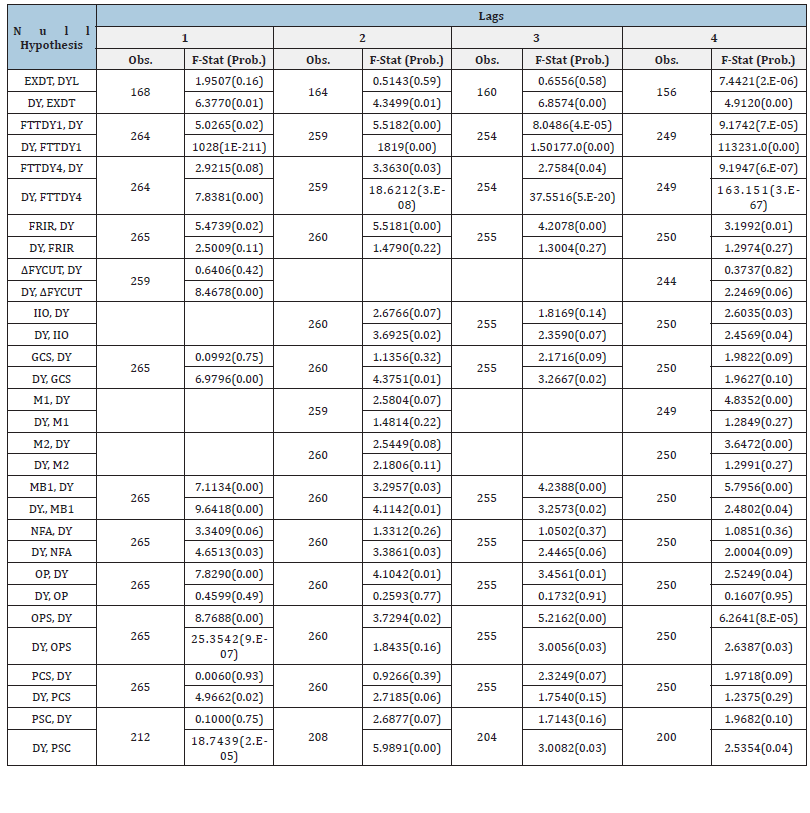
Table 6:Industrial Output (IIO)-HP Filters.
BP Filter
Considering DY: at lag 1, MI, M2, and OP Granger-caused DY unidirectionally while, EXDT, FTTDY1, FTTDY4, FYCUT, NFA, and OPS causalities were bidirectional. M1, M2, and OP repeated the unidirectional causality performance at lag 2 with FTTDY1, FTTDY4, FRIR, NFA, and OPS as bidirectional. At lag 3, FRIR, M1, M2, OP PCS, and TOT Granger-caused DY unidirectionally while EXDT, FTTDY1, and FTTDY4 were bidirectional cases. Lastly, at lag 4, DY was Granger-caused unidirectionally by FRIR, M1, M2, PCS, and TOT with EXDT, FTTDY4, and IIO as bidirectional. Considering IIO: at lag 1, M1, M2 and TOT were the unidirectional causality cycles while FTTDY1, NFA, and OPS were bidirectional. At lag 2, M1, M2, OP, and OPS Granger-caused DY unidirectionally while FTTDY1, FTTDY4, FRIR, and NFA had bidirectional effects. At, lag 3, FRIR, M1, and M2 constituted the unidirectional causality cycles with EXDT, FTTDY1, FTTDY4, and PCS as bidirectional. Finally, at lag 4, FRIR, M2, and PCS were unidirectional while EXDT, FTTDY1, FTTDY4, and DY were bidirectional.
HP Filter
Considering DY: at lag 1, FRIR, OP, and TOT Granger-caused DY unidirectionally with FTTDY1, FTTDY4, MB1, NFA, and OPS being bidirectional. At lag 2, the unidirectional causalities involved FRIR, M1, M2, OP, OPS, and TOT with FTTDY1, FTTDY4, IIO, MB1, and PSC coming as bidirectional. At lag 3, FRIR, OP, PCS, and TOT were the unidirectional causalities while FTTDY1, FTTDY4, GCS, MB1, and OPS were bidirectional. Lastly, at lag 4, FRIR, GCS, M1, M2, OP, and PCS constituted the unidirectional causalities with EXDT, FTTDY1, FTTDY4, IIO, MB1, and OPS as the bidirectional cases. Considering IIO: at lag 1, only two cycles Granger-caused IIO unidirectionally - OP and TOT while three cycles were bidirectional - FTTDY, MB1, and OPS. At lag 2, FRIR, M1, OP, OPS, and TOT were unidirectional causalities with M2 and MB1 as bidirectional. At lag 3, FRIR, OP, and OPS were unidirectional while only MB1 was bidirectional. Finally, at lag 4, FRIR, M1, M2, MB1, and OPS were unidirectional, EXDT and FTTDY4 were bidirectional. In general, under the BP Filter, TOT causalities were observed to have been established at 10%; GCS and PCS causalities were mostly at the same level of significance under both filters. All others were at 1% or 5%.
Common grounds
At lag 1, no unidirectional causality was recorded but FTTDY1, NFA, and OPS were bidirectional. At lag 2, M1 and OP were unidirectional with FTTDY1 and FTTDY4 as bidirectional. At lag 3, OP, PCS, and TOT were the unidirectional causalities while FTTDY1 and FTTDY4 were bidirectional. At lag 4, FRIR, M1, and M2 were the common unidirectional causalities with FTTDY1, FTTDY4, and IIO as the bidirectional ones. Thus, the most common unidirectional causalities (as at least, 50% frequency) were M1 and OP while FTTDY1 and FTTDY4 qualified for bidirectional status.
Conclusion
The result of the investigations in this study revealed that money, narrowly defined, the price of crude oil, and technological changes were the credible drivers of business cycles in the countries examined. By implication, the drivers of output and industrial production cycles in these economies were mostly exogenous. Thus, the result appeared to have narrowed the focus of policy authorities in these countries to resource management. In the first place, a rule-based monetary policy could be beneficial in ensuring stability in investment and output growth. Secondly, the implication of the finding on the oil price is two-pronged. For the only crude oil exporter in the sample, Nigeria, the recommendations detailed in Ogun (2020) [1] on the management of revenue from oil export to ensure macroeconomic stability appear to apply in all respects. Thus, the use of a conservative bench-mark for fiscal budget could ensure significant fiscal savings in times of boom to be applied for expenditure smoothening in recession. For the rest of the sample that were major oil importers, savings would have to be generated from non-oil-linked activities. This might not be arduous given the remarkable saving rates in Singapore, Mexico, and India. However, patronage of fuel-efficient production technologies could be a rewarding hedging tactic. The fallout of the result on technological factors would appear to point in the direction of little interventional efforts by these countries. Being bidirectional, technological changes also generated benefits. However, understanding the sources of the changes (that is, the activities accounting for the technical changes) could aid the design of policies to reduce the duration of the linked cycles.
References
- Ogun O (2020) Business cycle drivers in an open economy. Global Economics Science 1(1): 23-30.
- Nigeria Vision 20: 2020 (2009) The economic transformation blueprint. Abuja: Government printer.
- Eyraud L (2009) Why isn`t South Africa growing faster? A comparative approach. International Monetary Fund Working Paper WP/09/25. Washington, D.C.
- Phang SY (2001) Housing, policy, wealth formation and the Singapore economy. Housing Studies 16(4): 443-459.
- Shin JS (2005) The role of state in the increasingly globalized economy: Implications for Singapore. The Singapore Economic Review 50(1): 103-116.
- Mookerjee R, Yu Q (1997) Macroeconomic variables and stock prices in small open economy: The case of Singapore. Pacific-Basin Finance Journal 5(3): 377-388.
- Ghate C, Pandey R. Patnaik I (2011) Has India emerged? Business cycle stylized facts from a transitioning economy. Indian Statistical Institute, Delhi Planning Unit, Discussion Paper 11-05.
- Friedman M, Schwartz AJ (1963) A monetary history of the United States, 1867 to 1960. Princeton University Press.
- Friedman, M, Schwartz AJ (1965) Money and business cycles. In: Schwartz AJ (Ed.), Money in historical perspective, Boston: National Bureau of Economic Research, pp. 24-77.
- Friedman M (1968) The role of monetary policy. American Economic Review 58(1): 1-17.
- Andersen L, Jordan J (1968) Monetary and fiscal actions: A test of their relative importance in economic stabilization. Federal Reserve Bank of St. Louis Review 50(November): 11-23.
- Barro RJ, King RG (1984) Time-separable preferences and intertemporal substitution models of business cycles. Quarterly Journal of Economics 99(4): 817-839.
- De Long JB (2000) The triumph of monetarism? Journal of Economic Perspectives 14(1): 83-94.
- Dobrescu M, Badea L, Paicu C (2012) Business cycle theories and their relevance to the current global crisis. Procedia-Social and Behavioral Sciences 62: 239-243.
- Rossi S (2022) Milton Friedman and the monetarist school. In: Bougrine H, Rochon LPR (Eds.) A brief history of economic thought: From the Mercantilists to the Post Keynesians, Edward Elgar, Cheltenham, UK and Northampton, MA, USA, pp. 193-210.
- Ando A, Modigliani F (1965) The relative stability of monetary velocity and investment multipliers. American Economic Review 55(4): 693-728.
- McGrattan ER (1994) The macroeconomic effects of distortionary taxation. Journal of Monetary Economics 33(3): 573-601.
- Kehoe PJ, Midrigan V, Pastorino E (2018) Evolution of modern business cycle models: Accounting for the great recession. Journal of Economic Perspectives 32(3): 141-166.
- Mendoza EG (1995) The terms of trade, the real exchange rate, and economic fluctuations. International Economic Review 36(1): 101-137.
- Justiniano A, Primiceri GE, Tambalotti A (2010) Investment shocks and business cycles. Journal of Monetary Economics 57(2): 132-145.
- Bianchi J (2011) Overborrowing and systemic externalities in the business cycle. American Economic Review 101(7): 3400-3426.
- Prescott EC (1986) Theory ahead of business cycle measurement. Carnegie-Rochester Conference Series on Public Policy 25: 11-44.
- Plosser CI (1989) Understanding real business cycle. Journal of Economic Perspectives 3(3): 51-77.
- Dobrescu M (2017) An inquiry into modern business cycle theory. International Journal of Advances in Management and Economics 6(5): 41-53.
- Easterly W (1999) The lost decade: explaining developing countries’ stagnation in spite of policy reform 1980-1998. Journal of Economic Growth 6(2): 135-157.
- Beaudry P, Portier F (2014) Understanding noninflationary demand-driven business cycles. NBER Macroeconomic Annual 28(1): 69-130.
- World Bank (2016) World development indicators. The World Bank, Washington, DC.
© 2023 Oluremi Ogun. This is an open access article distributed under the terms of the Creative Commons Attribution License , which permits unrestricted use, distribution, and build upon your work non-commercially.
 a Creative Commons Attribution 4.0 International License. Based on a work at www.crimsonpublishers.com.
Best viewed in


.jpg)


 Editorial Board Registrations
 Submit your Article
 Refer a Friend
 Advertise With Us
.jpg)


.jpg)


.bmp)
.jpg)
.png)
.jpg)


.jpg)


.png)

.png)


.png)


