- Submissions

Full Text
Aspects in Mining & Mineral Science
Is there A Relationship between Volumetric Quantities and Volumetric Strain Curves?
Akinbinu VA* and Owolabi AO
Department of Mining Engineering, Federal University of Technology, Nigeria
*Corresponding author: Akinbinu VA, Department of Mining Engineering, Federal University of Technology, P.M.B. 704 Akure, Nigeria
Submission: February 06, 2018;Published: April 17, 2018

Volume1 Issue5April 2018
Abstract
The aim of this work is to show whether or not a relationship exists between the different volumetric strain quantities and to assess also whether the volumetric quantities are related to the different types of volumetric strain curves under failure-deformation process of hard brittle rocks. Tests were conducted to determine the complete stress-strain curves of different 83 rocks types under uniaxial compression using a closed loop servocontrolled testing system. The rocks failure-deformation behaviours curves were characterized and coordinated into groups of three different types of volumetric strain curves. The volumetric strain quantities were estimated which include, the elastic volumetric strain, slope of the normalised stressvolumetric strain curves and the maximum total volumetric strain. These volumetric strain quantities were compared with each other. The result show that the volumetric strains quantities are related by power form law. The volumetric strain quantities were also compared for each group of the three types of volumetric curves. It was established that there is connection between the volumetric strains quantities and the types of the volumetric strains curves. The relationship show a power form law and the curves become more concave from type one to type two and type three volumetric strain curves respectively.
Introduction
Literature review
Deformation and fracture characteristics of brittle rocks have been studied by earlier researchers Bieniawski [1-3]. The common agreement among them was that the failure process occurs in stages. The stages were determined from stress-strain characteristic curves obtained from axial and lateral deformation measurements during laboratory uniaxial compression test. Brace et al. [4] & Bieniawski ZT [5] evaluated stress-strain behaviour of a deformed material and classified the deformation steps in the brittle fracture process Figure 1 as follows:
a) Closing of cracks (or crack closure) (stage I),
b) Linear elastic deformation (or fracture initiation) (stage II),
c) Stable fracture propagation (or Critical energy re-lease) (stage III),
d) Unstable fracture propagation (or material failure) (stage 1V) and
e) Failure and post-failure behaviour (or structure failure) (stage V).
Kim et al. [6] observed that most of the damage (about 78 % of the total damage) occurred after the crack damage stress. They found that the unstable crack propagation and crack coalescence played a much larger role than initiation of new cracks and stable crack growth in the development of significant damage in rock.
They assumed that damage accumulation does not occur below the crack initiation stress threshold. This position was based on the fact that damage does not accumulate in an elastic region of a material, that is, between crack closure and crack initiation.
Figure 1: Normalized stress-strain curves, marble specimen for type 1 volumetric strain curves.
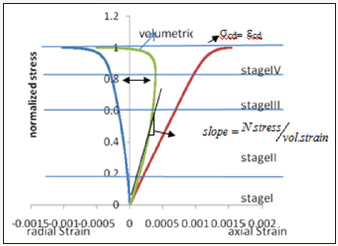
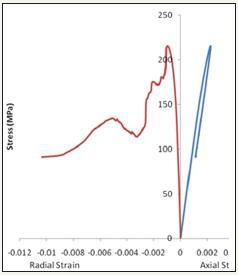
The crack damage stress σcd is the stress level at which the maximum total volumetric strain is attained Palchik [7]. Therefore at the point of crack damage stress σcd the maximum total volumetric strain is attained (i.e. σcd=Ɛcd). The point at which σcd=Ɛcd defined the type one and type two volumetric strain curves in which type one has negative total volumetric strain (Figure 1) with the post-failure characteristic curves shown in Figure 2 and type two with positive total volumetric strain (Figure 3) with the post-failure characteristic curves shown in Figure 4.
Figure 2: Post-failure stress-strain curves, marble specimen.+ve total vol. strain reversal at σcd
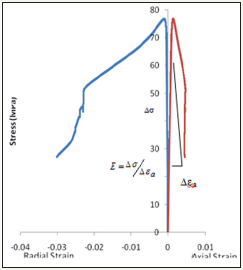
Figure 3: Normalized stress-strain curves, troctolite specimen for type 2 volumetric strain curves
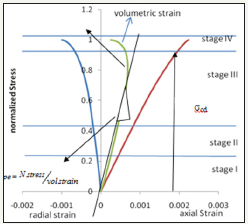
Figure 4: Post-failure stress-strain curves, troctolite specimen.
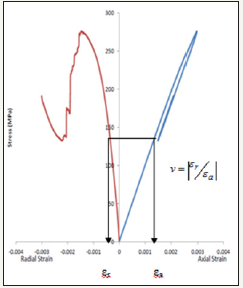
The type one and type two volumetric strain curves have reversal at crack damage stress level σcd. When the maximum total volumetric strain is attained at the uniaxial compressive strength of the rocks, σc (i.e. σcd=σc) define the type 3 volumetric strain curve. In this case, the bulk volume of rock decreases until failure occurs (Figure 5) with the post-failure characteristic curve shown in Figure 6. The mechanical properties of the 83 different rocks types and origins consisting of igneous, sedimentary and metamorphic rocks exhibited the different types of the volumetric strain curves (type one, type two and type three).
Figure 5: Normalized stress-strain curves, quartzite2 specimen for type 3 volumetric strain curves.
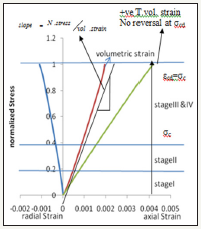
Figure 6: Post-failure stress-strain curves, quartzite2 specimen.
Most researchers in rock mechanics studies have so far been focused on the crack damage stress (σcd) and uniaxial compressive strength (σc) of characteristic stress levels during compression in which σcd=Ɛcd and σcd=σc to evaluate damage in rocks [8-11]. This work will evaluate different types of volumetric strain quantities and their relationships. It will also evaluate their relationships for different groups of volumetric strain curves types. This work will at-tempt to provide answers to the following questions. Is there a connection among the volumetric strain quantities? Is the volumetric strain quantities related to the types of the volumetric strain curves? To the author’s knowledge, so far no experimental results have been published, which describe the connection between the type of volumetric strain curves and volumetric strain quantities.
Method
Complete stress-strain curves were determined under unconfined uniaxial compression test using a closed loop servocontrolled testing system in order to estimate the mechanical properties of 83 different rocks types from different origins (53 igneous, 10 sedimentary and 19 metamorphic). The testing procedures for the determination of complete stress-strain curves of the rocks have been done according to ISRM (2007) suggested method. The strength parameters were estimated according to ISRM (2007) suggested methods. In this case the UCS is the stress level at specimen failure load. The elastic modulus, E, is estimated as the average modulus of the slope of linear portion of axial stressstrain curves (this is estimated at about 30 % to 70 % at the axial stress level) (Figure 2). The Poisson’s ratio, v is calculated as the ratio of radial strain to axial strain at 50 % axial stress level (Figure 6). Five tests were performed for each rock type and the average value estimated.
The stress-strain curves were determined for the different 83 rocks types with UCS ranging from 640.9 MPa to 43.7 MPa with an average value of 216.1 MPa and E ranging from 150 GPa to 25 GPa with an average value of 69 GPa; and v ranging from 0.4108 to 0.0824 with an average value of 0.2315. The post-failure moduli were used to characterise the rocks as Class I for negative sign modulus and Class II for positive sign modulus. How the postfailure moduli were estimated from the stress-strain curves has been described elsewhere [12]. The characteristic behaviour of Class I and Class II rocks and their response under axial loading condition has been described by Akinbinu [13].
Stress-axial, radial and total volumetric strain curves for the various brittle rocks up to strength failure were constructed according to Martin [3]; Bieniawski [14] to show the stages in the deformation process and were grouped into the different volumetric strain curves types. The quantities relating to the volumetric strain curve which include the maximum total volumetric strain Ɛcd and elastic volumetric strain were estimated to represent volumetric quantities of the failure-deformation process of the brittle rocks. In this study the slope of total volumetric strain and normalized axial stress curve is also evaluated to represent volumetric quantity of the deformation process. The slope of the curves were determined from the linear part of total volumetric strain and normalized axial stress curves such that a tangent is drawn parallel to the linear elastic deformation stage (i.e. from end of crack closure to the end of linear elastic deformation stage, Figure 1,3,5. It can be defined as the total volumetric strain per unit normalised stress.
The volumetric strain quantities were compared with each other in order to see if there exists a connection between them. The quantities were also compared for each type of the volumetric strain curves grouped as type one, type two and type three respectively. The type one has negative total volumetric strain and with a point of reversal at crack damage stress. The type two has positive total volumetric strain with a reversal point at crack damage stress while the type three has a positive total volumetric strain without a reversal point at the crack damage stress Figure 1,3,5 respectively. These deformation process types or the types of volumetric strain curves were also compared with shapes of the post-failure regime linked to the difficulty in obtaining it. The approach was to find out if the volumetric strain quantities are related to each other, whether the quantities are related to the types of volumetric curves and what effect the volumetric strain quantities have on the characteristic shapes of the post-failure curves [15-18].
Results and Discussion
The author use of crack damage stress (σcd) and maximum total volumetric strain (Ɛcd) in which σcd=Ɛcd to characterise volumetric strain curves from normalised pre-failure stress-strain curves has enables to divide the type one volumetric strain curve into two types. The first type has a negative total volumetric strain and with a point of reversal at crack damage stress. The second type has positive total volumetric strain with reversal point at crack-damaged stress. For rocks that exhibited the first type of deformation process, the volumetric strain curve is shown in Figure 1 while post-failure characteristic curves is shown in Figure 2 as an example for the type. The post-failure stress-strain curves for this type of rocks are relatively easy to perform. The type 2 volumetric strain curve is shown in Figure 3 and characteristic post-failure stress-strain curve is shown in Figure 4 as an example of for the second type. For the second type volumetric strain curve, the process of unstable crack propagation (stage IV) has a small duration. Thus, the rocks exhibited a higher velocity of micro cracks propagation. This made it difficult to control the post-failure curves than the type one volumetric strain curves because of the short duration of the crack damage stress threshold to rupture.
For the third type of volumetric strain curves, the crack induced stress and the structural failure of the rock specimen occurred together (Figure 5) with characteristic post-failure stress-strain curve shown in Figure 6. There was no reversal of the total volumetric strain so there was continued decrease in rock volume. The control feedback, the circumferential strain, does not continuously increase with the applied load after the peak load. Instead, the deformation became self-sustaining and as a result the micro-cracking of the material continued on its own accord [19,20].
Furthermore, unstable crack growth occurs at the on-set of the crack initiation stress for the third type volumetric strain curve. The critical energy release rate or crack damage stress threshold started much earlier for this type of curve than observed with others. Under this condition, the relationship between the applied stress and the crack length ceases to exist and other parameters, such as the crack growth velocity (as described in Eqn. 1), take control of the propagation process. These specimens exhibit high micro-cracking propagation velocity. The velocity increases rapidly to reach terminal velocity as unstable crack growth continued to the point where the many micro-cracks coalesce. Although the load was reduced, the fracture continues to propagate since the stored elastic strain energy release rate has attained the critical value. The cracks continued to extend because the elastic strain energy stored within the specimen is released. The elastic strain energy accumulated in the system during loading and avail-able for rupture development in the post-failure region was higher than the work that the specimen can do at the post-failure phase [21,22].
The difficulty in obtaining the post-failure curves in-creases as the total volumetric strain approaches a positive value. In other words, difficulty in obtaining the post-failure curves increases from the first type to the second type and finally the third type volumetric strain curves. For the first and second types, the four stages of deformation process are identifiable while only three stages of deformation process are identifiable with the third type (Figure 1,3,5). The first type deformation process contains the Class I while the second and third types show entirely Class II characteristic behaviour.
The volumetric strain quantities in Table 1 were compared with each other. The comparisons show that there exists a relationship among the volumetric strain quantities (Figure 7-9). The volumetric strain quantities are related with each other by power form law and can be expressed as and power form functions in which k and n can be termed as volumetric strain constants and exponents. The correlation coefficients of maximum total volumetric strain with slope of the normalised stress-total volumetric strain and with the elastic volumetric strain are significant, 0.89 and 0.92 respectively.
Table 1: Volumetric quantities

Figure 7: Maximum total volumetric strain and slope for combined sample.
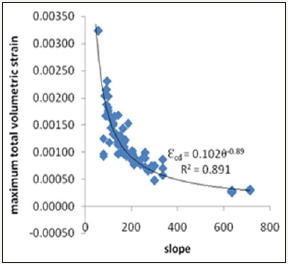
Figure 8: maximum total volumetric strain and elastic volumetric strain for combined sample.
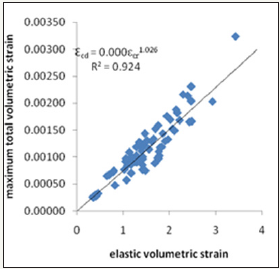
Figure 9: maximum total volumetric strain and elastic volumetric strain for combined sample.
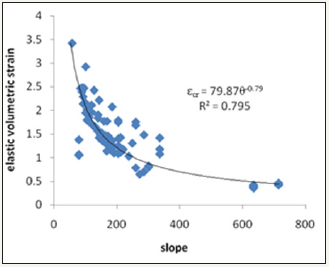
These strong correlation coefficients simply show that these quantities are connected with each other and therefore are mathematically related by power form law. Similarly the elastic volumetric strain correlated with the slope of normalised stress total volumetric strain curve with a coefficient of correlation of 0.79. The relationship of maximum total volumetric strain with the slope of the normalised stress-total volumetric strain curve can better be described as. This is to say that as the slope of the normalised stress-total volumetric strain curve increases, the maximum total volumetric strain decay (decrease) by power of 0.89 of the slope of normalised stress-total volumetric strain curve. The relationship of maximum total volumetric strain with elastic volumetric strain can be expressed by the power form law. So, as the elastic volumetric strain increases the maximum total volumetric strain increases by 1.026 power form of the elastic volumetric strain.
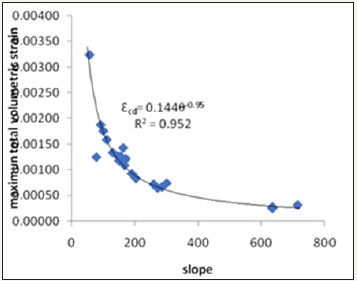
Also the volumetric strain quantities were coordinated such that the quantities were compared for each group of the different types of volumetric strain curves. The volumetric strain quantities show relationships with the different groups of the types of volumetric strain curves. The maximum total volumetric strain is related with the slope of normalised stress-total volumetric strain curve for each group of the different types of volumetric strain curves by power form function. The curvature of the concave curve get deeper and closer to the X-Y axis as the volumetric strain curves changes from type one to type two and type three respectively (Figure 10-12). The coefficient of correlation increases from type one to type two and type three volumetric strain curves, 0.749, 0.863 and 0.952 respectively (Figure 10-12). The relationship with the different types of volumetric strain curves are described as Ɛcd= 0.026θ- 0.62, Ɛcd= 0.090 θ-0.87 and Ɛcd= 0.144 θ-0.95 for type one to type two and type three respectively. The constants or coefficient of the equations can be termed as the ‘coefficient of volumetric strain stiffness moduli. The ratios of the ‘coefficient of the volumetric strain stiffness modulus’ for type one to type two and type three volumetric strain curves are 1:3.5:5.5 respectively. This ‘coefficient of volumetric strain stiffness modulus’ increases from type one to type two and type three of volumetric strain curves respectively.
Figure 10: Maximum total volumetric strain and slope for type 1 volumetric strain curve.
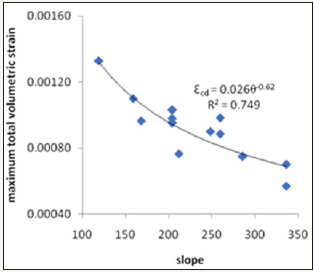
Figure 11: Maximum total volumetric strain and slope for type 2 volumetric strain curves.
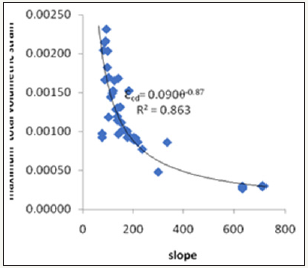
Figure 12: Maximum total volumetric strain and slope for type 3 volumetric strain curves.
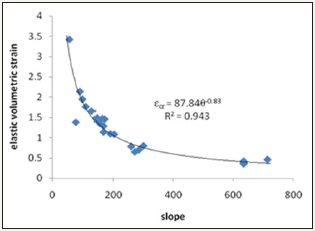
Similarly, the elastic volumetric strain is related with the slope of normalised stress total volumetric strain curve by power form function. The curvature of the concave curve get deeper and closer to the X-Y axis as the volumetric strain curves changes from type one to type two and type three respectively. The coefficient of correlation increases from type one to type two and type three volumetric strain curves, 0.581, 0.811and 0.943 respectively.
The relationship of the volumetric strain quantities with the different types of volumetric strain curves are described as Ɛcr=19.38 θ -0.46, Ɛcr=78.13 θ -0.78 and Ɛcr=87.84 θ -0.83 respectively. Also the ratios of the ‘coefficient of the volumetric strain stiffness modulus’ for type one to type two and type three volumetric strain curves are 1:4.0:4.5 for type one: type two: type three volumetric strain curves respectively. The ratios increase from type one to type two and type three volumetric strain curves respectively (Figure 13-15).
Figure 13: Elastic volumetric strain and slope for type 1 volumetric strain curve.
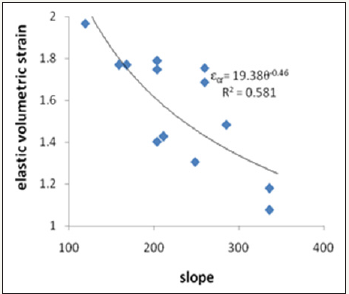
Figure 14: Elastic volumetric strain and slope for type 2 volumetric strain curves.
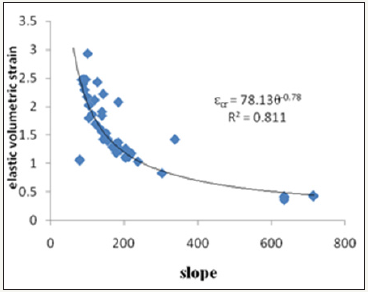
Figure 15: Elastic volumetric strain and slope for type 3 volumetric strain curves.
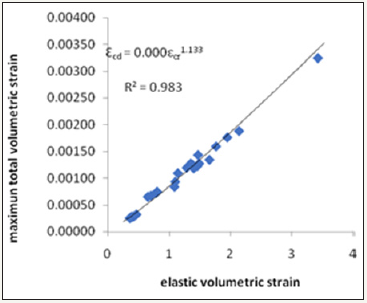
In addition, the elastic volumetric strain is related with the maximum total volumetric strain for type one to type two and type three volumetric strain curves by power form function. The elastic volumetric strain is related with the maximum total volumetric strains linearly but power form law show slightly higher correlation. The coefficient of correlations in-creases from type one to type two and type three of volumetric strain curves, 0.764, 0.966 and 0.983 respectively. The relationship with the different types of volumetric strain curves are described as Ɛcd=Ɛcr 1.031; Ɛcd=Ɛcr 1.054 and Ɛcd=Ɛcr 1.054 respectively (Figure 16-18).
Figure 16: Maximum total volumetric strain and elastic volumetric strain for type 1 volumetric strain curve.
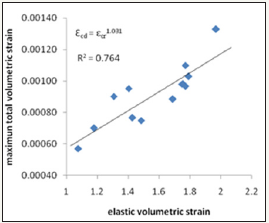
Figure 17: Maximum total volumetric strain and elastic volumetric strain for type 2 volumetric strain curves.
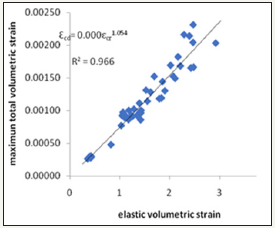
Figure 18: Maximum total volumetric strain and elastic volumetric strain for type 3 volumetric strain curves.
Conclusion
This research work has demonstrated that volumetric strain quantities are related with each other and also separately related with the types of the volumetric strain curves grouped as type one, type two and type three by power form functions. In all cases the coefficient of correlation between the volumetric strain quantities and types of volumetric strain curves in-creases from type one to type two and type three volumetric strain curves respectively. The type one volumetric strain curve are Class I rocks while type two and type three contained Class II rocks types. The type one is ductile or less brittle while the type two and type three are brittle and very brittle respectively under axial loading condition. The difficulty in obtaining the post-failure curves increases as the total volumetric strain approaches a positive value. In other words, difficulty in obtaining the post-failure curves increases from the first type to the second type and finally the third type.
References
- Bieniawski ZT (1967b) Mechanism of brittle fracture of rock: Part II-- experimental studies. Int J Rock Mech Mini Sci Geome 4(4): 407-423.
- Wawersik WR, Fairhurst C (1970) A study of brittle rock fracture in laboratory compression experiments. Int J Roc Mech Min Sci Geome 7(5): 561-564.
- Martin CD, Chandler NA (1994) The progressive fracture of lac du bonnet Granite. Int J Roc Mech Min Sci Geome 31(6): 643-659.
- Brace WF, Paulding BW, Scholz C (1966) Dilatancy in the fracture of crystalline rocks. J Geophysics Res 71(16): 3939-3953.
- Bieniawski ZT (1967) Stability concept of brittle fracture propagation in rock. Eng Geol 2(3): 149-162.
- Kim JS, Lee KS, Cho WJ, Choi HJ, Cho GC (2015) A comparative evaluation of stress strain and acoustic emission methods for quantitative damage assessments of brittle. Rock Mech Rock Eng 48(2): 495-508.
- Palchik V, Hatzor YH (2002) Crack damage stress as a composite function of porosity and elastic matrix stiffness in dolomites and limestones. Eng Geol 63(3-4): 233-245.
- Cai M, Kaiser PK, Tasaka Y, Maejima T, Morioka H, et al. (2004) Generalized crack initiation and crack damage stress thresholds of brittle rock masses near underground excavations. Int J Rock Mech Min Sci 41(5): 833-847.
- Katz O, Reches Z (2004) Micro-fracturing damage and failure of brittle granites. J Geophys Res 109: (B1).
- Palchik V (2010) Mechanical behaviour of carbonate rocks at crack damage stress equal to uniaxial compressive strength. Rock Mech Rock Eng 43(4): 497-503.
- Stefanov YP, Chertov MA, Aidagulov GR, Myasnikov AV (2011) Dynamics of inelastic de-formation of porous rocks and formation of localized compaction zones studied by numerical modelling. J Mech Phys Solids 59(11): 2323-2340.
- Akinbinu VA (2017) Relationship of brittleness and fragmentation in brittle compression Engineering Geology 221: 82-90.
- Akinbinu VA (2016) Class I and Class II rocks: implication of selfsustaining fracturing in brittle compression. Geotech Geol Eng 34 (3): 877-887.
- Bieniawski ZT (1967a) Mechanism of brittle fracture of rock: Part I-theory of the fracture process. International Journal of Rock Mech Min Sci Geome 4(4): 395-404.
- Craggs JW (1960) On the propagation of a crack in an elastic-brittle material. Journal of the Mechanics and Physics of Solids 8(1): 66-75.
- Eberhardt E, Stead D, Szczepanik Z (1998) Crack initiation and propagation in Granite and granodiorite from the 130 m and 420 m levels of the URL. (Report No. AECL 122567). Atomic Energy of Canada Limited, Manitoba, Canada.
- Hidalgo KP, Nordlund E (2013) Comparison between stress and strain quantities of the failure deformation process of Fennoscandian hard rock using geological information. Rock Mech Rock Eng 46: 41-51.
- International Society for Rock Mechanics Commission on Testing Methods. 2007. ISRM suggested methods for rock characterization, testing and monitoring. In R Ulusay & JA Hudson (Eds.), Draft ISRM suggested method for the complete stress-strain curve for intact rock in uniaxial compression. Pergamum Press Ltd. published for Commission on Testing Methods, International Society for Rock Mechanics, Ankara, Turkey.
- Kemeny J, Cook NGW (1986) Effective moduli, non-linear deformation and strength of a cracked elastic solid. Int J Rock Mech Min Sci Geome 23: 107-118.
- Lau JSO, Chandler NA (2004) Innovative laboratory testing. Int J Rock Mech Min Sci 41(8): 1427-1445.
- Martin CD (1993) The strength of massive lac du bonnet Granite around underground openings. University of Manitoba, Winnipeg, Canada.
- Qiaoxing L (2006) Strength degradation and damage micro-mechanism of granite under long-term loading. University of Hong Kong, Hong kong.
© 2018 EL Bar D. This is an open access article distributed under the terms of the Creative Commons Attribution License , which permits unrestricted use, distribution, and build upon your work non-commercially.
 a Creative Commons Attribution 4.0 International License. Based on a work at www.crimsonpublishers.com.
Best viewed in


.jpg)


 Editorial Board Registrations
 Submit your Article
 Refer a Friend
 Advertise With Us
.jpg)


.jpg)


.bmp)
.jpg)
.png)
.jpg)


.png)

.png)


.png)


