- Submissions

Full Text
Trends in Telemedicine & E-health
A Remote ECG System to Help Medical Tele-Consultations and Long-Term Patient Monitoring
Diana Guimaraes*
FEUP-Universidade do Porto, Portugal
*Corresponding author: Diana Guimaraes, FEUP-Universidade do Porto, Porto, Portugal
Submission: January 03, 2022; Published: January 28, 2022

ISSN: 2689-2707 Volume 3 Issue 2
Abstract
Patients with heart problems who are prescribed the use of an Holter monitor for long duration examination had increased difficulties during the SARS-CoV-2 (COVID-19) pandemic and where faced with the antagonistic decision of going to the hospital to get the exam as needed or avoiding contacts, as any person in a risk group should do. This work presents a proposal for remote health monitoring of patients that need access to a Holter monitor, but simultaneously need to reduce contacts and traveling between sites. This includes two main blocks: the system infrastructure architecture that allows data to be exchanged and visualized through the WiFi network and the Electrocardiogram (ECG) signal acquisition module. The system as a whole achieves its main goal of helping patients proceed with the prescribed ECG long-term monitoring examination while reducing the number of commutes, which is very important during the pandemic, as these patients belong to the higher risk group. Also, it gives doctors a tool that provides extra information for a better tele-consultation.
Keywords: E-Health; Heart failure; IoT; Remote sensing
Abbreviations: ECG: Electrocardiogram; M2M: Machine-To-Machine; IT: Information Technology; OCF: Open Connectivity Foundation; TIA: Telecommunication Industry Association; ETSI: European Telecommunications Standards Institute
Introduction
During the recent SARS-CoV-2 (COVID-19) pandemic, for a long period, non-urgent office visits were unadvised and as far as possible, replaced by tele-consultations. Suddenly facing this new reality, the medical community had to adjust their methods to reach a diagnostic without being able to check the patient vital signals or other measurable metrics. This is particularly concerning for ambulatory patients, who are recovering at home from surgery, from temporary disease or someone living with a chronic disease such as heart failure. Considering the scenario of a patient that has atrial fibrillation, which is characterized by sporadic irregular beats. It can be the case that it not yet fully identified, or it is already identified, but is in the process of medication dosage periodic re-assessment. Even without the COVID lock-down, the condition is hard to be identified or re-assess with precision in the duration of an isolated medical examination or a resting ECG, unless the patient is in distress at the time of the appointment, due to its sporadicity. The conventional mechanism for evaluating it, is to prescribe a dynamic ECG test, whose duration can be one or more days, depending on the severity of the beating irregularity. For this test, the patient takes home a Holter monitor, that registers the heart activity in its local memory. At the end of the prescribed days, the patient returns to the clinic to deliver the monitoring machine and the practitioner will later analyze it and report back to the patient. This results in four trips every time a person needs to undergo this examination; journeys that the patient cannot go to work (if the person is in working age) or journeys that the patient needs to get help to go to the clinic (if the person is too young/too old to drive or has a motion stint). One other aspect in the conventional Holter monitor is the lack of complementary data that allows the ECG to be analyzed under the correlation to the current activity level.
If we add a pandemic into this equation, the result is larger risk of miss-diagnostic due to lack of proper ex-amination, longer time without treating/re-assessing the condition due to not scheduling an appointment (for pandemic reasons or not) or increased risk of infection if avoidable in-person situations are not refrained. Tools that allow vital signal monitoring and sharing are capable to mitigate the distance, facilitate informed decisions and reduce the need for commutes. Sensing devices have been used in the latest years in other sectors, namely fitness, industry 4.0, smart cities or agriculture, but its potential should be transported to usecases similar to the one described, once that, even though each sector has unique requirements and challenges, they have shared characteristics and, for that reason, a common base-platform is appropriate. The remainder of this paper bring forward the technologies and related works before presenting the system infrastructure and the relevant characteristics and aspects of the acquisition of the Electrocardiogram (ECG) signal. Finally, the results and the conclusions are presented.
Technologies and Related Works
[1] estimated that 127 consumer devices get connected for the first time every second and, although projections from different source have some variability, they point to a total number of 17 to 30 billion IoT devices connected to the internet worldwide by 2025. Note that here IoT device refers to the two smart-home devices, connected industrial equipment or connected cars, excluding all smartphones, laptops or other human ’fully-operated’ connected devices. In fact, according to [2] 2020 was the first year where IoT devices were the majority of the connections (54%) when compared to human ’fully-operated’ devices. Having such large number of Machine-To-Machine data (M2M) created the need of security, reliability and efficiency, mainly because the sensing nodes are in many applications’ battery powered, the data might be need for further processing and decision-making and might also be sensitive or proprietary. This is the case of the medical sector were, an infrastructure capable of manage the data volumes and allow people with different levels of knowledge in the Information Technology (IT) domain to access and visualize the data.
There are several open-source middleware frameworks, M2M
frameworks and platforms. Some that worth mentioning are:
i. AllJoyn [3] and IoTivity [4] supported by Open
Connectivity Foundation (OCF)
ii. FIWARE [5] and open IoT [6] and funded by the European
Union and supported by an open community
iii. One M2M [7] is a standard created by a consortium that
includes the Telecommunication Industry Association (TIA)
and the European Telecommunications Standards Institute
(ETSI)
FIWARE and One M2M, in particular, are mature middle wares that support the publisher-subscriber paradigm and multiple IoT application protocols as HTTP, MQTT and CoAP. FIWARE is evaluated in [5,8], used for a smart-cities platform in [9] and to manage water distribution in [10]. The most established implementations of the one M2M standard are Open MTC [11] (initiated by Fraunhofer Fokus) and OM2M (developed by the Eclipse Foundation [12]) and they have been used in [13] to design a plant breeding system, in [13] to enable scalability in 5G networks and [14] implements a fog computing architecture based on it. As for the wearable device, these low-Power Wi-Fi devices, like the Onion Cloud, the Raspberry Zero W, or the Espressif ESP8266 and ESP32 are small, embedded devices that maximize connectivity and real-time capabilities, while keeping the battery consumption and size to the minimum. As for the storage and the visualization tools, third party open-source platforms were first explored. A time-series database was the most indicated to handle the high volumes of transaction and easy integration with the user interface and the remaining system was also very important. Some technologies considered suitable were Influx DB [15] or Prometheus [16], as database with Chronograf [17] or Grafana [18], as visualization interface, respectively. The Influx DB - Chronograf pair is part of a larger software stack called TICK as it aggregates the Telegraf, InfluxDB, Chronograf and Kapacitor components in a timestamped data-centered system. Prometheus was adopted by many companies and organizations, specially since 2016. It is stores data with the timestamp at which it was recorded, alongside optional key-value pairs called labels [16]. Regarding the sensing itself, in the last decade commercial wearable devices are increasingly popular for fit-ness purpose. Parak et al. [19] reports on a wrist-worn device to use while running, which estimates heart rate, energy expenditure and maximal oxygen outtake (VO2 max) using an optical heart rate sensor, [20] uses the same type of sensor together with an accelerometer and temperature sensor for tennis applications and [21] monitors the skin sweat.
The System
Overview
Introducing new devices in the health sector can be additionally challenging, since the patient’s safety and well-being is a constant concern. Replacing a well-established examination is hard, particularly for scenarios like the tele-consultations, where the data needs to be visualized and interpreted by a human with technical medical knowledge. The system here presented is composed by three entities: the ESP32 as wearable device that collects ECG data, the server machine to host the OM2M broker (which can be a computer connected to the internet in the hospital or clinic) and the end-station, where the medical specialist can visualize the data and monitor the progress in real-time. The Influx DB-Chronograf pair was selected for data storage and visualization. This architecture is scalable per design, allowing N to N connections. It can also be decentralized by introducing multiple brokers, which enforces reliability and security (Figure 1).
Figure 1:System overview.

The ECG data
Collecting ECG data (specially for comparison with an
established examination method) requires good sensing
capability, that is robust to noise, accurate and reliable. The
Electrocardiographic signal (ECG or EKG) results from the hearth
muscle activity. Heart muscles generate different voltages in the
order of hundreds of microvolts. These signals show very low
amplitudes and an important amount of electrical noise. An ECG
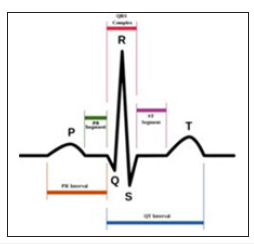
cycle is composed of three specific waves:
i. P wave
ii. QRS complex
iii. T wave
They reflect the atrial depolarization, ventricular depolarization and ventricular repolarization of the hearth, respectively. The electrocardiogram is useful in diagnosing cardiac arrhythmias, conduction abnormalities, myocardial infarction and other heart diseases. Electrically, it is a very small signal, whose maximum amplitude is around 5mV and 140Hz of frequency. Another important aspect to collect the signal with good quality is the placement of the leads in the body. An ECG exam can use from 3 up to 12-leads across the body placed according to the guidelines (Figure 2). One of the problems patients face during the one-day or, even more, during the one-week long Holter exam, is the fear of misplacing the electrodes after removing them to have shower. Previous studies [19] demonstrated high levels of concordance between a simple 3-lead ECG and the standard 12-lead ECG and it could be used to detect cardiac alterations, such as arrhythmias, atrioventricular blocks, and re-polarization abnormalities. Therefore, in this study only 3 leads were used. They were placed according to (Figure 3). The analog interface used to collect the measurements was an ADS1194 16-bit ADC with programmable gain and internal reference. It communicates with the ESP32 via SPI protocol. The ESP32 is responsible for all the necessary preprocessing of the samples before sending them via WiFi through the system to the broker, who then takes care of forwarding it to the database for storing or the monitoring station that declared the interest of receiving it [22-24].
Figure 2:Heart beat representation.

Figure 3:Heart beat representation.

Result
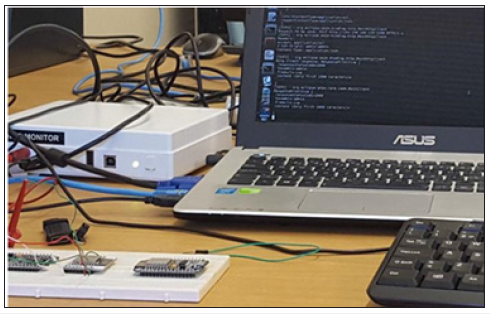
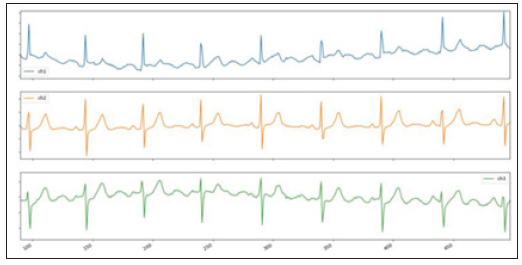
This report presents two different blocks: the system infrastructure that allows data to be exchanged and visualized through the WiFi network and the ECG collection wearable node based on 3-lead. To make sure both blocks where not influencing one another, they were first tested separately. In (Figure 4) is shown the ESP32 sending random data and the data reaching the laptop that subscribed it. Then, other subscriber is using the Chronogram interface to visualize an average of this data that was store in influx DB. Finally, the collection of the ECG signal from a patient is presented in (Figures 5 & 6). Here, the labels ’ch1’, ’ch2’ and ’ch3’ correspond to leads I, II and III. One can see that the general shape, particularly in the orange channel, match the expectations. Nevertheless, some artifacts might be affecting the signal. Further processing could be done, but more intervention and feedback from a medical expert is necessary.
Figure 4:The system infrastructure exchanging data.

Figure 5:Data visualization.

Figure 6:The collected heart beat signal.

Conclusion
This paper presents two different blocks: the system infrastructure that allows data to be exchanged and visualized through the WiFi network and the ECG collection wearable node. The system architecture is reliable and scalable. The ECG signals collected resembles the expected signal, although some artifacts might be affecting some channels. Further processing could be done, but more feedback and advice from a medical expert would be necessary. The system as a whole achieves its main goal of helping patients proceed with the prescribed ECG long-term monitoring examination while reducing the number of commutes, which is very important during the pandemic, as these patients belong to the higher risk group. Also, it gives doctors a tool that provides extra information for a better tele-consultation.
References
- Fredrik D, Mark P, Alexander R, Jonathan S (2021) Growing opportunities in the Internet of Things. McKinsey & Company, USA.
- (2020) State of the IoT 2020: 12 billion IoT connections, surpassing non-IoT for the first time. IoT Analytics.
- Alljoyn (2021) Open Connectivity Foundation, US.
- (2021) IoTivity.
- Cirillo F, Solmaz G, Berz EL, Bauer M, Cheng B, et al. (2019) A standard-based open source Iot platform: FIWARE. IEEE Internet of Things Magazine 2(3): 12-18.
- (2021) Fiware: The open source platform for our smart digital future. FIWARE.
- Open source cloud solution for the internet of things. Open IoT.
- Salhofer P, Joanneum FH (2018) Evaluating the FIWARE platform: A case-study on implementing smart application with fiware. Proceedings of the Annual Hawaii International Conference on System Sciences, pp. 5797-5805.
- Araujo V, Karan M, Saguna S, Åhlund C (2019) Performance evaluation of FIWARE: A cloud-based IoT platform for smart cities. Journal of Parallel and Distributed Computing, pp. 250-261.
- Panagiotakopoulos T, Vlachos DP, Bakalakos TV, Kanavos A, Kameas A (2021) A FIWARE-based IoT frame-work for smart water distribution management. 12th International Conference on Information, Intel-ligence, Systems & Applications (IISA), pp. 1-6.
- (2021) Standards for M2M and the internet of things (2021). One M2M.
- (2021) Eclipse Foundation. OM2M.
- Liu Z, Bu F, Yin X, Wang X, Zhang Z (2021) Design of plant breeding system based on one M2M standard. Journal of Physics: Conference Series 1873(1): 1-7.
- Simone P (2021) Study and analysis of security features for internet of things devices in a ONE M2M-based architecture. Free University of Brussels, Belgium.
- InfluxDB 1.x (2021) Influx Data.
- Prometheus (2021)The Linux Foundation.
- Chronograf (2021) Influx Data.
- Grafana (2021) Grafana Labs.
- Li ZH, Boulanger P (2020) A survey of heart anomaly detection using ambulatory electrocardiogram (ECG). Sensors 20(5): 1461.
- Zyrianoff I, Heideker A, Sciullo L, Kamienski C, Felice M (2021) Interoperability in open IoT plat-forms: WoT-FIWARE comparison and integration. 2021 IEEE International Conference on Smart Computing (SMARTCOMP), pp. 169-174.
- (2021) Open MTC.
- Jakub P, Uuskoski M, Machek J, Korhonen I (2017) Estimating heart rate, energy expenditure, and physical performance with a wrist photoplethysmographic device during running. JMIR Mhealth Uhealth 5(7): e97.
- Marko K, Iztok K (2017) A wearable device and system for movement and biometric data acquisition for sports applications. IEEE Access 5: 6411-6420.
- Keigo E, Ryosuke S, Hiroyuki K (2018) Real-time skin lactic acid monitoring system for assessment of training intensity. Electronics and Communications in Japan 101(5): 41-46.
© 2022 Diana Guimaraes. This is an open access article distributed under the terms of the Creative Commons Attribution License , which permits unrestricted use, distribution, and build upon your work non-commercially.
 a Creative Commons Attribution 4.0 International License. Based on a work at www.crimsonpublishers.com.
Best viewed in


.jpg)


 Editorial Board Registrations
 Submit your Article
 Refer a Friend
 Advertise With Us
.jpg)


.jpg)


.bmp)
.jpg)
.png)
.jpg)


.jpg)


.png)

.png)


.png)


