- Submissions

Full Text
Trends in Telemedicine & E-health
Kinetics of Development of Covid19 and its Prediction Possibilities in the Case of a Small Statistical Set-The Case of Latvia
Andris Actiņš1, Aldis Z1 and Lilian T1,2*
1Univeristy of Latvia, Jelgavas str. 3, LV-1004, Riga, Latvia
2Holon Institute of Technologies, Golomb St 52, Holon, 5810201, Israela
*Corresponding author: Lilian Tzivian, Associated Professor, PhD, epidemiologist, Faculty of Medicine, University of Latvia, Jelgavas str. 3, Riga, LV 1004, Latvia
Submission: November 13, 2020; Published: April 20, 2021

ISSN: 2689-2707 Volume 2 Issue 4
Abstract
Introduction: Models of kinetics of development of COVID-19 are essential for prognosis and preparedness of medical facilities for treating of patients.
Methods: We built a predictive model based on theoretical formulas for normal distribution and corrected it based on real number of cases in Latvia. The process included two stages: (I) simple modelling for distribution of cases without accounting for a state of emergency; (II) correction of the model for changes due to a state of emergency and a real situation. A choice of model parameters was performed comparing the real and the theoretical cumulative curves and based on the least sum of square. Considering in addition the tiredness of people to follow a state of emergency rules, we modelled the cumulative number of cases in Latvia till the end of 2020.
Result: The number of diseased cases in Latvia have Poisson distribution. According to our model, the best prediction is based on 7-14 days in which a carrier transmits the disease (p). After the declaration of a state of emergency the infection coefficient k decreased 3 to 5 times with fastest changes in incidence at day 50. The deviation from the theoretical curve as a result of violation of a state of emergency rules occurs at day 80. The cumulative number of cases in Latvia till the end of 2020 can reach 1400 in the case the current conditions will stay.
Conclusion: The provided model can be applied for other countries with similar distributions of cases.
Keywords: COVID-19; Low-incidence country; Latvia; Developmental kinetics
Introduction
The pandemic of COVID-19 that the world faced with at the beginning of 2020, made several
challenges in scientific societies and research targets. Apart from problems with new tests for
detection of the virus and development of vaccines and new treatments, scientist all over the
world try to model the kinetics of development of the disease in different countries [1]. One
of the purposes of such modelling is to prognose and prepare medical facilities for treating
of patients with severe disease. This modelling requires many factors to be considered, such
as population density, age distribution within the country, mostly prevalent comorbidities for
specific population, as well as political factors to reduce a spread of the virus. In the absence
of vaccine, the only method that was found to be effective for reduction of spread of the virus
and for decrease the load on the medical system, is a state of emergency. Almost all countries
declared a state of emergency [2], but the time of its establishment differs between countries
[3]. Countries declared a state of emergency relatively late faced with the crash of medical
system and with necessity to decide the ones that “deserve to live” on account of some others
that will be sacrificed because of lack of medical resources [4,5]. On the other hand, countries
that declared a state of emergency at the first day of pandemic are seen to reduce the number
of cases significantly thus facilitating a work of medical institutions [6]. The forehanded
preparation of medical system for the worse situation can save lives, and this can be achieved
by collecting a sufficient knowledge on factors related to spread of the disease. In the absence
of previous data, this knowledge can be based only on theoretical modelling that probably
have low accuracy but still remain the only possible kind of prognostic preparation for future.
The correctness of models is especially essential in the case of countries where the medical
system is not extremely strong, like countries of the West Europe. In addition, in some cases models that were developed for countries with large population not
always fit for the countries with relatively small population.
One of the West European countries with small population is
Latvia with almost 2mln. of inhabitants and about 20% of elderly
[7]. According to World meter data [8], population density in Latvia
is 31 people per km2 calculated for the total land area of 62,200 km,
however, most of them (68.4%) of them are living in urban areas
with the majority (634,000 people) living in the capital city Riga [8].
Starting from a beginning of the pandemic and till 02.06.2020, the
total number of cases in Latvia had reached 1079 of them 760 were
recovered during this period. The first two cases were identified
at 08.03.2020. The maximal number of cases per day in Latvia
had reached 48 [9]. Most of the cases (n=556) were discovered in
Riga, the capital of Latvia which is also the place with the highest
population density. At this period, 112,965 tests were performed
which is a relatively high number of tests per million of population
(59,845 per million) [10]. The state performs most of the tests in
social care institutions and shelters, therefore, most of COVID-19
cases were found there. In addition, at 12.03.2020, a state of
emergency had been declared in Latvia [11]. This led to substantial
decrease in number of cases which should be considered whilst
modelling. The effectivity of the state of emergency reached its peak
at 23.03, and after that day the government-declared activities had
been seen to affect the number of new cases in the state. According
to official statistics, the total number of deaths from COVID-19 stays
on 24 till the 02.06.2020 [9]. The maximal daily number of deaths
was four people at 21 of April. The age groups official statistics was
provided by the Latvian Centre of Disease Prevention and Control
till the 21.04.2020 for the first nine persons, and most of them were
at the 70-75 age group [10].
In Latvia, the health expenditures are about lowest in Europe
and stay at 5.8% of GDP, the physician density is 3.19/1000 of
population and hospital bed density is 5.8 beds/1000 of population
[12]. All this takes Latvia to relatively weak position in its medical
supply and readiness for challenges like COVID-19. Therefore,
statistical prediction of possible situation with the pandemic is
extremely important in the case of Latvia. The surprisingly low
incidence of COVID-19 and small overall number of diseased cases
in Latvia make the statistical modelling for prognostic purposes
extremely difficult. In most of countries, modelling assumed high
number of diseased and therefore is based on normal distribution,
however, normal distribution of cases is rather an assumption
than a reality [13]. In Latvia, this approach seems to be completely
irrelevant, as distribution of cases is rather Poisson than normal.
Definition of parameters that should be included into a model
in a case of small numbers of diseased, as well as fitting the best
prognostic models and making a prognosis till the end of 2020 for
Latvia was the main aim of this study.
Methods
We attempt to build a predictive kinetic model of COVID-19
in Latvia that will describe the situation till the end of 2020. To
build the model, we used the publicly available data of diseases that was published at the site of the Centre of Disease Prevention
and Control of Latvia. The overall number of cases in Latvia from
the beginning of the pandemic (12.03.2020) at and till the date of
analysis (07.05.2020) was 909, and total number of deaths in this
period was 18 [9]. Number of cases in Latvia had a Poisson-like
distribution (Figure 1).
We performed our modelling at two stages:
1. Simple modelling for distribution of cases without
accounting for a state of emergency.
2. Correction of the model for changes due to a state of
emergency and a real situation.
Simple modelling without accounting for a state of emergency
In the simplest case of continuous distribution, the model can be described as (1):

N-number of cumulative cases, t-time (in days), m-number of susceptible individuals at the beginning of the period, k-the infection coefficient which means the number of susceptible people that could be infected by one carrier during a defined period of time. In the case than the given period of time is one day and assuming a number of cases as a discreate measure, the number of cases at day t -1 can be calculated according to next formula (2):
 (2), where
p-number of days in which a carrier transmits the disease, and which cause the (t-1) day’s prevalence.
In this case, the cumulative number of cases will be calculated according to (3)
Nt = Nt−1 + ΔNt−1 (3), where
For each day there is additional parameter N0 which means the number of persons with disease that are necessary for implementation of the model. This model attempt to predict the number of diseased in the case of pandemic till the end of potentially susceptible persons (m). We used the real data of Latvia to model the number of cases from the day 24 (24.02), as the number of cases before this day was too small to make any modelling. We started our prediction from the day 50 of pandemic and used the cumulative number of cases and number of cases per day form publicly available data sets. To check the stability of the model, we changed its parameters and ran the model using theoretical coefficients for each parameter in the model.
Correction of the model for changes due to a state of emergency and a real situation
The next model considered a state of emergency that was declared at the first day after announcement on pandemic by WHO. The effectiveness of a state of emergency depends on vast number of factors that can be described using the central limit theorem (4):
 (4), where
I-final reduction of k as a result of a state of emergency
t0-a day of the fastest changes in k
σ-standard deviation for normal distribution.
Assuming K =k*m and J = I*m and Σt−10N<m the formula (4) can be shortened obtaining the formula (5):
 (4), where
The theoretical parameter k can be calculated according to next formula (6):
ktheror = k − I . int G(t | t0 ,σ ) (6), where
which can be corrected using previous assumption made for (5) thus receiving next shortened calculation of k (7):
ktheror = (K − J int G(t | t0 ,σ )) (7), where
However, the factual coefficient k (experimental one) should change according to the proportion (8):
 (8) , where
and this factual infection coefficient K should be compared with the theoretical one k theory, which is the main parameter that should be considered whilst building a model. A choice of m, k, I, t0 and σ parameters was performed comparing the real and the theoretical cumulative curves and based on the least sum of square S (9):
 (9) , where
We checked the m, k, I, t0 and σ parameters according to the minimal S, and compared our theoretical models with the real data for Latvia looking on different number of days p. We checked the stability of data for days 80-104 using p=4, p=7 and p=14. This numbers had been chosen based on pre-symptomatic transmission of COVID-19 which is 4.0 to 4.6 days, and its theoretical possibility up to 14 days (14). In this way we assessed the possibility to use our model for prognostic purposes. Observing differences between the predicted cumulative number of cases and the real one, we optimized our model to achieve a factual number of cases at each particular day. We built the model with p=7 and p=14, and investigated its fit till the days 70, 80, 90, 100 and 105. We corrected the model according to observed difference in cumulative curve entering the parameter that described the tiredness of people from the emergency state. Performed correction can be described by the formula [10] which is the last outcome of this investigation:
 (10) , where
L- final increase of k as a result of a braking of a state of emergency rules.
We checked this formula comparing our model with a real number of cases at 25.05.2020. After that, using this corrected formula, we built the prognostic models for a situation in Latvia at 01.10.2020 and calculated the cumulative number of cases till 31.10.2020.
Result
Simple modelling without accounting for a state of emergency
The real data from the Latvian data set that we used for our model was for day 24 (24.02), and the coefficients were as followed: k=1.50*10-6 day-1, m=220,000 individuals, and N0=0.123, where N0 means the number of persons with disease that are not susceptible anymore at the day 24 (Figure 1). In the case of real data, the peak of disease should be reached till the day 75 with 15,000 of cases, and the maximal cumulative number of cases will be at day 82 when all potential susceptible population got the disease. Changing parameters of the model, we observed subsequent changes in dynamics, but the character of the model did not change. However, in these cases the model is not stable (Figure 2).
Figure 1: Incidence of COVID-19 in Latvia from the day 20 to day 120 of pandemic.

Figure 2: Changing parameters of the model (k and m) for the
same N0
Panel A: Theoretically assessed number of cases in each
particular day.
Panel B: Theoretically assessed cumulative number of cases
(N0=0,123).

Correction of the model for changes due to a state of emergency
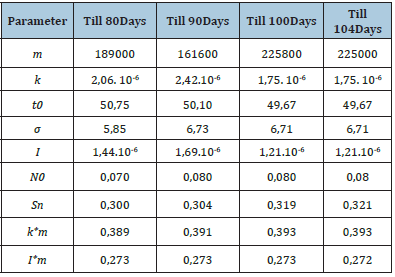
According to this first check, we chose p=7 and p=14 as those more stable for the next investigations. Whilst minimizing S, we additionally observed the instability of constants m, k, and I¸ however, a result of multiplication of two factors k*m and I*m remain stable (Table 1). This observation confirmed the correctness of models [5] and [7].
Table 1:Constants observed for models trying to minimalize parameter S.

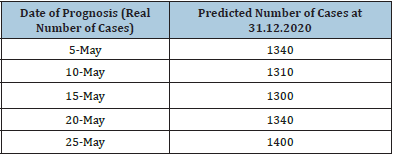
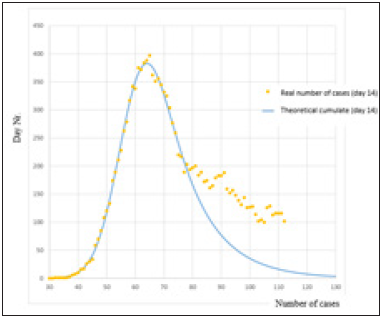
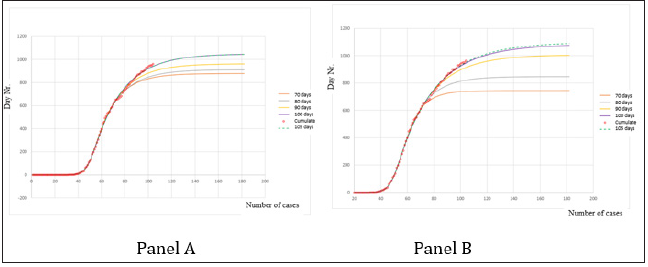
Comparing theoretical and real infection coefficients for seven and for fourteen days (p=7 and p=14) of possible transmission of disease, we observed that after the declaration of a state of emergency the infection coefficient k decreased 3 to 5 times with fastest changes in the coefficient t0 at day 50 (Figure 3). Comparing the modelled distribution of COVID-19 with the real number of cases in Latvia we observed a good model fit (p=14) till the days 75-80, but after that all real results were above the theoretically predicted ones. This can be explained by public tiredness from a state of emergency and violation of its rules. This remains stable for p=5 to p=10 independently of the day of prognosis (data not shown): independently from the day that we modelled, the real number of cases was always higher than the predicted one (Figure 4). Performing a future optimization of the model according to cumulative cases in reality we observed that increasing the number of days for prognosis displayed better fit for the real situation (Figure 5). We observed the good fit of the models built using the formula [10] with the real situation in Latvia till the day 115 (25.05.2020) of the pandemic (Figure 6). We calculated a cumulative number of cases in Latvia using this corrected model at 31.12.2020 (Table 2). This table shows that the prognostic number of cases performed using the corrected formula [10] is less dependent on the specific day on which the prognosis was based. Differences that are observed than model is based on May 20 and May 25 can be explained by the spontaneous increase of infected diseased persons discovered on May 16 (27 new cases).
Table 2:Prognostic calculation of cumulative number of cases in Latvia till the end of 2020.

Figure 3:Changes in the infection coefficients after a state of emergency was declared.
Panel A: Comparison of constants (theoretical and factual) for day 7 (p=7).
Panel B: Comparison of constants (theoretical and factual) for day 14 (p=14).

Figure 4: Optimization of curves till the day 75 (p=14) for the theoretical calculation and the real situation in Latvia.

Figure 5: Comparison of theoretical models with the real situation in Latvia for days 70-105.
Panel A: Cumulative curve (p=7).
Panel B: Cumulative curve (p = 14).

Figure 6: Best fitting model till the day 115 (p=14).
Panel A: Number of cases in each particular day.
Panel B: Cumulative number of cases.

Discussion
In this study we built the prognostic model till the end of 2020 for a cumulative number of cases with COVID-19 for the case of Latvia a country with the low population density and low number of diseased [11-16]. At this stage, there is a lack of possibility to perform data based epidemiological studies due to the limited time from the beginning of the pandemic. There is a lack of studies on difference in virulence of SARS-COV-2 between populations and environments. Considering the overall character of pandemics and a difference of viral distribution by countries, such studies are greatly anticipated. Up to date there is no valid explanation of differences of spread of the virus in different countries. Some explanation can come from the population density [15], and another one can be the difference of behavioral habits of populations [16]. This would mean that populations with higher concentration of people in cities, with close relationships between neighbors, stronger familial relationships, and culturally prescribed “out-of-home” dinners have a higher possibility of fast increase in number of cases of COVID-19. On the other hand, states with lower population density, having mostly individualistic approach and more distanced relationships will be in better situation. Unfortunately, this theory not always confirms in real life. For example, a similar number of cases in Norway and Malaysia are completely out of this theory [13]. The difference in number of cases can be based on differential virulence of SARS-COV-2 as a result of variability of SARS-COV-2 strains [17], however, this theory had not been proven, yet. The crash of medical system is one of the greatest problems of this pandemic in all countries. It is known that hospitalisation occurred in 32% of cases, and severe disease that requires a hospitalization in an intensive care unit and/or respiratory support is accounted for 2.4% cases [18]. In the case of lack of proper information and lack of knowledge about causes and consequences of difference in the course of disease in different populations, the only solution to prognose a possible overload of health system is a theorization using statistical models [19]. However, a possibility of low prognostic probability of such a model should be considered. Even real data-based epidemiological models have a relatively low prognostic possibility (for example, for some regression models adjusted R2 can vary from 20 to 50%) [20]. Certainly, in the case of the theoretical model this prognostic possibility might be even lower. However, the prognosis in this case is made looking on the worse case of maximal distribution of disease. Therefore, it can be concluded that the real situation will always be better than the prognosed one which can be a good solution in this particular case. If the medical system of a country would be ready for a higher number of diseased, the crash of it could be avoided. The additional problem that was discovered during the state of emergency that was declared in most of the world population is tiredness of people from strict rules of lockdown and self-isolation. This tiredness lead to psychological distress and even to development of depressive symptoms [21,22]. In situation of hard restriction of everyday activities people start to break the governmental prescriptions which can lead to additional increase of cases of COVID positive persons. In the worst case that can lead to the so-called “second wave” - second peak of cases after the reduction of the first one. In traditional models based on normal distribution there is no possibility to account for such psychological situation the thing we tried to achieve in this study.
Limitations of the study
This study has several limitations. One of the limitations of this study is low prognostic possibility of presented models discussed above. In addition, there is no possibility to predict not known exacerbations of COVID-19 due to the lack of proper information about the course of disease. The last limitation of this study is the prognosis of diseased cases only; no recurred persons were accounted in the model. This limitation is a result of our willingness to build the universal model for low-cased countries. As each one of the countries has its own medical system based on quite different financial possibilities, it is rather impossible to prognose the recovered cases for all these situations. The last limitation is a lack of personal information that can affect the modelled number of cases, for example, mentality of people in different countries and their behavioral habits.
Strengths of the study
The main strength of this study is that to our knowledge we built the first model for countries with a small number of real cases. In addition, we the strength of our model is its correction for psychological changes in society as a result of the stage of emergency.
Conclusion
We built the prognostic model till the end of 2020 for a cumulative number of cases with COVID-19 for the case of Latvia-a country with the low population density and low number of diseased. We succeeded to improve the theoretical model correcting it for the real situation in the country and considering
I. The consequences of a state of emergency, and
II. A tiredness of people from the strict state of emergency
rules.
This model can be applied for other countries with similar
conditions, and with some additional corrections even on countries
with higher number of cases.
References
- https://coronavirus.jhu.edu/data/new-cases
- https://www.who.int/emergencies/crises/en/
- https://en.as.com/en/2020/04/08/other_sports/1586370252_184109.html
- Medeiros FA, Daponte CA, Moreira MFDC, Saez M, Cabrera LA (2020) Impact of lockdown on COVID-19 incidence and mortality in China: an interrupted time series study. Bull World Health Organ, Geneva, Switzerland.
- https://www.nytimes.com/2020/05/20/us/coronavirus-distancing-deaths.html
- López L, Rodó X (2020) The end of social confinement and COVID-19 re-emergence risk. Nat Hum Behav 4: 746-755.
- https://www.indexmundi.com/latvia/demographics_profile.html
- https://www.worldometers.info/demographics/latvia-demographics/
- https://www.worldometers.info/coronavirus/country/latvia/
- https://spkc.gov.lv/lv/tavai-veselibai/aktualitate-par-jauno-koronavi
- https://likumi.lv/ta/id/313191
- https://www.indexmundi.com/latvia/demographics_profile.html
- https://www.worldometers.info/coronavirus/
- https://www.ecdc.europa.eu/en/covid-19/latest-evidence/transmission
- Desai DD (2020) Urban densities and the Covid-19 pandemic: Upending the sustainability myth of global megacities. ORF Occasional Paper, Observer Research Foundation.
- Hamidi S, Sabouri S, Ewing R (2020) Does density aggravate the COVID-19 pandemic? Journal of the American Planning Association 86(4): 1-16.
- Wang C, Liu Z, Chen Z, Huang X, Xu M, et al. (2020) The establishment of reference sequence for SARS-CoV-2 and variation analysis. J Med Virol 92(6): 667-674.
- (2020) Severe outcomes among patients with Coronavirus disease 2019 (COVID-19). MMWR Morb Mortal Wkly Rep, USA, 69: 343-346.
- Li R, Rivers C, Tan Q, Murray MB, Toner E, et al. (2020) Estimated demand for us hospital inpatient and intensive care unit beds for patients with covid-19 based on comparisons with Wuhan and Guangzhou, China. JAMA Netw Open 3(5): e208297.
- Mittlbock M, Schemper M (1996) Explained variation in logistic regression. Statistics in Medicine 15(19): 1987-1997.
- https://www.who.int/campaigns/connecting-the-world-to-combat-coronavirus/healthyathome/
- https://www.cdc.gov/coronavirus/2019-ncov/daily-life-coping/managing-stress-anxiety.html
© 2021 Lilian T. This is an open access article distributed under the terms of the Creative Commons Attribution License , which permits unrestricted use, distribution, and build upon your work non-commercially.
 a Creative Commons Attribution 4.0 International License. Based on a work at www.crimsonpublishers.com.
Best viewed in


.jpg)


 Editorial Board Registrations
 Submit your Article
 Refer a Friend
 Advertise With Us
.jpg)


.jpg)


.bmp)
.jpg)
.png)
.jpg)


.jpg)


.png)

.png)


.png)


